


Introduction
With the advancement of modern technology and diversification or increasing of needs, civil engineering structures are expected to be multifunctional [Reference Han, Zhang and Ou1]. It is desirable to monitor the changes occurring in structures that are under construction or completed. Monitoring the structure allows timely and effective actions to be taken [Reference Sony, Laventure and Sadhu2]. The fact that the changes in the structure could not be detected visually, the destructive test methods are not real-time and causes damage to the structure, the need for specialists and special equipment for detection of changes occurred in a construction directed the researchers to find new methods. One of these methods is the health monitoring of the building through the sensors embedded in the concrete structures [Reference Ai, Zhu and Luo3–Reference Song, Hou, Guo, Wang, Tong and Wu8].
The design of new sensors with different methods enables more rational approaches and appropriate sensor selection to assess of differences in a structure. Sensors-embedded cement-based composites are used effectively in subjects such as monitoring strength development at early and later ages [Reference Narayanan, Kocherla and Subramaniam9], determination of deteriorations in a structure due to harsh environmental conditions [Reference Teng, Kot, Muradov, Shaw, Hashim, Gkantou, Al-Shamma and Uk10], detection of cracks in a structure [Reference Chakraborty, Katunin, Klikowicz and Salamak11], detection of different stresses on a structure [Reference Arhant, Meek, Penumadu, Davies and Garg12], etc.
The use of embedded sensors in structures that are constructed or are under construction is one of the most effective methods used for long-term health monitoring [Reference Shanglin Song, Hou, Guo, Wang and Tong4]. Thanks to the embedded sensors, changes in the structure can be learned and evaluated in real time. Usually, changes in sensor-embedded structures are associated with changes in the signal sent to the sensor. As a result of the relationship established between the signal and the changed structure, damage assessment is made.
Revelation of damage assessment, temperature and humidity changes occurring in a structure is critical for structural health monitoring [Reference Han, Ma, Xu and Liu13–Reference Hanif, Ibrahim, Ghaedi, Hashim and Javanmardi15]. Detection of deformations and cracks caused by exceed loads on the structure allows for the necessary decisions to be made for repair works and for evacuating the livings safely from the structure. Determination of the temperature in a structure before reaching the critical values allows the structure to be interfered without deterioration. Even structures where temperature change is detected can be used as a fire sensor. The determination of moisture content in the structure is important for preventing the deteriorations caused by moisture. Water absorption into the structure can bring progresses of deteriorations such as acid attack, sulfate attack, freeze–thaw cycles, and corrosion of the reinforcement elements.
The use of sensor structures may be limited due to the high cost and inability of providing [Reference Das and Saha16]. For these reasons, in the presented study, an antenna-based sensor with low cost and very easy application is developed. The sensor embedded in the structure is designed with a copper wire that is easily available on the market. Although there are some studies on temperature and humidity sensing of cementitious composites in the literature [Reference Bhattacharyya, Floerkemeier, Sarma and Deavours17–Reference Zhou, Deng, Yu, Li, Wu and Yin19], this study investigates real-time damage, humidity, and temperature monitoring in reinforced and non-reinforced concrete structures. As to author's best knowledge, there is no such a comprehensive study on damage, humidity, and temperature monitoring in reinforced and non-reinforced concrete structures with a single-dipole antenna with low cost and very easy application.
In this study, dipole antenna is designed with a copper wire. The designed antennas are embedded in concrete beams with and without reinforcement. The reason for using these two different beams is to see if the reinforcement would have an effect on the antenna. Electromagnetic (EM) waves are sent to antennas embedded in reinforced and non-reinforced concrete and the relationship between reflected waves, deformation temperature change, and moisture content is investigated. By looking at the resulting relationship, it is aimed to determine the deformation (reinforced concrete), temperature change (reinforced concrete and concrete), and moisture content (reinforced concrete and concrete) of the cement-based structures with the designed dipole antenna.
Materials and method
Crushed fine and coarse calcareous aggregates, cement, and water are used in the concrete mixture. The cement:aggregate:water ratio in the mixture is kept constant as 1:3:0.5. Half of the total aggregate used in the mixture is the fine aggregate with a maximum grain diameter of 4 mm and the other half is the coarse aggregate with a maximum grain diameter of 16 mm. For the concrete mixture, a speed-controlled power-driven revolving pan mixer is used. After mixing the dry ingredients for 5 min, water is added to the dry mixture. The concrete mixture is mixed for another 5 min until it reached a homogeneous appearance. The produced concrete is poured into prismatic molds, with and without reinforcement, in the size of 100 mm × 100 mm × 500 mm for use in the tests. The reinforcement element consists of four Ø8 rebar and six Ø4 stirrups with equal spacing. The designed antenna-based sensors are embedded in the concrete as shown in Fig. 1. Reinforced and non-reinforced concretes with sensors inside are removed from the molds 24 h after pouring them into the molds. The samples taken out of the molds are cured in a water tank under laboratory conditions for 27 days. The 28-day samples are subjected to three-point bending, water content detection, and elevated temperature tests. EM tests are applied to the tested samples simultaneously.

Fig. 1. (a) Sensor-embedded reinforced beam. (b) Sensor-embedded concrete beam. (c) Final versions of sensors embedded structures.
EM tests are conducted with a Rohde Schwarz ZVL vector network analyzer. All measurements are made with a power level of 10 dBm at each frequency.
Antenna design
In this study, a half-wave dipole antenna which is also known as Hertzian dipole is designed. This antenna type consists of two wires (or rods) fed in the center. Photograph of the designed dipole antenna is shown in Fig. 2. Each element of the antenna has the length of approximately L = λ/4. Thus, the total length of the antenna is about 2L = λ/2 (half-wavelength). Here, λ is the wavelength which is proportional with the operating frequency (f) and the speed of light and it can be calculated as below:


Fig. 2. Dipole antenna.
This type of antenna produces linearly polarized wave and has a radiation pattern of a doughnut shape. The electric and magnetic fields from the dipole antenna can be found as follows [Reference Balanis20]:


This derivation is for free-space radiation. However, when we place the EM radiator, which is the dipole in our case, into a medium other than free space, the direction of energy flow may change.
Another important parameter that should be closely examined in antenna design is the return loss (S 11). This parameter represents the reflected energy rate for a single-port system. Thus, by using this parameter, it is possible to characterize the antenna's radiation behavior. The medium in which the antenna is placed affects this ratio directly, thus, checking out the return loss will give an idea about the material forming the medium which is concrete samples in our case. Return loss, or S 11 is generally shown in decibels (dB) and S 11 = 0 dB implies that all the energy we are sending through the antenna terminal is reflected back to our feeding network. Return loss can easily be calculated as below:

Here, VSWR refers to the voltage standing wave ratio which is closely associated with the reflection coefficient which can be calculated as below:

Three-point bending test
The three-point bending test is carried out using the universal hydraulic bending test machine with a capacity of 15 kN. Monotonic loading on the test reinforced concrete sample is continued until wide cracks are obtained. The load is applied to the sample from the upper middle point. The distance between the two supports on which the sample is placed is 400 mm. To measure the deflection of the sample under test, digital gage is placed at the bottom midpoint of the sample. The deflection formed in the test sample for the applied load is recorded to be compared with the EM data that changed as a result of the increase in deformation. The test setup is presented in Fig. 3.

Fig. 3. Three-point bending test setup.
Water content measurement
Fully saturated reinforced and non-reinforced concrete samples cured in water for 28 days are gradually dried in an oven with a temperature of 60°C. The 28-day fully saturated samples are first electromagnetically tested and then weighed. Weighed samples are left in a 60°C oven for a while, then the samples were removed and again electromagnetically tested and weighed. These procedures are repeated until the concrete is completely dry. The results of these two experiments are recorded to establish a relationship between them. In addition, it is aimed to investigate how this relationship would be in reinforced and non-reinforced concrete. The test setup is shown in Fig. 4.
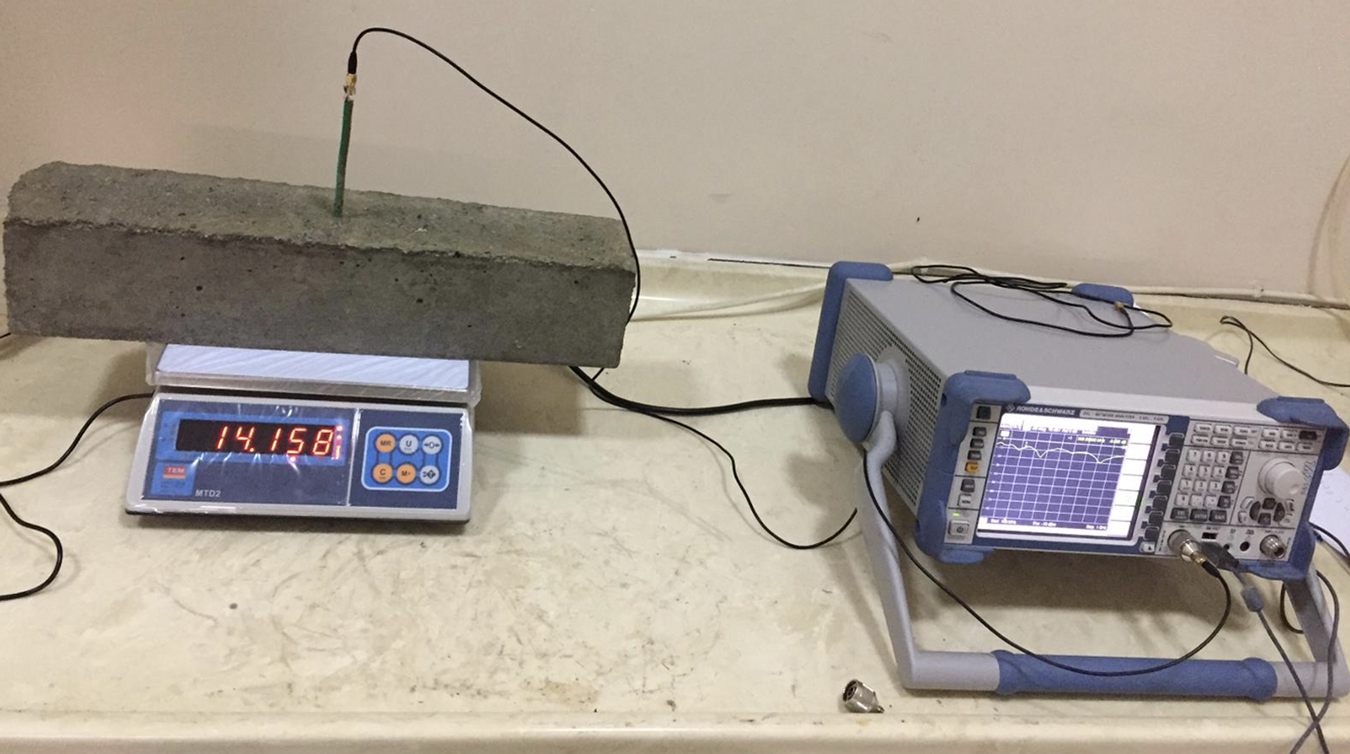
Fig. 4. Water content versus EM test setup.
Temperature measurement
Completely dry reinforced and non-reinforced concrete samples are tested electromagnetically after being kept in an oven for 2 h at different temperatures. The 30-day test samples are first kept in a 25-degree oven for 2 h and then an EM test is applied. The same samples are placed in the oven again before the EM test, but this time after waiting 2 h at 50 degrees, the EM tests are applied. The same procedures are repeated for temperatures of 75 degrees and 100 degrees. As a result of the tests, it is aimed to establish a relationship between sample temperatures and simultaneous responses of samples to EM waves. In addition, it is also aimed to investigate how this relationship would be in reinforced and non-reinforced concrete. The test setup is shown in Fig. 5.

Fig. 5. EM measurement of reinforced and non-reinforced concrete.
Results and discussion
Load–displacement sensing
Figure 6 shows three-point bending test results of the reinforced concrete. The figure presents the load–displacement graph of the reinforced beam. The graph shows the instant strain occurring in the reinforced concrete structure in response to the applied monotonic load. The load displacement graph shows the expected results. The load–displacement curve continues linearly up to 730 kg. Displacement increased while the load at about 850 kg load is constant. After 3.87 mm displacement, load decreases while displacement gradually increases. EM measurements are made simultaneously as soon as the values at the points marked on the graph (1st reading, 2nd reading, 3rd reading, etc.) are observed. Photograph of the reinforced beam at 1st reading to 8th reading are shown in Fig. 7. The photographs belong to the moments when EM tests are performed. A relationship is established between the load, displacement, and EM wave reflection values obtained at these moments.

Fig. 6. Load–displacement graph of the reinforced concrete.

Fig. 7. Photographs taken at (a) 1st, 2nd, and 3rd reading, (b) 4th reading, (c) 5th reading, (d) 6th reading (e) 7th reading, and (f) 8th reading.
The reflection values obtained as a result of EM measurements at the reading moments are presented in Fig. 8. As it can be understood from the figure, the reflection values versus the load give different reactions. With increasing displacement, shifts are observed in both magnitude values and resonance frequencies of the reflection parameter. Resonance frequency and magnitude in dB values are 410 MHz and −21.09 dB for the first reading, while 429 MHz and −25.18 dB for the final reading.

Fig. 8. S 11 values of reinforced concrete beam under different loads.
In Fig. 9, the magnitude and frequency values of the reflection parameters obtained as a result of EM tests and the displacement occurring as a result of the applied monotonic load are observed. A trend has been observed both in resonance frequency and S 11 in dB values, with increasing deformation (crack width) occurring in the beam. As can be observed from the figure, S 11 in dB values decrease with an increasing displacement in reinforced concrete. Resonant frequency values increase until 6th reading with an increasing displacement and then decrease slightly. With the help of these trends observed in both S 11 values and resonance frequency values, it is thought that deformations occurring in the reinforced beam can be estimated.
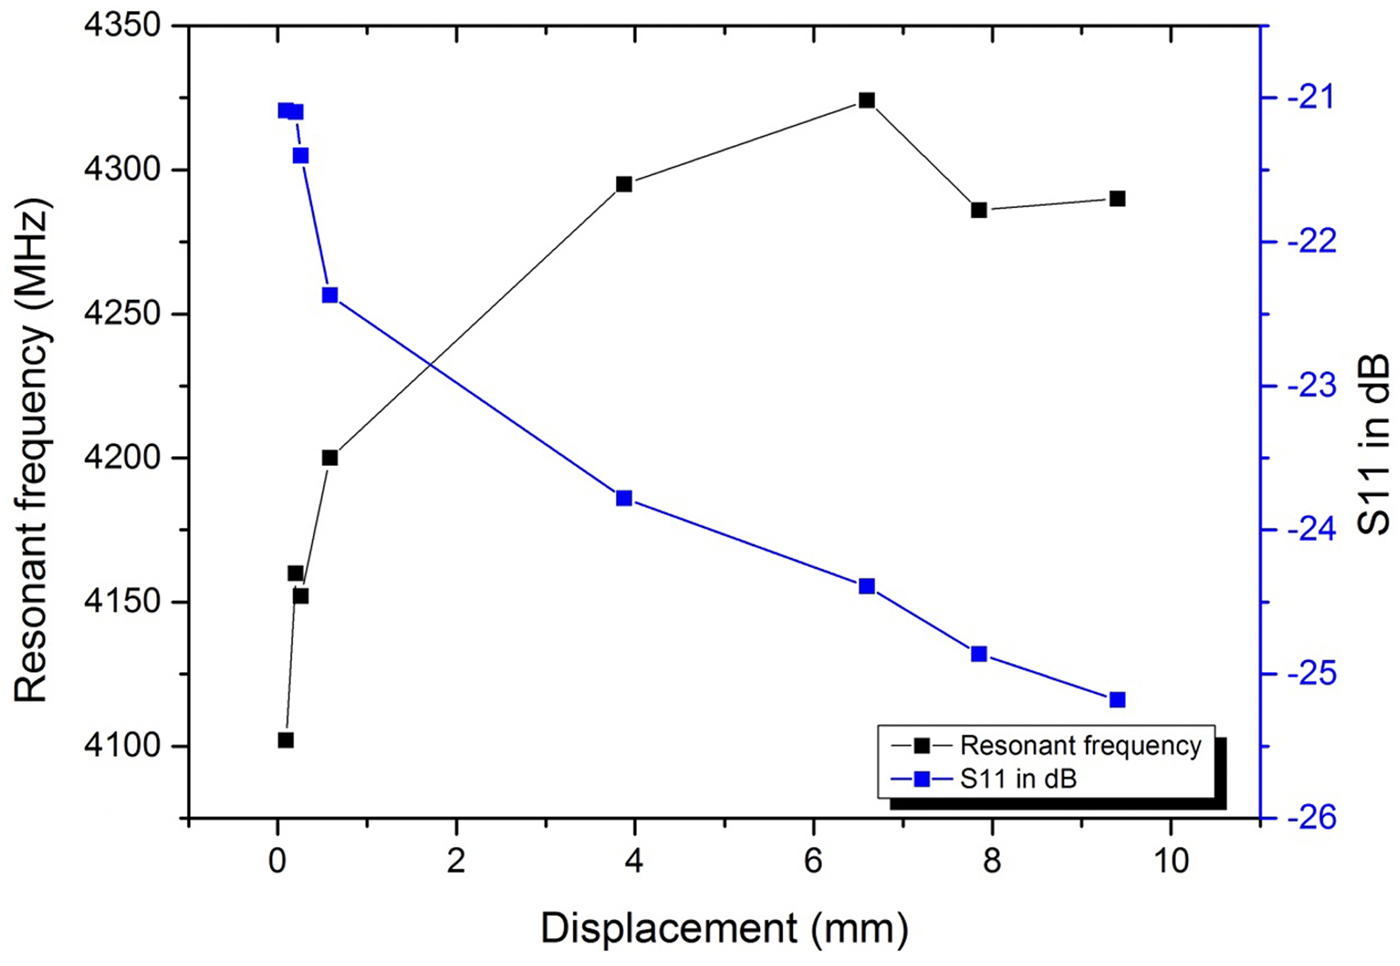
Fig. 9. Resonant frequency and S 11 in dB changes with respect to displacement.
In Fig. 10, the load–displacement values obtained as a result of three-point bending test and the resonant frequencies of the reflection coefficient estimated with EM measurement are seen. A similar relationship between load–displacement is also observed between resonance frequency and displacement. Looking at this close relationship, when the displacement increases, it is understood that the changes in the applied load and the resonance frequency are in a similar trend. Considering the aforementioned relationships, deformations that may occur under load in a structure are thought to be detected with the help of dipole antenna-based sensor-embedded structures.

Fig. 10. Load and resonant frequency changes with respect to displacement.
Water content sensing
In this part of the study, it is aimed to detect the water content of concrete and reinforced concrete structures with the dipole antenna. The 28-day fully saturated samples are first surface dried with a towel after taking them from the water tank. The surface-dried fully saturated samples are weighed and EM measurement is conducted. After that, the specimens are kept in a furnace under 60°C for a while. The partially dried samples (taken from the furnace) are retested. This process is repeated until the samples are completely dry. All samples, except for the samples that are fully saturated, have a temperature of 60°C when tested. The temperature of the saturated samples is measured as 23°C when tested.
Figure 11 shows the S 11 in dB values of dipole antenna-embedded concrete beam having different moisture contents. The relationship between the relative humidity of the concrete and S 11 in dB values determined at a frequency of 440 MHz. It is thought that by evaluating S 11 in dB values at this frequency, it is possible to have idea about the moisture content of the concrete. It is determined that as the relative humidity of the concrete increases, S 11 values decrease [Reference Zhou, Deng, Yu, Li, Wu and Yin19].

Fig. 11. S 11 in dB values of dipole antenna-embedded concrete beam having different moisture contents.
Figure 12 shows the S 11 in dB values of dipole antenna-embedded reinforced concrete beam having different moisture contents. A relation is observed between relative humidity of concrete and resonance frequencies. It is established that it is possible to have idea about the moisture content of reinforced concrete by evaluating the resonant frequencies of the dipole antenna. The sensor antenna has been determined that as the relative humidity of the reinforced concrete increases, resonant frequency increases. Although the reinforced concrete has 100% relative humidity, the sensor antenna has 420 MHz resonant frequency, while the reinforced concrete has 0% relative humidity, the sensor antenna has 401 MHz resonant frequency.
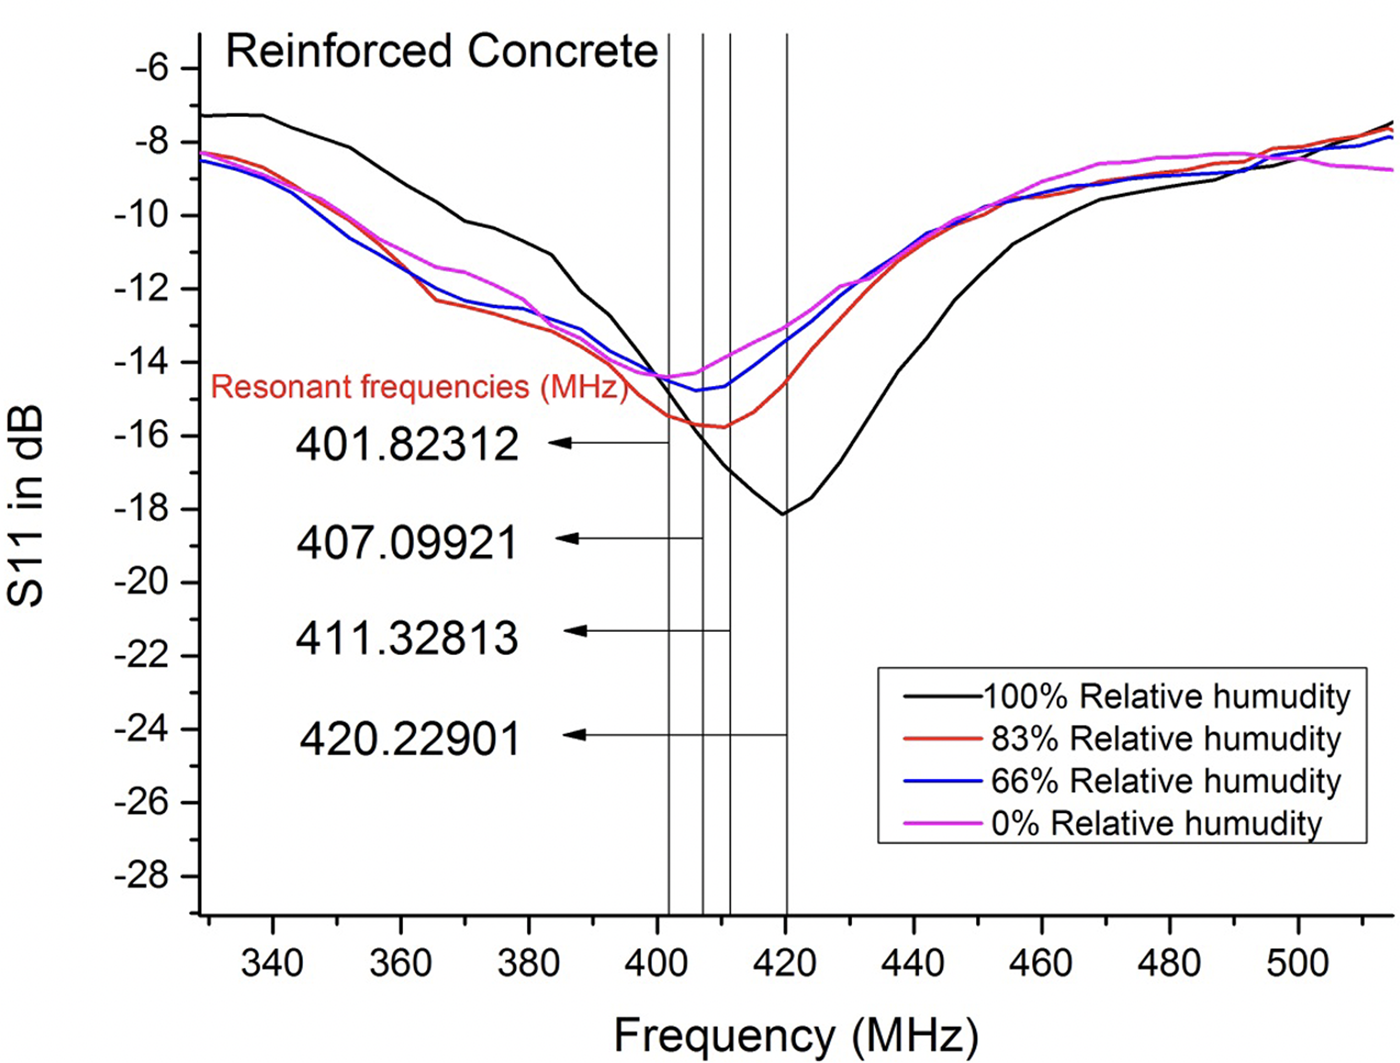
Fig. 12. Resonant frequencies of dipole antenna-embedded reinforced concrete beam having different moisture contents.
Elevated temperature sensing
In this part of the study, dipole antenna embedded reinforced and non-reinforced concrete beams, which are kept at 25, 50, 75, and 100 degrees for 2 h, are examined. EM measurements of the samples exposed to specified temperatures for 2 h are evaluated. The S 11 in dB values and resonance frequencies of the samples exposed to increased temperatures are determined. A relationship is established between samples with increasing temperature and EM measurements.
Figure 13 shows the reflection values of concrete beam whose temperatures gradually increase. According to the evaluated results, it is possible to have idea about the temperature of the concrete by determining the resonant frequencies of the dipole antenna. It is observed that there is a decrease in the resonance frequency values of concrete beams with increasing temperature. Resonance frequency value of concrete which is kept at 100°C is around 621 MHz, while resonance frequency value of concrete which is kept at 25°C is around 653 MHz. This frequency shifts are caused by temperature dependency of concrete samples as mentioned in the literature [Reference Makul, Rattanadecho and Agrawal21, Reference Xu, Banerjee, Wang, Huang and Cheng22]. The dielectric constant of a cement and concrete sample changes with temperature, which changes resonance bands as illustrated in Fig. 13.

Fig. 13. Resonant frequencies of dipole antenna-embedded concrete beam having different temperatures and 0% relative humidity.
For Figs 8, 11, 12, and 14, a good agreement with EM measurements and mechanical, water content and temperature measurements has been observed around 440 MHz frequency. However, for Fig. 13, a relationship between concrete temperature and EM measurements has been observed only between 620 and 660 MHz frequency ranges.

Fig. 14. S 11 in dB values of dipole antenna-embedded reinforced concrete beam having different temperatures and 0% relative humidity.
Figure 14 shows the reflection values of the reinforced concrete beam whose temperatures gradually increase. It is observed that there is an increase in S 11 values of reinforced concrete beam whose temperature increases. S 11 value of the reinforced concrete beam kept at 100 degrees is around −13 dB while S 11 value of the reinforced concrete beam kept at 25 degrees is around −18 dB. Thus, it is thought that it is possible to have idea about the temperature of the concrete by evaluating the magnitude of the reflected wave at 420 MHz frequency. These finding are in line with ref. [Reference Liu, Deng, He, Li, Liang and Zhou18].
In brief, although there are similar studies in the literature with the current study, this study is proposed to sense deformation, water content, and temperature of concrete structures with a single-antenna element which has advantages such as low cost and easy fabrication. Table 1 shows performance analysis of the designed antenna. As observed in the table, the proposed sensor-based system offers deformation sensing, temperature sensing, humidity sensing, ultra-low cost, and real-time measurement advantages at the same time. Although there is need for vector network analyzer (VNA) for electrical measurement for the proposed system, the material embedded in the concrete structure is easily available in local markets and the sensor can be easily produced.
Table 1. Performance analysis of the designed dipole antenna sensor

Conclusion
In this study, real-time damage assessment, humidity, and temperature monitoring are aimed to be determined by embedding the dipole antenna in the concrete structures. Health monitoring of the concrete structures is aimed to be evaluated with the signals obtained from the designed dipole antenna. Whether the signals emitted from the antenna would be affected by steel reinforcements that are inserted in concrete structure is another research topic of the study. Load–displacement measurements on the reinforced beam and the signals emitted from the antenna are evaluated simultaneously. In addition, determination of moisture content and temperature increase in reinforced and non-reinforced concretes is established with signals emitted from the antenna. Close relationships are identified when the load–displacement test results are compared with EM measurements made instantly during the test. As the strain increases in the reinforced beam, resonance frequency decreases and S 11 in dB increases. In addition, compatible trends are observed between the resonance frequency and the applied load with increasing deformation. In the experiments for the determination of moisture content, it is understood that the S 11 in dB values of embedded sensors should be evaluated for non-reinforced concrete, and the changes in the resonance frequency of embedded sensors should be taken into consideration for the reinforced concrete. In the experiments conducted to determine the temperature increase, it is observed that the resonance frequency values of the embedded antenna should be examined for non-reinforced concrete and S 11 values for reinforced concrete. The findings obtained as a result of the studies support that the designed dipole antenna can be used for real-time damage assessment, humidity, and temperature monitoring in reinforced and non-reinforced concrete structures. In practice in the field, the effect of sudden environmental change on antenna can be eliminated by increasing measurement duration and using a comparison algorithm between measurement results and estimated/expected values. Consequently, by knowing the initial ambient conditions such as concrete moisture content, concrete temperature, concrete deformation (first reading of the sensor gives the initial conditions), the proposed sensor can be used for structural health monitoring.
 Murat Ozturk received a degree in engineering from Gaziantep University in 2014 and a Ph.D. degree in civil engineering in 2021. His main research interests are electromagnetic shielding effectiveness properties of cement-based materials, self-sensing building materials, and electrical properties of cement-based composites.


