


I INTRODUCTION
In a recent study, we reported the synthesis and cytotoxic activities of a series of novel condensed triazol compounds, triazolothiadiazine derivatives having non-steroidal anti-inflammatory drugs moieties (Aytaç et al., Reference Aytaç, Durmaz, Houston, Çetin-Atalay and Tozkoparan2016). These new hybrid compounds were found to be promising drug candidates for epithelial cancers, especially liver cancer. The preliminary structure–activity relationship studies revealed that condensing an aminomercaptotriazole scaffold with a heterocyclic ring is critical for enhanced cytotoxic activity. These promising results prompted us to make further modifications of the chemical structures of the mentioned compounds. As part of our ongoing interest, we designed and synthesized new analog compounds, named 1,2,4-triazolo[3,4-b]-1,3,4-thiadiazole, by bioisosteric replacement of the triazolothiadiazine ring with a triazolothiadiazole one. The title compounds are two examples of this series having cytotoxic activity.
The authors present herein the synthesis and characterizations of the compounds (1) and (2), named 3-[1-(2-fluoro-4-biphenyl)ethyl]-6-(4-fluorophenyl)-1,2,4-triazolo[3,4-b]-1,3,4-thiadiazole (C23H16F2N4S) and 3-[1-(2-fluoro-4-biphenyl)ethyl]-6-(4-chlorophenyl)-1,2,4-triazolo[3,4-b]-1,3,4-thiadiazole (C23H16ClFN4S), respectively, as well as structure determination by synchrotron powder X-ray diffraction (PXRD).
II. EXPERIMENTAL
A. Instrumentation
Melting point was determined on a Thomas Hoover capillary melting point apparatus (Philadelphia, PA, USA) and was uncorrected. Infrared (IR) spectra were recorded on a Perkin Elmer 1720X FT-IR spectrometer (Beaconsfield, UK) by direct sampling of the compounds. 1H NMR spectra were recorded on a Varian Mercury 400, a 400 MHz High Performance Digital FT-NMR instrument (Varian, Palo Alto, CA, USA) in CDCl3 using TMS as an internal standard. High-resolution mass spectra data were collected with a Waters Micromass ZQ LC-MS Spectrometer (Milford, MA, USA) instrument using the ESI (+) method. Elemental analyses of the resulting compounds were performed with Leco CHNS 932 analyzer at the Ankara University, Faculty of Pharmacy Central II Laboratory and data were determined within ±0.4% of the theoretical values.
B. Synthesis of the compounds
The syntheses of the title compounds were realized in two steps. First, commercially available flurbiprofen reacted with thiocarbohydrazide at its melting point (about 170 °C) to form aminomercaptotriazole (Aytaç et al., Reference Aytaç, Durmaz, Houston, Çetin-Atalay and Tozkoparan2016). In the second step, the target compounds were easily obtained in moderate yields with the reaction aminomercaptotriazole scaffold and 5-fluoro/4-chloro benzoic acid derivatives in phosphorus oxychloride (Figure 1) (Ilango and Valentina, Reference Ilango and Valentina2010). Finally, the compounds were fully characterized by IR, proton nuclear magnetic resonance (1H-NMR), mass spectrometry, and elemental analysis. Both analytical and spectral data of the compounds were in full agreement with the proposed crystal structures.

Figure 1. Synthetic pathway of the compounds (1) and (2).
3-[1-(2-Fluoro-4-biphenyl)ethyl]-6-(4-fluorophenyl)-1,2,4-triazolo[3,4-b ]-1,3,4-thiadiazole (C 23 H16F2N4S) (1). 0.24 g (57.35%). M.p.: 235–237 °C. IR: νmax: 3080, 3065 (arom. C–H, stretching), 2997 (alip. C–H, stretching), 1599 (C = N, stretching), 1324 (C–N, stretching) cm−1; 1H-NMR (CDCl3) δ (ppm) 1.83 (3H, d, CH 3 -CH-), 4.83 (1H, q, CH3-CH-), 7.32–7.53 (10H, m, arom.H), 8.02 (2H, dd, arom.H); MS (ESI+) m/z calcd for C23H17F2N4S (M+H)+ 419.11, found 419.16; Anal. Calcd. for C23H16F2N4S.1/2H2O: C, 64.62; H, 4.01; N, 13.11; S, 7.50. Found: C, 64.32; H, 3.99; N, 12.96; S, 7.56.
3-[1-(2-Fluoro-4-biphenyl)ethyl]-6-(4-chlorophenyl)-1,2,4-triazolo[3,4-b ]-1,3,4-thiadiazole (C 23 H16ClFN4S) (2). 0.13 g (31.36%). M.p.: 222–224 °C. IR: νmax: 3063 (arom. C–H, stretching), 2946 (alip. C–H, stretching), 1596 (C = N stretching), 1303 (C–N stretching) cm−1; 1H-NMR (CDCl3) δ (ppm) 1.83 (3H, d, CH 3 -CH-), 4.84 (1H, q, CH3-CH-), 7.32–7.53 (8H, m, arom.H), 7.69 (2H, d, arom.H), 7.96 (2H, d, arom.H); MS (ESI+) m/z calcd for C23H17FClN4S (M+H)+ 435.08, found 435.07; Anal. Calcd. for C23H16FClN4S.1/2H2O: C, 62.23; H, 3.86; N, 12.62; S, 7.22. Found: C, 62.39; H, 3.86; N, 12.67; S, 7.28.
C. PXRD data collection and structure determination
Powder X-ray diffraction measurements of the compounds were first performed on a Bruker Advance D8 X-ray laboratory diffractometer with Mo-anode. Although the powder patterns were indexed successfully, strong peak overlap precluded structure solution. Then, high-resolution synchrotron powder diffraction data of the compounds (1) and (2) were collected at the beamline 11-BM at the Advanced Photon Source (APS), Argonne National Laboratory via mail-in program with a wavelength of 0.459169 Å. The beamline has a double-crystal Si (111) monochromator and unique multi-analyzer detection assembly, consisting of 12 independent Si (111) crystal analyzers and LaCl3 scintillation detectors. Discrete detectors covering an angular range from −6.5 to 28° 2θ are scanned over a 50° 2θ range; with data points collected every 0.001° 2θ and scan speed of 0.1° s−1 at room temperature (295.0 K). A mixture of NIST standard reference materials, Si (SRM 640c) and Al2O3 (SRM 676) are used to calibrate the wavelength of the X-ray beam. The powder samples were ground lightly in a mortar and filled in a 0.8 mm diameter kapton capillary. The capillary spun at 60 Hz during data collection.
Indexing of the powder patterns of both compounds was realized using TOPAS 4.2 software (Coelho, Reference Coelho2009) leading to the triclinic cells; a = 6.374, b = 11.363, c = 14.091 Å, α = 80.1°, β = 85.2°, γ = 81.0°, V = 991.4 Å3 (Gof = 99.47) for (1) and a = 6.536, b = 11.557, c = 14.017 Å, α = 80.4°, β = 84.8°, γ = 79.4°, V = 1024.1 Å3 (Gof = 94.93) for (2). The space group
 $P\bar 1$
was assigned according to the indexing results and confirmed by solution and refinement of the structures. The refinements of the unit-cell parameters were performed using LeBail refinement with the TOPAS Academic v5.1 (Coelho, Reference Coelho2012) program. The backgrounds were fitted using five-term Chebyshev polynomials. The peak asymmetry was fitted by the simple axial divergence model of Cheary and Coelho (Cheary and Coelho, Reference Cheary and Coelho1998a,Reference Cheary and Coelhob). The modified Thompson–Cox–Hastings (Thompson et al., Reference Thompson, Cox and Hastings1987) pseudo-Voigt profile shape function was used with anisotropic peak broadening adjusted by using second-order spherical harmonics (Järvinen, Reference Järvinen1993). The R-factors and goodness-of-fit indicator found after refinements were R
wp = 7.387%, R
exp = 6.945%, χ2
= 1.064 for (1) and R
wp = 8.056%, R
exp = 7.026%, χ2
= 1.147 for (2). PXRD data of both compounds are given in Table I for (1) and Table II for (2). The d
obs values come directly from the observed PXRD data and are used to determine the lattice parameters and from them the d
cal values. The peak that has the strongest intensity in the entire pattern is assigned of 100 and other lines are scaled relative to this value for both data sets. After the indexing of the patterns and the refinement of the cell parameters, the next step toward structure solution was the preparation of a structural model. The molecules for (1) and (2) were built including H atoms and optimized using the Avogadro program (Hanwell et al., Reference Hanwell, Curtis, Lonie, Vandermeersch, Zurek and Hutchison2012). These molecules were used as fragments without H atoms to solve the structures. In the process of crystal structure determination of (1) a simulated annealing algorithm implemented in DASH (David et al., Reference David, Shankland, van de Streek, Pidcock, Motherwell and Cole2006) was used. During the simulated annealing calculations, the position and orientation of the molecule in the unit cell as well as the molecular conformation and torsion angles were changed randomly. After nearly 401 500 movements in the simulated annealing, the best solution with the lowest profile (χ2
= 10.34 and intensity χ2
= 64.79) was gained. Using FOX instead of DASH permitted the structure solution of (2). The structure of (2) was solved using the Monte Carlo simulated annealing (parallel tempering algorithm) method implemented in the FOX program (Favre-Nicolin and Cerny Reference Favre-Nicolin and Cerny2002) by free rotations of torsion angles. The best solution with the overall best cost of 41952.61 was obtained.
$P\bar 1$
was assigned according to the indexing results and confirmed by solution and refinement of the structures. The refinements of the unit-cell parameters were performed using LeBail refinement with the TOPAS Academic v5.1 (Coelho, Reference Coelho2012) program. The backgrounds were fitted using five-term Chebyshev polynomials. The peak asymmetry was fitted by the simple axial divergence model of Cheary and Coelho (Cheary and Coelho, Reference Cheary and Coelho1998a,Reference Cheary and Coelhob). The modified Thompson–Cox–Hastings (Thompson et al., Reference Thompson, Cox and Hastings1987) pseudo-Voigt profile shape function was used with anisotropic peak broadening adjusted by using second-order spherical harmonics (Järvinen, Reference Järvinen1993). The R-factors and goodness-of-fit indicator found after refinements were R
wp = 7.387%, R
exp = 6.945%, χ2
= 1.064 for (1) and R
wp = 8.056%, R
exp = 7.026%, χ2
= 1.147 for (2). PXRD data of both compounds are given in Table I for (1) and Table II for (2). The d
obs values come directly from the observed PXRD data and are used to determine the lattice parameters and from them the d
cal values. The peak that has the strongest intensity in the entire pattern is assigned of 100 and other lines are scaled relative to this value for both data sets. After the indexing of the patterns and the refinement of the cell parameters, the next step toward structure solution was the preparation of a structural model. The molecules for (1) and (2) were built including H atoms and optimized using the Avogadro program (Hanwell et al., Reference Hanwell, Curtis, Lonie, Vandermeersch, Zurek and Hutchison2012). These molecules were used as fragments without H atoms to solve the structures. In the process of crystal structure determination of (1) a simulated annealing algorithm implemented in DASH (David et al., Reference David, Shankland, van de Streek, Pidcock, Motherwell and Cole2006) was used. During the simulated annealing calculations, the position and orientation of the molecule in the unit cell as well as the molecular conformation and torsion angles were changed randomly. After nearly 401 500 movements in the simulated annealing, the best solution with the lowest profile (χ2
= 10.34 and intensity χ2
= 64.79) was gained. Using FOX instead of DASH permitted the structure solution of (2). The structure of (2) was solved using the Monte Carlo simulated annealing (parallel tempering algorithm) method implemented in the FOX program (Favre-Nicolin and Cerny Reference Favre-Nicolin and Cerny2002) by free rotations of torsion angles. The best solution with the overall best cost of 41952.61 was obtained.
Table I. X-ray powder diffraction data of (1) [
 $P\bar 1$
, Z = 2], a = 6.373060(78), b = 11.362418(192), c = 14.088729(179) Å, α = 80.17399(70)°, β = 85.12037(79)°, γ = 80.98461(90)°, and V = 991.043(24) Å3.
$P\bar 1$
, Z = 2], a = 6.373060(78), b = 11.362418(192), c = 14.088729(179) Å, α = 80.17399(70)°, β = 85.12037(79)°, γ = 80.98461(90)°, and V = 991.043(24) Å3.

The particular peak that has the strongest intensity in the entire pattern is assigned an intensity of 100 and other lines are scaled relative to this value. The d obs values come directly from the observed PXRD data and are used to determine the lattice parameters and from them the d cal values. “I obs ” represents integrated intensity values and M represents “multiplicity”.
Table II. X-ray powder diffraction data of (2) [
 $P\bar 1$
, Z = 2], a = 6.537077(63), b = 11.557154(153), c = 14.013341(136) Å, α = 80.33277(62)°, β = 84.89220(61)°, γ = 79.39635(73)°, and V = 1024.004(20) Å3.
$P\bar 1$
, Z = 2], a = 6.537077(63), b = 11.557154(153), c = 14.013341(136) Å, α = 80.33277(62)°, β = 84.89220(61)°, γ = 79.39635(73)°, and V = 1024.004(20) Å3.

The particular peak that has the strongest intensity in the entire pattern is assigned an intensity of 100 and other lines are scaled relative to this value. The d obs values come directly from the observed PXRD data and are used to determine the lattice parameters and from them the d cal values. “I obs ” represents integrated intensity values and M represents “multiplicity”.
The same refinement steps described below were applied for both compounds. To perform the Rietveld refinements of the compounds the TOPAS Academic v5.1 (Coelho, Reference Coelho2012) program was used in 2θ range from 1.2 to 25° for (1) and from 1.5 to 25° for (2), because the higher angle portions did not contain visible peaks. The backgrounds were fitted using five-term Chebyshev polynomials. The peak asymmetry was fitted by the simple axial divergence model of Cheary and Coelho (Cheary and Coelho, Reference Cheary and Coelho1998a, Reference Cheary and Coelhob). The modified Thompson–Cox–Hastings (Thompson et al., Reference Thompson, Cox and Hastings1987) pseudo-Voigt profile shape function was used with anisotropic peak broadening adjusted by using second-order spherical harmonics (Järvinen, Reference Järvinen1993). During the refinement, unit-cell parameters, background, zero-point error, scale factor, peak width, and asymmetry parameters were refined together with non-hydrogen atomic coordinates. In the Rietveld refinements of the compounds, soft restraints were applied for all bond lengths, bond angles, and planar groups. For both structures, the following restraints were implemented. The values of the bond lengths and angles restraints of the triazolo-thiadiazole system were taken from the averaging values of the 1,2,4-triazolo[3,4-b]-1,3,4-thiadiazole fragment containing reference structures (Lu et al., Reference Lu, Zhang, Song, Tan and Shao2008; Khan et al., Reference Khan, Hameed, Tahir, Bokhari and Khan2009, Reference Khan, Zaib, Ibrar, Rama, Simpson and Iqbal2014; Fan et al., Reference Fan, Yang, Zhang, Wang, Cai, Zuo, Zheng and Song2010; Cansız et al., Reference Cansız, Cetin, Orek, Kocatepe, Sarac, Kus and Koparir2012; Wu, Reference Wu2013). The bond lengths of the triazolo-thiadiazole system of the structures were restrained to 1.4 (N1−N2), 1.32 (N1−C15), 1.37 (N3−C15), 1.36 (N3−C16), 1.31 (N2−C16), 1.38 (N3−N4), 1.30 (N4−C17), 1.77 (S1−C17), and 1.73 Å (S1−C16). The bond angles to 105.30 (N1−N2−C16), 111.44 (N2−C16−N3), 105.95 (C16−N3−C15), 108.09 (N3−C15−N1), 109.24 (C15−N1−N2), 109.30 (N3−C16−S1), 87.48 (C16−S1−C17), 117.06 (S1−C17−N4), 107.24 (C17−N4−N3), and 118.90° (N4−N3−C16) and for phenyl rings: d (C, C) = 1.4 Å, ∢ (C, C) = 120°. Except these restraints applied to (1) bond lengths were restrained to 1.34 (F2−C21), 1.34 (F1−C8), 1.49 (C4−C7), 1.53 (C10−C13), 1.53 (C13−C14), 1.50 (C13−C15), 1.48 Å (C17−C18), and the angles to 120.00 (F2−C21−C20), 120.00 (F2−C21−C22), 120.00 (F1−C8−C7), 117.00 (F1−C8−C9), 112.50 (C10−C13−C15), 114.50 (C10−C13−C14), 110° (C15−C13−C14). In the structure (2) bond lengths were also restrained to 1.34 (F1−C8), 1.70 (Cl1−C21), 1.48 (C17−C18), 1.50 (C13−C15), 1.54 (C13−C14), 1.53 (C10−C13), 1.48 Å (C4−C7), and the angles 117.00 (F1−C8−C9), 120.00 (F1−C8−C7), 120.00 (Cl1−C21−C20), 120.00 (Cl1−C21−C22), 111.50 (C14−C13−C15), 116.50 (C10−C13−C14), 111.00° (C15−C13−C10).
The coordinates of the atoms were refined one by one in the order of S, F, and O atoms for (1) and Cl, S, F atoms for (2). Then each ring was refined simultaneously one after another. Isotropic atomic displacement (B iso) values were constrained to be equal for all non-hydrogen atoms. Before the final refinement, the hydrogen atoms were placed geometrically to their calculated positions [C−H = 0.96 Å and B iso (H) = 1.2 B iso (C)] using Crystals program (Cooper et al., Reference Cooper, Thomson and Watkin2010). Their isotropic atomic displacement (B iso) values were constrained to be 1.2 times of the value of the carrier atom. The fractional coordinates of the hydrogen atoms were refined by riding motion approximation with a macro implemented in TOPAS that “rides” (restrains the distances between hydrogen and neighboring atoms) the H atoms to the ones with which they are associated. The reduced unit-cell parameters of both compounds were defined using LePage program (Spek, Reference Spek1988) and translated with the VESTA (Momma and Izumi, Reference Momma and Izumi2011) program at the end of the refinements. After the Rietveld refinements of the crystal structures, good agreements between calculated and experimental powder diffraction patterns were obtained [Figures 2 and 3; for (1) and (2), respectively]. The largest errors are in the shapes of the lowest angle peaks. The agreement factors are reported in Table III.
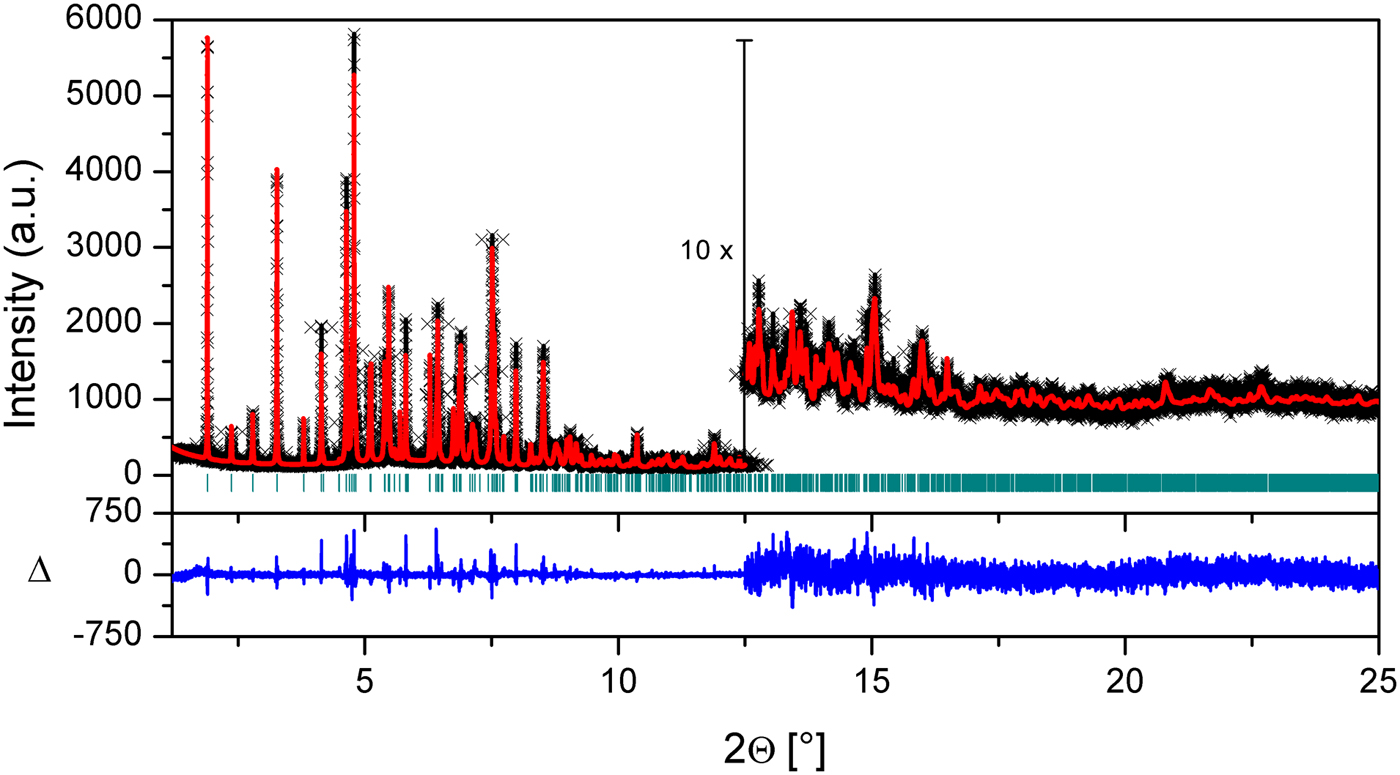
Figure 2. (Colour online) Plot of the final Rietveld refinement of (1). Black crosses represent observed data, the red line indicates the calculated pattern and the blue line at the bottom represents the difference between the observed and calculated patterns. Green vertical bars indicate Bragg reflections.

Figure 3. (Colour online) Plot of the final Rietveld refinement of (2). Black crosses represent observed data, the red line indicates the calculated pattern and the blue line at the bottom represents the difference between the observed and calculated patterns. Green vertical bars indicate Bragg reflections.
Table III. Crystal data and structure refinement parameters of (1) and (2).

III. DISCUSSION
The Ortep-3 (Farrugia, Reference Farrugia2012) diagrams of both compounds with thermal ellipsoids at the 50% probability level are shown in Figures 4 and 5 for (1) and (2), respectively. The selected bond lengths, bond angles, and torsion angles of both compounds are reported in Table IV. The molecular interactions and molecular geometry were calculated using Platon (Spek, Reference Spek2003), Mercury (Macrae et al., Reference Macrae, Edgington, McCabe, Pidcock, Shields, Taylor, Towler and van de Streek2006), and OLEX2 (Dolomanov et al., Reference Dolomanov, Bourhis, Gildea, Howard and Puschmann2009) programs. The crystal packings of both compounds with the intermolecular hydrogen bond interactions (Table V) projected onto the ac plane are shown in Figures 6 and 7 for (1) and (2), respectively.

Figure 4. (Colour online) Ortep diagram of (1). Thermal ellipsoids are shown at the 50% probability level.
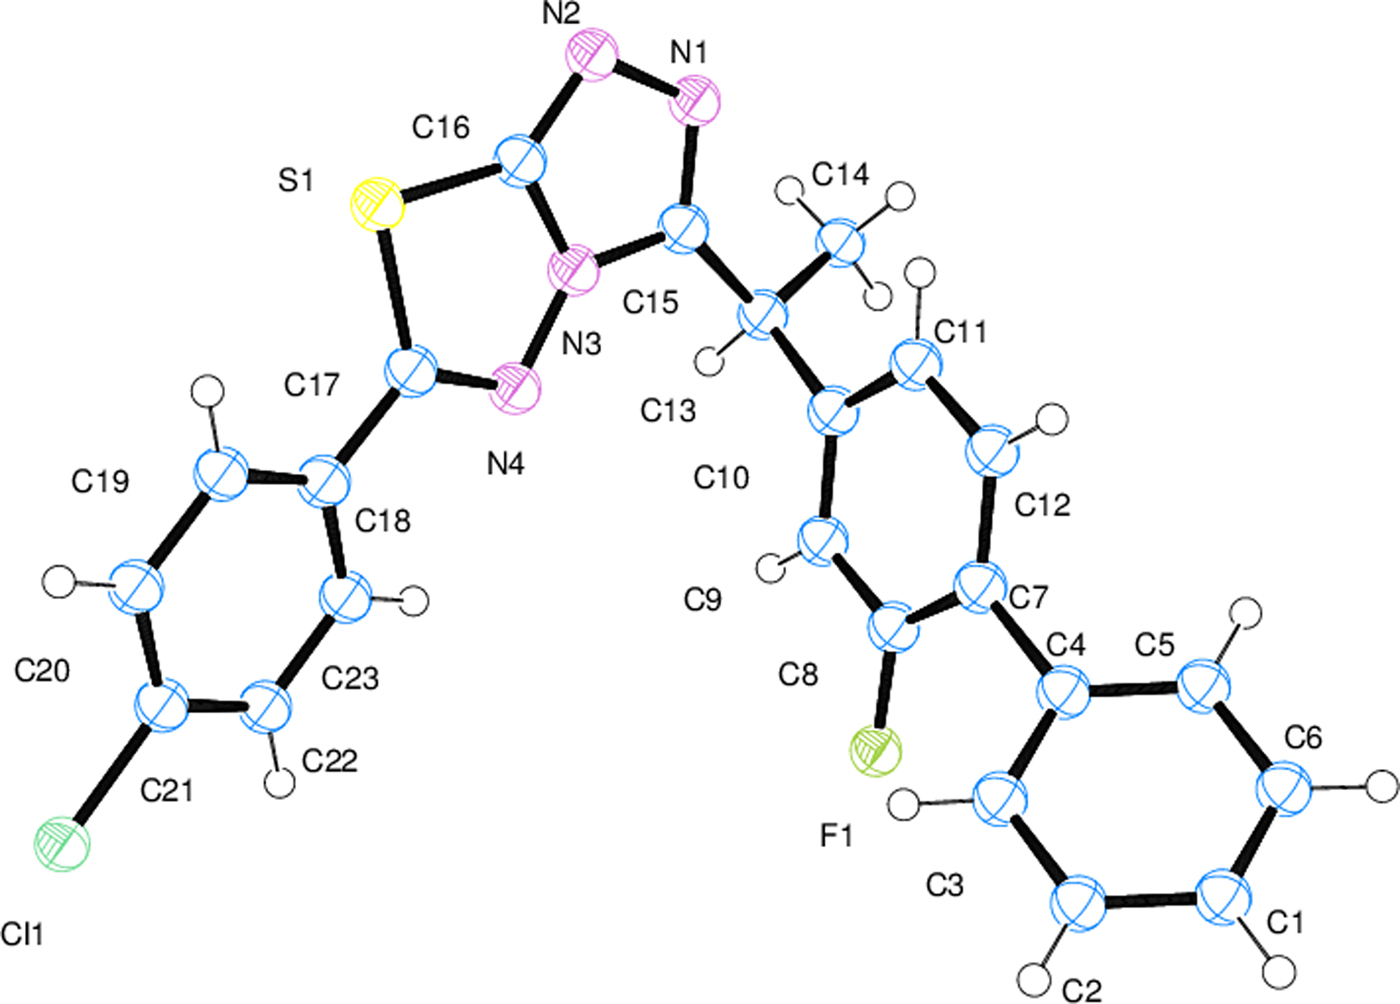
Figure 5. (Colour online) Ortep diagram of (2). Thermal ellipsoids are shown at the 50% probability level.

Figure 6. (Colour online) Crystal packing of (1) projected onto the ac plane and intermolecular hydrogen bond interactions.

Figure 7. (Colour online) Crystal packing of (2) projected onto the ac plane and intermolecular hydrogen bond interactions.
Table IV. Selected bond lengths and angles (Å, °) for (1) and (2).

Table V. Hydrogen bonding geometry (Å, °) of (1) and (2).
Symmetry codes: For (1): (i) −x, −y + 2, −z + 2; (ii) x + 1, y, z; (iii) −x + 1, −y + 1, −z + 2; (iv) −x−1, −y + 1, −z + 1; (v) −x, −y + 1, −z + 2; For (2): (i) −x, −y + 1, −z + 2; (ii) x + 1, y, z; (iii) −x + 1, −y, −z + 2; (iv) −x−1, −y, −z + 1, ; (v) −x, −y, −z + 2; Cg(3) : C1−C6 ring.
The average bond lengths and angles of ring systems (phenyl, 1,2,4-triazolo ring and 1,3,4-thiadiazole ring) are compatible with the reference structures (Lu et al., Reference Lu, Zhang, Song, Tan and Shao2008; Khan et al., Reference Khan, Hameed, Tahir, Bokhari and Khan2009; Fan et al., Reference Fan, Yang, Zhang, Wang, Cai, Zuo, Zheng and Song2010; Cansız et al., Reference Cansız, Cetin, Orek, Kocatepe, Sarac, Kus and Koparir2012; Wu, Reference Wu2013; Khan et al., Reference Khan, Zaib, Ibrar, Rama, Simpson and Iqbal2014) in both compounds. Intramolecular hydrogen bonds (Table V) support the planarity of both the crystal structures. As expected, all triazole-thiadiazole ring systems and phenyl rings are planar. The highest deviation from the average ring planes is 0.006 Å in the (C1−C6) ring for the both compounds; 0.002 Å in the (C7−C12) ring for (1) [0.005 Å for (2)] and 0.003 Å in the (C18−C23) ring for (1) [0.005 Å for (2)]. In both structures, the triazole-thiadiazole ring system is almost coplanar with mean deviations of 0.020 and 0.023 Å, and the dihedral angles are 2.96 and 3.41°, respectively, in (1) and (2). The dihedral angle between the triazole-thiadiazole ring system and the C18−C23 ring is 11.19° in (1) [11.62° in (2)], also with the C1−C6 ring is 59.39° in (1) [61.82° in (2)]. The C7−C12 ring is located almost perpendicular to triazole-thiadiazole ring system in both structures and the dihedral angles are 82.58° in (1) and 85.28° in (2).
Intermolecular hydrogen bonds link the molecules into a three-dimensional network (Table V). In both structures, there is a C−H⋯π intermolecular hydrogen-bonding interaction, which also plays a stabilizing role in molecular packing. The distance between the atom H221 and the centroid of the C1−C6 ring is 2.754(15) Å (symmetry code: −x, −y + 1, −z + 2) in (1) [2.737(16) Å (symmetry code: −x, −y, −z + 2) in (2)] and the centroid angle is 148.10(13)° in (1) (Figure 8) [151.30(13)° in (2) (Figure 9)] (Table V). The crystal structure of (2) is slightly more densely packed than the crystal structure of (1). In both structures, at the atom C13, there is a chiral center.
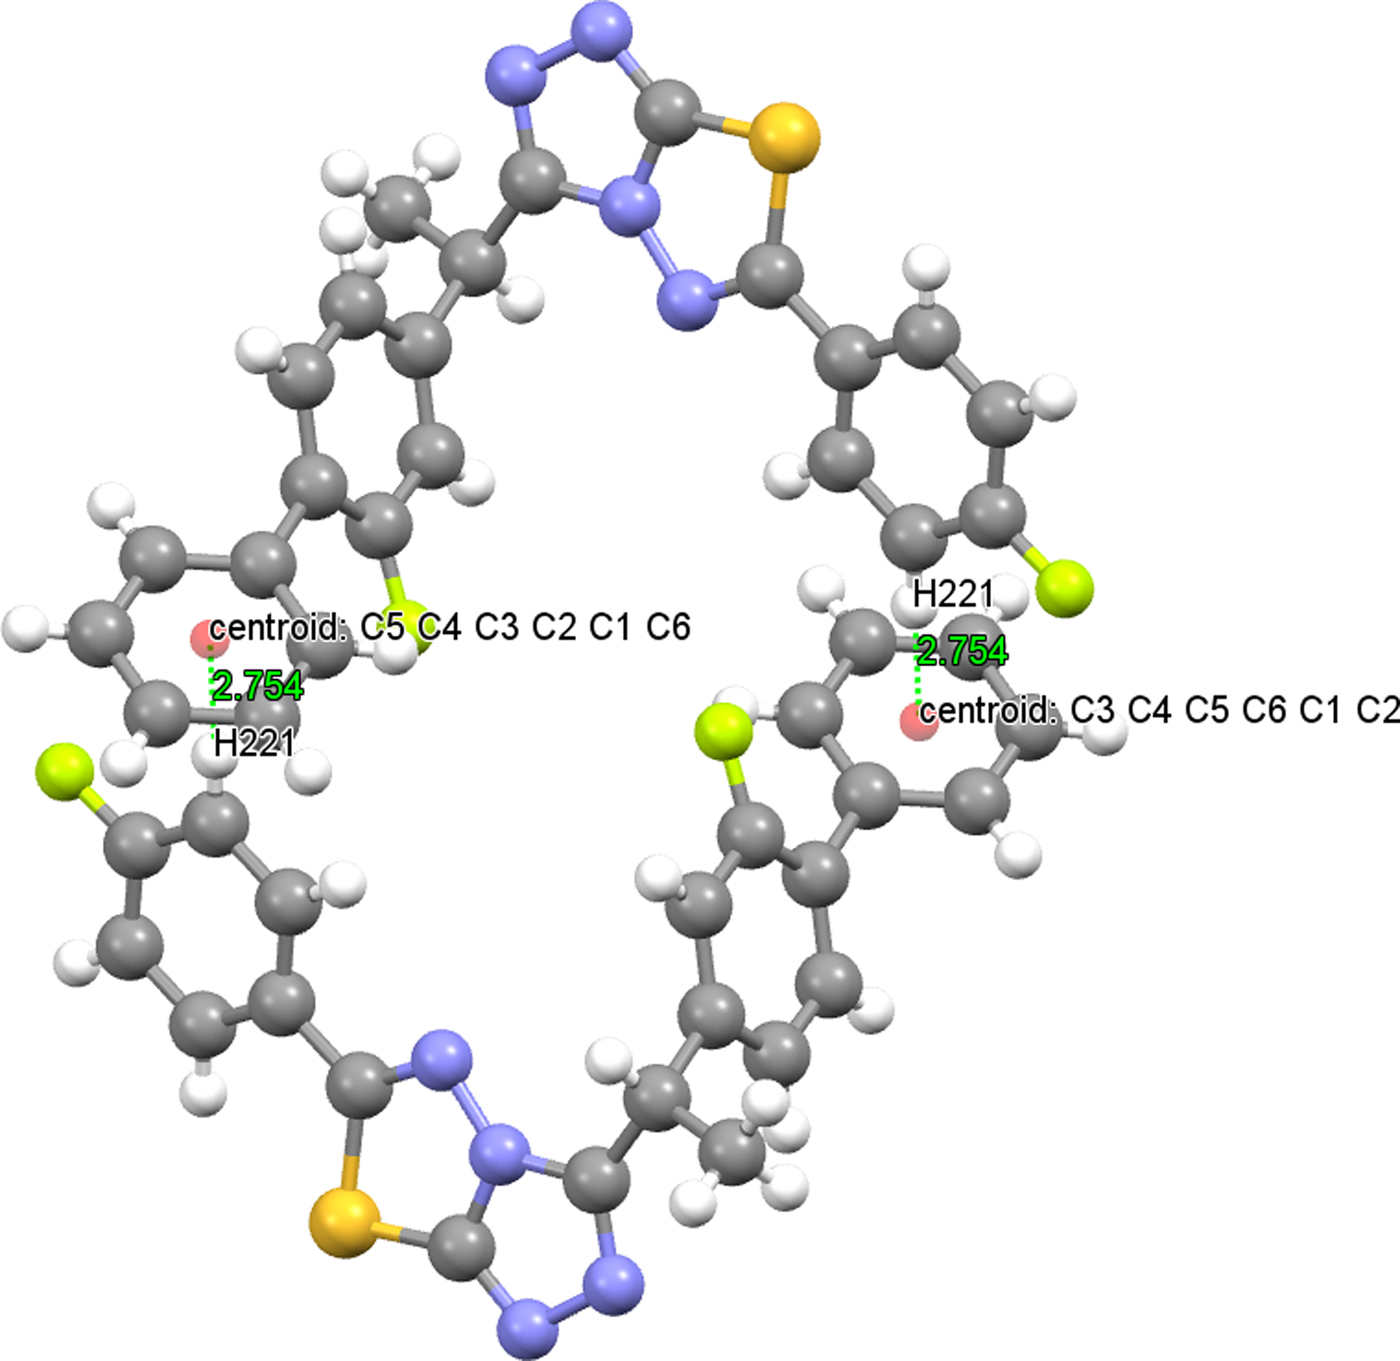
Figure 8. (Colour online) C(22)−H(221)⋯Cg(C1−C6) interaction of (1).
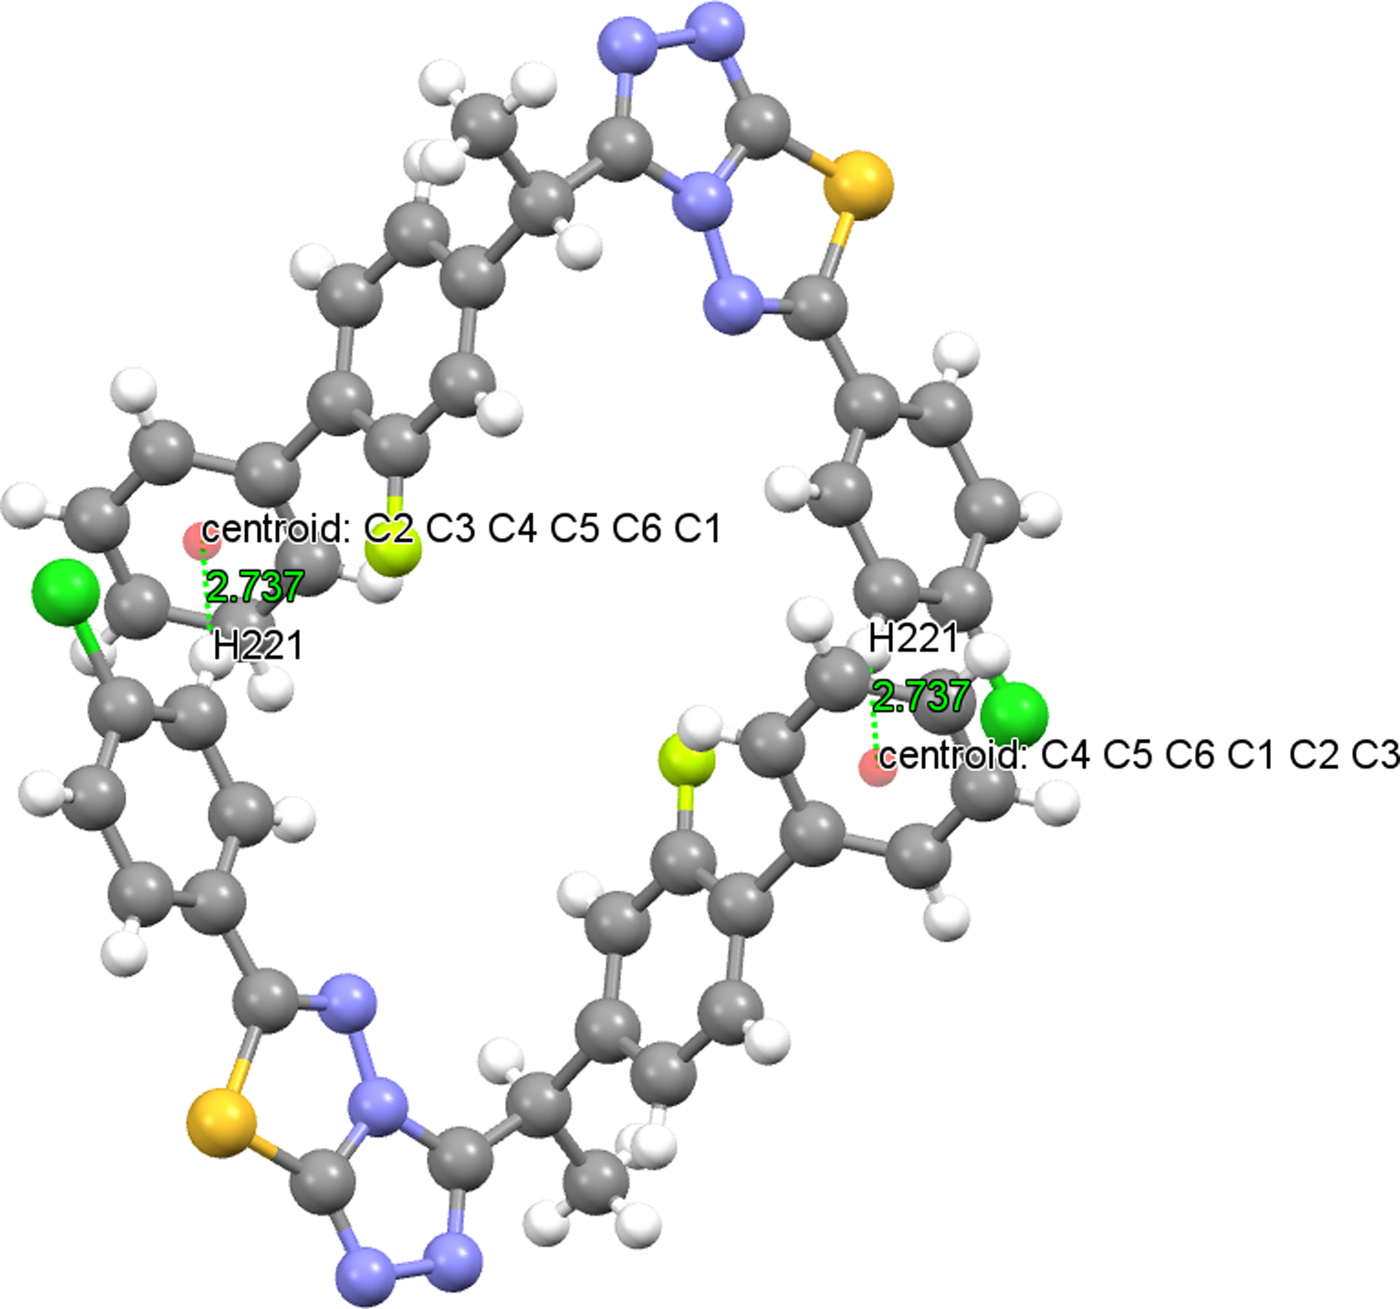
Figure 9. (Colour online) C(22)−H(221)⋯Cg(C1−C6) interaction of (2).
The first short intermolecular contact of containing triazolothiadiazole ring was reported in 2015 by Khan et al., as 2.795(2) Å for S⋯N (Khan et al., Reference Khan, Bakht, Ibrar, Abbas, Hameed, White, Rana, Zaib, Shahid and Iqbal2015), which is shorter than the van der Waals radii sum of nitrogen and sulfur atoms. In this study, the short intermolecular contact is also found in (1) (between the symmetry codes: x, y, z and 1−x, 2−y, 1−z) S1⋯N2 with 2.831 Å and also in (2) (between the symmetry codes: x, y, z and 1−x, 1−y, 1−z) S1⋯N2 with 2.851 Å. Except this short intermolecular contacts, C⋯N and N⋯N contacts are also observed in both structures (Table VI).
Table VI. Short contacts (Å) of (1) and (2).

Symmetry codes: For (1): (i) x, y, z; (ii) 1−x, 2−y, 1−z; For (2): (i) x, y, z; (ii) 1−x, 1−y, 1−z.
IV. CONCLUSION
The crystal structure solutions obtained from synchrotron PXRD showed that both compounds crystallize in the same space group and have closely related structures. As given in experimental part, the IR and 1H-NMR findings of both compounds are very similar. Both analytical and spectral data of the two compounds were in full agreement with the proposed structures by the PXRD analysis. The results of this study support the idea that the structure of both the compounds is isostructural.
SUPPLEMENTARY MATERIAL
The supplementary material for this article can be found at https://doi.org/10.1017/S0885715617001105.
NOTE
This article is a part of the PhD thesis of Gülsüm Gündoğdu.
ACKNOWLEDGEMENTS
Financial support to Gülsüm Gündoğdu from The Scientific and Technological Research Council of Turkey (TÜBİTAK) is gratefully acknowledged (2214-A 1-year international research grant during PhD). She is indebted to Professor Hermann Gies, head of the Ruhr University Bochum, Institute for Geology, Mineralogy and Geophysics, Department of Crystallography, Work Group for Crystal Chemistry, for hosting her in his group during the period of 1 year. She is also grateful to Dr. Bernd Marler, member of the staff working team Gies, for his help in collecting the Laboratory powder XRD data. Use of the Advanced Photon Source at the Argonne National Laboratory was supported by the US Department of Energy, Office of Science, Office of Basic Energy Sciences, under Contract No. DE-AC02-06CH11357.


