


1. INTRODUCTION
Interaction of ultra intense, femtosecond laser pulses with gases in which a significant amount of molecular clusters is present allows one to obtain plasma with unique properties in terms of both matter density and ion charge states. In fact, while in cluster media, the electron density locally exceeds the critical density at a given wavelength, the average density is sufficiently low to make the medium transparent to laser light. Thus, with present-day ultra short, intense laser pulses, plasmas with localized regions characterized by an electron density of the order of the solid density can be easily created (Batani et al., Reference Batani, Dezulian, Redaelli, Benocci, Stabile, Canova, Desai, Lucchini, Krousky, Masek, Pfeifer, Skala, Dudzak, Rus, Ullschmied, Malka, Faure, Koenig, Limpouch, Nazarov, Pepler, Nagai, Norimatsu and Nishimura2007; Nickles et al., Reference Nickles, Ter-Avetisyan, Schnuerer, Sokollik, Sandner, Schreiber, Hilscher, Jahnke, Andreev and Tikhonchuk2007). Moreover, due to the high overall medium transparency, more efficient and uniform absorption of the laser pulse energy takes place if compared with that occurring in gases or solid slabs (Kanapathipillai, Reference Kanapathipillai2006). Consequently, the degree of ionization of the ions created in laser-cluster interactions can be much higher than that achievable employing other kinds of targets. Experiments performed in the past decade, show that cluster-originated plasmas are a source of both high energy ions and electrons (McPherson et al., Reference McPherson, Luk, Thompson, Borisov, Shiryaev, Chen, Boyer and Rhodes1994; Ditmire et al., Reference Ditmire, Donnelly, Rubenchik, Falcone and Perry1996, Reference Ditmire, Zweiback, Yanovsky, Cowan, Hays and Wharton1999; Parra et al., Reference Parra, Alexeev, Fan, Kim, McNaught and Milchberg2000; Abdallah et al., Reference Abdallah, Csanak, Fukuda, Akahane, Aoyama, Inoue, Ueda and Yamakawa2003; Sherrill et al., Reference Sherrill, Abdallah, Csanak, Dodd, Fukuda, Akahane, Aoyama, Inoue, Ueda, Yamakawa, Faenov, Magunov, Pikuz and Skobelev2006; Kim et al., Reference Kim, Kumarappan, Milchberg, Faenov, Magunov, Pikuz and Skobelev2006; Fukuda et al., Reference Fukuda, Akahane, Aoyama, Hayashi, Homma, Inoue, Kando, Kanazawa, Kiriyama, Kondo, Kotaki, Masuda, Mori, Yamazaki, Yamakawa, Echkina, Inovenkov, Koga and Bulanov2007) and of X-ray radiation (Abdallah et al., Reference Abdallah, Csanak, Fukuda, Akahane, Aoyama, Inoue, Ueda and Yamakawa2003; Sherrill et al., Reference Sherrill, Abdallah, Csanak, Dodd, Fukuda, Akahane, Aoyama, Inoue, Ueda, Yamakawa, Faenov, Magunov, Pikuz and Skobelev2006; Mori et al., Reference Mori, Shiraishi, Takahashi, Suzuki, Sharma, Miura and Kondo2001; Smirnov et al., Reference Smirnov, Skobelev, Faenov, Magunov, Pikuz, Fukuda, Yamakawa, Akahane, Aoyama, Inoue and Ueda2004; Faenov, Reference Faenov, Magunov, Pikuz, Skobelev, Gasilov, Stagira, Calegari, Nisoli, De Silvestri, Poletto, Villoresi and Andreev2007). However, in order to control the characteristics of particles and radiation originating during the laser-cluster interaction, it is essential to understand the properties of the cluster plasma itself, which vary strongly on a very short—typically a few ps—timescale.
The temporal evolution of laser-generated cluster plasma (Smirnov et al., Reference Smirnov, Skobelev, Faenov, Magunov, Pikuz, Fukuda, Yamakawa, Akahane, Aoyama, Inoue and Ueda2004; Fukuda et al., Reference Fukuda, Kishimoto, Masaki and Yamakawa2004a) can be roughly divided into three stages (see Fig. 1). At the very beginning of the interaction, the laser pulse ionizes the medium (through field-ionization) leading to the formation of a plasma column (with length and diameter approximately given by the beam Rayleigh length and waist), whose density, in the regions where clusters are present, is slightly less than the solid density (Abdallah et al., Reference Abdallah, Csanak, Fukuda, Akahane, Aoyama, Inoue, Ueda and Yamakawa2003; Sherrill et al., Reference Sherrill, Abdallah, Csanak, Dodd, Fukuda, Akahane, Aoyama, Inoue, Ueda, Yamakawa, Faenov, Magunov, Pikuz and Skobelev2006; Junkel-Vives et al., Reference Junkel-Vives, Abdallah, Auguste, D'Oliveira, Hulin, Monot, Dobosz, Faenov, Magunov, Pikuz, Skobelev, Boldarev and Gasilov2002a; Fukuda et al., Reference Fukuda, Yamakawa, Akahane, Aoyama, Inoue, Ueda, Abdallah, Csanak, Faenov, Magunov, Pikuz, Skobelev, Boldarev and Gasilov2003, Reference Fukuda, Akahane, Aoyama, Inoue, Ueda, Kishimoto, Yamakawa, Csanak, Faenov, Magunov, Pikuz, Skobelev, Abdallah, Csanak, Boldarev and Gasilov2004a; Reference Fukuda, Kishimoto, Masaki and Yamakawa2004b). The duration of this stage depends on both the pulse duration and the average cluster size, and typically varies from tens to hundreds of fs. After this stage, the dense plasma regions begin to expand. In this process, the energy absorbed by the electrons during the interaction with the laser pulse is converted into both radiation and ion kinetic energy. Only if the laser pulse duration is small enough, the expansion can be considered as “adiabatic.” At this stage, clusters progressively reduce their mass and density, while in the laser interaction region the plasma becomes more and more homogeneous. The duration of this second stage typically varies from several tens up to several hundreds of ps. In the third, adiabatic stage, which typically lasts several ns, the decay of the quasi-homogeneous plasma column occurs.

Fig. 1. The simplified scheme of the cluster plasma temporal evolution.
It is well-known that the parameters of the plasma formed in the first stage strongly depend (Abdallah et al., Reference Abdallah, Faenov, Skobelev, Faenov, Skobelev, Magunov and Pikuz2001, Reference Abdallah, Csanak, Fukuda, Akahane, Aoyama, Inoue, Ueda and Yamakawa2003, Reference Abdallah, Batani, Desai, Lucchini, Faenov, Pikuz, Magunov and Narayanan2007; Junkel-Vives et al., Reference Junkel-Vives, Abdallah, Blasco, Dorchies, Caillaud, Bonte, Stenz, Salin, Faenov, Magunov, Pikuz and Skobelev2002a, Fukuda et al., Reference Fukuda, Kishimoto, Masaki and Yamakawa2004b; Magunov et al., Reference Magunov, Faenov, Skobelev, Pikuz, Dobosz, Schmidt, Perdrix, Meynadier, Gobert, Normand, Stenz, Bagnoud, Blasco, Roche, Salin and Sharkov2003, Giulietti et al., Reference Giulietti, Tomassini, Galimberti, Giulietti, Gizzi, Köster, Labate, Ceccotti, D'Oliveira, Auguste, Monot and Martin2006, Reference Giulietti, Galimberti, Gamucci, Giulietti, Gizzi, Koester, Labate, Tomassini, Ceccotti, D'oliveira, Auguste, Monot and Martin2007) on the “contrast” of the laser pulse, namely on the ratio between the main pulse peak power and the power of the “pedestal” (pre-pulse and post-pulse), usually due to amplified spontaneous emission on the nanosecond scale and to residual uncompressed pulse energy (tens of ps). If the energy the electrons absorb from the laser prepulse is sufficiently high, clusters can expand significantly before the arrival of the main pulse. Therefore, high values of the laser contrast are preferred as they allow a “cleaner” interaction to be achieved in which the main pulse irradiates clusters that may have been marginally ionized by the pre-pulse and have not expanded significantly. In such a situation, the main pulse interacts with plasma in which the local electron density can be approximately the solid density. This topic has been widely discussed (Abdallah et al., Reference Abdallah, Csanak, Fukuda, Akahane, Aoyama, Inoue, Ueda and Yamakawa2003; Sherrill et al., Reference Sherrill, Abdallah, Csanak, Dodd, Fukuda, Akahane, Aoyama, Inoue, Ueda, Yamakawa, Faenov, Magunov, Pikuz and Skobelev2006; Junkel-Vives et al., Reference Junkel-Vives, Abdallah, Auguste, D'Oliveira, Hulin, Monot, Dobosz, Faenov, Magunov, Pikuz, Skobelev, Boldarev and Gasilov2002a; Fukuda et al., Reference Fukuda, Yamakawa, Akahane, Aoyama, Inoue, Ueda, Abdallah, Csanak, Faenov, Magunov, Pikuz, Skobelev, Boldarev and Gasilov2003; Skobelev et al., Reference Skobelev, Faenov, Magunov, Pikuz, Boldarev, Gasilov, Abdallah, Junkel-Vives, Auguste, Dobosz, D'Oliveira, Hulin, Monot, Blasco, Dorchies, Caillaud, Bonte, Stenz, Salin, Loboda, Litvinenko, Popova, Baldin and Sharkov2002b), where a contrast on the order of 105–106 and big cluster sizes ~0.1–1.0 µm allowed plasmas with density above 1022 cm−3 to be obtained, and in Faenov et al. (Reference Faenov, Pikuz, Skobelev, Magunov, Efremov, Servol, Quéré, Bougeard, Monot, Martin, Francucci, Petrocelli and Audebert2004), where the effect of the main pulse-to-prepulse contrast was controlled by adopting transparent aerogel nano-targets. Besides the effects related to pre-pulse so far discussed, the properties of cluster plasmas are also strongly influenced by the laser ps post-pulse which, with a present-day high contrast laser system has an intensity in the range of 1012–1014 W/cm2. Therefore, the cluster electrons can be further heated also during their expansion phase, i.e., in the stage when the plasma becomes quasi-homogeneous. The parameters of the plasma created at this stage are strongly influenced by the ratio between the cluster size and their average separation distance (Sherill et al., 2006; Fukuda et al., Reference Fukuda, Kishimoto, Masaki and Yamakawa2004a; Junkel-Vives et al., Reference Junkel-Vives, Abdallah, Blasco, Stenz, Salin, Faenov, Magunov, Pikuz and Skobelev2001; Dorchies et al., Reference Dorchies, Caillaud, Blasco, Bonté, Jouin, Micheau, Pons and Stevefelt2005).
Recently, significant attention has been devoted to the problem of adopting a suitable diagnostics in order to monitor the formation of the dense, high-temperature plasma after the cluster heating. Such a diagnostics has been based in most cases on X-ray spectroscopy methods (see, for example, Abdallah et al., Reference Abdallah, Faenov, Skobelev, Faenov, Skobelev, Magunov and Pikuz2001, Reference Abdallah, Csanak, Fukuda, Akahane, Aoyama, Inoue, Ueda and Yamakawa2003; Sherrill et al., Reference Sherrill, Abdallah, Csanak, Dodd, Fukuda, Akahane, Aoyama, Inoue, Ueda, Yamakawa, Faenov, Magunov, Pikuz and Skobelev2006; Kim et al., Reference Kim, Kumarappan, Milchberg, Faenov, Magunov, Pikuz and Skobelev2006; Mori et al., Reference Mori, Shiraishi, Takahashi, Suzuki, Sharma, Miura and Kondo2001; Smirnov et al., Reference Smirnov, Skobelev, Faenov, Magunov, Pikuz, Fukuda, Yamakawa, Akahane, Aoyama, Inoue and Ueda2004; Fukuda et al., Reference Fukuda, Yamakawa, Akahane, Aoyama, Inoue, Ueda, Abdallah, Csanak, Faenov, Magunov, Pikuz, Skobelev, Boldarev and Gasilov2003, 2004a, Reference Fukuda, Kishimoto, Masaki and Yamakawa2004b; Junkel-Vives et al., Reference Junkel-Vives, Abdallah, Blasco, Stenz, Salin, Faenov, Magunov, Pikuz and Skobelev2001, Reference Junkel-Vives, Abdallah, Auguste, D'Oliveira, Hulin, Monot, Dobosz, Faenov, Magunov, Pikuz, Skobelev, Boldarev and Gasilov2002a, Reference Junkel-Vives, Abdallah, Auguste, D'Oliveira, Hulin, Monot, Dobosz, Faenov, Magunov, Pikuz, Skobelev, Boldarev and Gasilov2002b; Auguste et al., Reference Auguste, D'Oliveira, Hulin, Monot, Abdallah, Faenov, Skobelev, Magunov and Pikuz2000, Magunov et al., Reference Magunov, Pikuz, Skobelev, Faenov, Blasco, Dorchies, Caillaud, Bonte, Salin, Stenz, Loboda, Litvinenko, Popova, Baidin, Junkel-Vives and Abdallah2001, Reference Magunov, Faenov, Skobelev, Pikuz, Biemont, Quinet, Blasco, Bonte, Dorchies, Caillaud, Salin and Stenz2002, Reference Magunov, Faenov, Skobelev, Pikuz, Dobosz, Schmidt, Perdrix, Meynadier, Gobert, Normand, Stenz, Bagnoud, Blasco, Roche, Salin and Sharkov2003; Skobelev et al., Reference Skobelev, Faenov, Magunov, Pikuz, Boldarev, Gasilov, Abdallah, Junkel-Vives, Auguste, Dobosz, Monot, D'Oliveira, Hulin, Blasco, Dorchies, Caillaud, Bonte, Stenz, Salin and Sharkov2002a, Reference Skobelev, Faenov, Magunov, Pikuz, Boldarev, Gasilov, Abdallah, Junkel-Vives, Auguste, Dobosz, D'Oliveira, Hulin, Monot, Blasco, Dorchies, Caillaud, Bonte, Stenz, Salin, Loboda, Litvinenko, Popova, Baldin and Sharkov2002b; Dorchies et al., Reference Dorchies, Caillaud, Blasco, Bonté, Jouin, Micheau, Pons and Stevefelt2005). At the same time, accurate diagnostics of the plasma column formed in the second stage of evolution is also rather important, because such plasma, for example, can serve as an active medium of vacuum-ultraviolet and X-ray lasers, or can be used for channeling fast electron beams (Kim et al., Reference Kim, Kumarappan, Milchberg, Faenov, Magunov, Pikuz and Skobelev2006; Chu et al., Reference Chu, Tsai, Chou, Yang, Lin, Lee, Wang and Chen2005; Willingale et al., Reference Willingale, Mangles, Nilson, Clarke, Dangor, Kaluza, Karsch, Lancaster, Mori, Najmudin, Schreiber, Thomas, Wei and Krushelnick2006; Kumarappan et al., Reference Kumarappan, Kim and Milchberg2005; Fukuda et al., Reference Fukuda, Akahane, Aoyama, Hayashi, Homma, Inoue, Kando, Kanazawa, Kiriyama, Kondo, Kotaki, Masuda, Mori, Yamazaki, Yamakawa, Echkina, Inovenkov, Koga and Bulanov2007). However, adopting the X-ray spectroscopy as a plasma diagnostic technique is a quite complex task as a significant part of the X-ray emission takes place during the first stage of the temporal evolution, i.e., when the cluster plasma itself is formed and most of the electron heating process by the laser beam takes place. Thus, in this case, one would need to measure X-ray spectra with subpicosecond time resolution that, from a technical point of view, is rather difficult.
On the contrary, measuring the Rydberg transitions occurring in clusters with relatively small ionization energies is not so difficult. Due to Stark broadening in the high-density plasma, transitions that occur at the first stage of the evolution give quasi-continuum spectra, which are visible as a background on the spectrograms. Separated, un-broadened X-ray Rydberg line emission only occurs later, when clusters begin to expand, i.e., when the quasi-homogeneous plasma starts its formation. In other words, the Rydberg spectroscopy provides a sort of time-resolved diagnostics.
In the present work, we demonstrate the use of this spectroscopic technique to carry out diagnostics on a CO2-cluster plasma and to investigate how its parameters depend on both laser pulse contrast and cluster size/concentration. We have focused our attention on 1snp - 1s2 with n = 5–9 of He-like ion O VII and 3p-1s of H-like ion O VIII transitions.
Section 2 will depict the experimental features; Section 3 is devoted to the presentation of the experimental data and the theoretical model; in Section 4, we will discuss the physical meaning of our observation.
2. EXPERIMENTAL SETUP AND DIAGNOSTIC TECHNIQUES
The experiment has been performed at the Saclay Laser Interaction Center (SLIC) on the UHI10 laser facility (SLIC/CEA-Saclay), a 10 TW Ti:Sa laser system, 800 nm, delivering linearly polarized laser pulses with energy up to 600 mJ when operating in chirped pulse amplification mode. A sketch of the experiment layout is presented in Figure 2. In the usual laser operating scheme, the ASE pedestal duration is of a few nanoseconds and its energy is about 5% of the total energy, which gives a power contrast around 106 in the nanosecond time scale. We also employed a double plasma mirror device (DPM) (Monot et al., Reference Monot, Doumy, Dobosz, Perdrix, D'Oliveira, Quéré, Réau, Martin, Audebert, Gauthier and Geindre2004; Levy et al., Reference Lévy, Ceccotti, D'Oliveira, Réau, Perdrix, Quéré, Monot, Bougeard, Lagadec, Martin, Geindre and Audebert2007) that leads to a gain of a factor of nearly 104 in the contrast, with a loss of 50% in the energy content of the main pulse. The evolution of the laser power around the main pulse is shown in the autocorrelation plots of Figure 3. Plots labeled with (1) and (2) were obtained without and with DPM, respectively. The contrast that can be evaluated from Figure 3a for several tens of picoseconds is the same we have in the nanosecond time scale. In this time scale, the contrast is increased by the DPM from 106 to 1010 for both pre-pulse and post-pulse. On the picosecond time scale, the contrast, which is typically 104 from –5 to –1 ps (pre-pulse) without DPM, varies with DPM from 108 to 105 in the same range. The post-pulse contrast is not affected by DPM for the first 10 ps after the main pulse.

Fig. 2. Layout of the experiment.
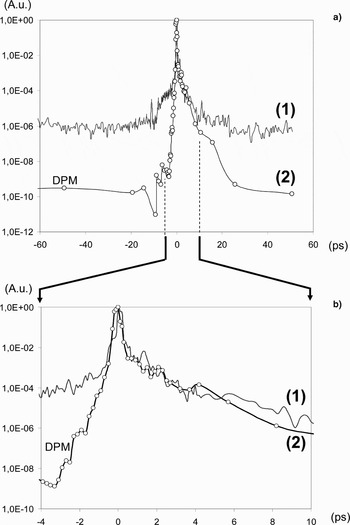
Fig. 3. Plots of the laser power versus time [1] without and [2] with the double plasma mirror. (a) Long time-scale view. (b) Details in the short time-scale.
In the experiment described here, the laser beam was focused with an F/2.5 off-axis parabolic mirror (F = 300 mm) onto a pulsed gas jet of CO2. The width at half-maximum focal spot radius measured in vacuum was about 10 µm. The laser intensity in the spot was about 4 × 10¹⁸ W/cm2 when using DPM, twice smaller that the maximum intensity at lower contrast, without DPM. The CO2 clusters were produced by expanding a high-pressure gas jet into vacuum via a specially designed, pulsed supersonic conical nozzle with the input and output diameters of 0.5 and 2.0 mm, respectively, and a length of 75 mm. The nozzle shape and dimensions have been optimized with the help of numerical simulations (Fukuda et al., Reference Fukuda, Yamakawa, Akahane, Aoyama, Inoue, Ueda, Abdallah, Csanak, Faenov, Magunov, Pikuz, Skobelev, Boldarev and Gasilov2003; Boldarev et al., Reference Boldarev, Gasilov and Faenov2004; Boldarev et al., Reference Boldarev, Gasilov, Faenov, Fukuda and Yamakawa2006). The laser beam was focused at a distance of about 1.2 mm from the edge of the nozzle. Experiments were carried out for CO2 gas-jet backing pressures from 20 to 40 bar, thus producing clusters of different parameters (see Fig. 4 and Table 1).

Fig. 4. Plots of the cluster parameters.
Table 1. Parameters of cluster targets and a laser pulse

The spatially resolved X-ray spectra have been obtained by adopting a focusing spectrometer with spatial resolution-1D (FSSR-1D) (Fukuda et al., Reference Fukuda, Kishimoto, Masaki and Yamakawa2004b; Magunov et al., Reference Magunov, Faenov, Skobelev, Pikuz, Dobosz, Schmidt, Perdrix, Meynadier, Gobert, Normand, Stenz, Bagnoud, Blasco, Roche, Salin and Sharkov2003, Blasco et al., Reference Blasco, Stenz, Salin, Faenov, Magunov, Pikuz and Skobelev2001). In such a scheme, experimental data are acquired by placing the detector on the Rowland circle of a spherically bent crystal. The spectral resolution of the spectrometer does not depend on the size of the plasma source. This spectrometer was equipped with a spherically bent mica crystal (R = 150 mm) and a vacuum compatible X-ray charge coupled device (CCD) camera (DX440-BN, Andor, ME) with a pixel size of 13.5 µm. The spherically bent crystal was placed at a distance of 350.9 mm from the plasma source and was centered at λc = 1.637 nm, which corresponds to a Bragg angle of θ = 55.3° for the first-order reflection of the crystal. Such an alignment of the spectrometer allowed to cover the spectral range λmin ÷ λmax = (1.58 ÷ 1.75) nm and to reach a spectral resolution up to λ/Δλ ~ 5000. In this condition, we had a spatial resolution of δx = 40 µm in the direction along the laser beam propagation. The measured size of the H- and He-like oxygen line emission-zones in the laser-beam propagation direction was between 0.5–2 mm, depending on the experimental conditions. In order to protect the X-ray CCD detector from visible and vacuum-ultraviolet radiation, its sensitive zone has been covered with two layers of 1 µm thick polypropylene filters coated on both sides by 0.2 µm of Al. Moreover, a magnet was placed between the plasma source and the crystal in order to stop high-energy particles.
A typical spectrogram obtained with our focusing spectrometer is shown in Figure 5. Notice that the FSSR spectrometer (high luminosity, high spectral and spatial resolution) allowed clear resolutions of Rydberg lines of He-like Oxygen up to n = 10 → n' = 1 transitions to be obtained, despite their very low intensities.

Fig. 5. (Color online) A typical space-resolved X-ray spectrogram of the CO2 plasma emission in the wavelength region 1.58–1.75 nm, showing Rydberg lines of the He-like oxygen, involving transitions from n = 5 to n = 9 upper states.
The electron plasma density was measured with a Mach-Zehnder interferometer in a similar setup as used in previous recent experiments (Gizzi et al., Reference Gizzi, Galimberti, Giulietti, Giulietti, Köster, Labate, Tomassini, Martin, Ceccotti, D'Oliveira and Monot2006). A fraction of the main femtosecond pulse was frequency doubled and used as an optical probe perpendicular to both the main pulse propagation axis and the gas flow axis. The frequency doubling was obtained with a KDP-Type-I, 2-mm-thick crystal: the duration of the probe pulse after duplication was calculated to be <120 fs. The probe pulse diameter was 4 mm and was timed with respect to the main pulse by means of an optical delay line. Two lenses with focal lengths of 30 and 50 cm (not showed in the figures) were used for the magnification, giving a spatial calibration of about 4.1 µm = 1 pixel on our interferometer CCD detector. An interference filter centered at the 2ωL wavelength was placed in front of the CCD to avoid noise on interferograms due to both scattered ωL light and the plasma broadband optical self emission. However, in some cases, the 2ωL plasma emission due to coherent second harmonic generation (Gizzi et al., Reference Gizzi, Giulietti, Giulietti, Afshar-Rad, Biancalana, Chessa, Schifano, Viana and Willi1994) was so high to prevent the analysis of the interferogram.
3. EXPERIMENTAL DATA AND THEORETICAL MODELING
3.1. Interferometric Data
Interferograms were taken in a range of times of interest for a comparison with both the Rydberg states X-ray spectra and theoretical evaluations (a few tens of picosecond after the entrance of the main pulse in the gas jet). Figure 6 shows a typical interferogram obtained in our experiment. Since the whole plasma is much larger than the high intensity-laser interaction region, it was not possible to follow by interferometry spatial and temporal details of the plasma evolution. The electron density distribution has been obtained by extracting the phase-difference map with a continuous wavelet transform ridge extraction code (IACRE) (Gizzi et al., Reference Gizzi, Giulietti, Giulietti, Afshar-Rad, Biancalana, Chessa, Schifano, Viana and Willi1994) is a well established, robust technique alternative to the fast Fourier transform technique. The phase-difference map was then processed with a generalized Abel inversion algorithm (Tomassini & Giulietti, Reference Tomassini, Giulietti, Gizzi, Galimberti, Giulietti, Borghesi and Willi2001), in which the usual axial symmetry requirement is partially relaxed by means of a truncated Legendre polynomial expansion in the azimuthal angle. This inversion algorithm can deal with moderately non-axisymmetric phase-shift maps. In particular, the interferogram of Figure 6 was obtained using a 2 mm nozzle with CO2 at 20 bar with the laser focused at the entrance edge of the supersonic gas jet (coming from the right in the picture). The laser was operating with DPM (at higher contrast level). Figure 7 shows the longitudinal electron density profiles along the plasma axis, as obtained from the interferogram shown in Figure 6. The peak value and the longitudinal profile of the electron density will be compared with both the values supplied from the X-ray spectra and the model in the same conditions.

Fig. 6. (Color online) (a) Interferogram of the plasma produced by the high contrast laser pulse in the CO2 gas jet at backing pressure of 20 bar. (b) Electron density map of the same plasma.

Fig. 7. Electron density lineout along the axis of the same plasma as in Figure 5.
3.2. X-ray Spectra
A typical space resolved X-ray spectrum showing contribution of both H-like and He-like oxygen, including in the last case emission from high-n excited states, has been already shown in Figure 5. Similar spectra were obtained in each of the four experimental conditions listed in Table 1. In the cases 1–3 in Table 1, the contrast is always the highest, while the cluster concentration decreases (the cluster size increases) from one to three. Case 4 corresponds to shots without the DPM, thus with a low laser contrast ratio. Figure 8 shows the X-ray spectra integrated over the spatial resolution axis of Figure 5.

Fig. 8. Emission spectra of plasma of CO2-clusters, containing line Lyβ of H-like O VIII ion and lines 1snp 1P1−1s21S0 (n ≥ 5) of He-like O VII. Black curves are spectra observed in the experiments 1–4 (see Table 1). Red curves show results of calculations in Eq. (1) with the plasma parameters presented Table 2.
Spectra from (a) to (d) correspond to the conditions 1 to 4 in Table 1, respectively. According to these plots, the relative contribution of the He-like oxygen to the X-ray emission in the range 1.5–1.8 nm increases with decreasing cluster concentration (increasing cluster size) and even with reducing laser contrast. In the latter case, lines from transitions coming from Rydberg states up to n = 9 can be clearly identified.
3.3. The Model
The intensity of each line, Lyβ, Heδ etc., emitted by optically thin plasma can be calculated with the following relation

where C is a normalization constant, A j and λj are the radiative transition rate and the wavelength of the line j, respectively, while N j is the upper level population density. The parameter b defines the fraction of fast ions with effective temperature T f, which radiate in the far line wings of the width Δλw, j = λj(2T f/m i)1/2/c (here m i is the ion mass and c is the speed of light). S j(λ) is the spectral function of the central part of the line j, which is calculated by taking into account the Stark and Doppler broadening
where W(F) is the distribution function of the ion microfield strength F, γj,α(F) = Aj,α(F)/A j and λj,α(F) are the transition branching ratio and the wavelength for the Stark component α of the line j, respectively, while Δλj = λj(2T i/m i)1/2/c is the Doppler line width for the thermal bulk ions with the temperature T i. When the electron density is lower than the critical density the contribution of the electron collisions to line broadening is small.
The relative intensities of the experimentally observed lines were modeled with the help of relation (2), while the level population densities in (1) were calculated in the stationary, collisional-radiative model using the kinetic code (Magunov et al., Reference Magunov, Faenov, Skobelev, Pikuz, Dobosz, Schmidt, Perdrix, Meynadier, Gobert, Normand, Stenz, Bagnoud, Blasco, Roche, Salin and Sharkov2003) for a given set of values for N e, T e, and T i parameters. The linear Stark approximation is used with the micro-field distribution function accounting for both the Debye screening and for the ion correlations. Far wings of the lines are approximated by the exponential terms in (1) varying the fast ions effective temperature T f and the values of the weight b. Note that (1) is valid for an optically thin plasma. In order to account for the absorption of the Lyβ line, we used the uniform slab approximation
where ηj is the optical depth at the line center. The parameters of both the clusters and the laser pulse, which have been adopted in experiments, are shown in Table 1, while the corresponding values of the plasma parameters, which have been obtained experimentally, are presented in Table 2. In Figure 8, the results of the above explained model of the plasma emission spectra in the region 1.58–1.76 nm, which contains both the line Lyβ of H-like O VIII ion and the lines 1snp - 1s2 (n ≥ 5) of He-like O VII, are presented (dashed line).
Table 2. The parameters of plasma measured with the help of the spectra of the Rydberg transitions in He-like O VII ion and line Lyβ of H-like O VIII ion

4. DISCUSSION
The model described above applied to our experimental spectra allowed us to study the stage of the plasma evolution, which gives the greatest contribution to the observed spectra. For the sake of the following discussion, Table 1 shows some parameters describing the cluster populations calculated in the four cases considered (Boldarev et al., Reference Boldarev, Gasilov, Faenov, Fukuda and Yamakawa2006). Table 2 shows instead some plasma parameters as retrieved by the experimental data in each of the four cases. We observe here as an example that the electron density of the main emitting region evaluated for the case 3—high contrast, 20 bar of CO2—is confirmed by the interferometric measurement (peak value) to be 6 × 1019 cm−3. Also, assuming that the intensity profile along the spatial resolution axis of the Heδ line, as shown in Figure 5, is proportional to the density of emitters (which is related to the electron density), the corresponding electron density in a qualitative agreement with the longitudinal electron density distribution shown in Figure 7.
As a first step in our analysis, we can estimate the time needed for the plasma column to become nearly homogeneous. Indeed, from the measured width of the spectral line profiles (due to Doppler effect), we can evaluate the average velocity of cluster expansion to be about v 0 ~ 2 × 107 cm/s. Hence, by taking the distance between clusters to be about d cl ~ N cl−1/3, we find a distance ranging from 4 µm to 17 µm. We can then estimate the time “t h” (see Table 2) after which the plasma column density becomes almost uniform, which is roughly given by t h = d cl/(2v 0) that, with the above range of distances, gives a time ranging between 10 ps and 42 ps. The electron density N e,h at this time can be estimated by assuming that C VI, and O VII are the main components present in this nearly uniform plasma column. These results of estimation N n/N H/N He for Oxygen ions are shown in Table 2. On the other hand, from the experimental spectra, it is also possible to retrieve, with some assumptions, the time to which these spectra refer. More in detail, given the electron density of the emitting region (as provided by our model of the X-ray spectra), which is shown in Table 2, this time can be calculated by
which simply states the conservation of the number of free electrons during the cluster expansion. No change in the average ionization state of the clusters during this expansion is accounted for here. In Eq. (4), N e(t) is the electron density in the cluster volume at time t, r(t) = r(0) + v 0*t the cluster radius. N e(0) and r(0) are the electron density and the cluster radius at the time t = 0 (both these values can be obtained from Table 1). By solving Eq. (4) for t, if N e(t) is the measured density (see Table 3), we find that in the case of high laser contrast, the plasma emission measured for a relatively low cluster concentration of N cl = 2 × 108 cm−3 (see Table 2, experiment 3) almost completely takes place before t = 40 ps, which is less than the calculated value expected for quasi-homogeneous plasma column formation, which in this case is given by t h = 42 ps. Then, as showed in Table 2 with high laser contrast and in the case of high clusters concentration, plasma emission occurs within a time comparable to or larger than that of the column formation (see Table 2, cases 1 and 2), but with lower cluster concentration (see Table 2, experiment 3), the emission occurs just before the formation of the column. For low laser contrast (see Table 2, experiment 4), the plasma emission occurs after column formation for even lower cluster concentration.
We emphasize here that the degree of non-adiabaticity of clusters expansion is (also) related to the distance between clusters and increases with the increasing cluster concentration. As shown in Table 2, in the high contrast setup conditions, in case 1 of higher cluster concentration, i.e., N cl = 1.7 × 1010 cm−3, the electron plasma density measured experimentally N e and the value of N e,h are in good agreement, their ratio being 1.2. In contrast, for lower cluster concentrations such as N cl = 2 × 109 cm−3 and N cl = 2 × 108 cm−3 the difference between N e and N e,h increases, as their ratio becomes 1.5 and 2.4, respectively. Such results mean that at high cluster concentration (i.e., at small distance between clusters) Rydberg line emission mostly occurs when quasi-homogeneous plasma column formation has been completed. As the distance between clusters increases, the time of the emission moves backward, when clusters still exist and the final homogenization of the plasma column has not yet taken place. In terms of degree of non-adiabaticy: in the case of high laser contrast ratio and high cluster concentration, the measured plasma density (see Table 2) indicates that most of the emission occurs during the cluster expansion with a high degree of non-adiabaticy; for lower cluster concentration most of the emission comes from clusters basically expanding still adiabatically. The latter circumstances are not possible in the case of low laser contrast ratio, here, as explained above, even for lower cluster concentration, the cluster expansion occurs at a high degree of non-adiabaticity.
A particular feature, in the case of high laser contrast, is that the electron temperature, which is measured during the maximum of plasma emission, can still be more than 100 eV. This is likely to be due to the fact that the cluster expansion, which occurs in this stage is non-adiabatic also because the plasma electrons continue to be heated by the post-pulse radiation (see Fig. 3), which typically has a duration of 15–20 ps and can reach a peak intensity of the order of 1012–1014 W/cm2. Only when this post-pulse radiation has decreased, i.e., for t > 20 ps, the temperature of plasma electrons begins to decrease, and this is associated to a reduction of the X-ray spectral line intensities. This is confirmed by the behavior of emission in cases 1, 2, 3, showed in Table 2, where as the estimated maximum emission time increases (with decreasing clusters concentration), the measured temperature decreases as a consequence of a fixed post-pulse duration time.
Another particular feature in the case of low contrast laser pulses (see Fig. 3b and Table 2, experiment 4), is that cluster expansion begins well before the arrival of the main laser pulse (at time about −20 ps), while the formation of the plasma column should take place at time t ~ 20 ps after the main pulse, when the post pulse is still operating. For this reason, when adopting low contrast pulses, the formation of the plasma column occurs non-adiabatically even for low cluster concentration (so high maximum emission time), most X-ray emission occurs after the formation of the column itself and, as it is seen from Table 2, in this case, the measured value N e basically coincides with N e,h.
We emphasize here that, as anticipated above, despite the dense high-temperature, plasma formed at the stage of cluster heating radiates a significant amount of X-ray radiation; its spectrum is located almost entirely in the underlying continuum. First, by observing Rydberg spectral transitions and by adopting low Z clusters, we have been able to measure the plasma parameters after the formation of the plasma column. In this case, even at moderate densities such as N e ~ 1021–1022 cm−3, a quasi-continuum spectrum forms due to Stark broadening. Moreover, additional line broadening due to the dense plasma optical thickness is expected, which is also higher for ions with low Z. Second, the contribution to the observed spectrum, which is associated to the initial stage of cluster heating, is proportional to the ratio between the lifetime of the dense heated cluster and that of the plasma column. The presence of a post pulse, which forces the cluster expansion to be non-adiabatic, leads to temperatures of the electrons in the plasma column which are quite high (T e > 100 eV) and allows further excitation of the spectral lines. Therefore, plasma column emission lasts much longer than the stage of cluster heating, leading to an increase of the contribution of the former to the observed spectrum. It is necessary to note that our results are in a good agreement with the data presented in Mori et al. (Reference Mori, Shiraishi, Takahashi, Suzuki, Sharma, Miura and Kondo2001) and Shiraishi et al. (Reference Shiraishi, Mori and Kondo2002), in which the temporal durations of the M-shell spectra of Xe ions have been measured, and have been found to be on the order of 100 ps in duration, while estimations for N spectra of Xe gave even longer duration (more than 1 ns). We also stress that in Mori et al. (Reference Mori, Shiraishi, Takahashi, Suzuki, Sharma, Miura and Kondo2001) and Shiraishi et al. (Reference Shiraishi, Mori and Kondo2002), the electron temperature at late stages of expansion was found to be about 100 eV, which is in a good agreement with our measurements. From Table 2, we observe that, as long as light elements are employed, varying the laser pulse contrast does not lead to dramatic changes in the emission spectra, which correspond to the stage of the plasma column formation. A different situation has been observed earlier and discussed (Abdallah et al., Reference Abdallah, Faenov, Skobelev, Faenov, Skobelev, Magunov and Pikuz2001, Reference Abdallah, Csanak, Fukuda, Akahane, Aoyama, Inoue, Ueda and Yamakawa2003; Sherrill et al., Reference Sherrill, Abdallah, Csanak, Dodd, Fukuda, Akahane, Aoyama, Inoue, Ueda, Yamakawa, Faenov, Magunov, Pikuz and Skobelev2006; Junkel-Vives et al., Reference Junkel-Vives, Abdallah, Blasco, Stenz, Salin, Faenov, Magunov, Pikuz and Skobelev2001, Reference Junkel-Vives, Abdallah, Auguste, D'Oliveira, Hulin, Monot, Dobosz, Faenov, Magunov, Pikuz, Skobelev, Boldarev and Gasilov2002a, Reference Junkel-Vives, Abdallah, Auguste, D'Oliveira, Hulin, Monot, Dobosz, Faenov, Magunov, Pikuz, Skobelev, Boldarev and Gasilov2002b; Fukuda et al., Reference Fukuda, Yamakawa, Akahane, Aoyama, Inoue, Ueda, Abdallah, Csanak, Faenov, Magunov, Pikuz, Skobelev, Boldarev and Gasilov2003, Reference Fukuda, Kishimoto, Masaki and Yamakawa2004b; Auguste et al., Reference Auguste, D'Oliveira, Hulin, Monot, Abdallah, Faenov, Skobelev, Magunov and Pikuz2000, Magunov et al., Reference Magunov, Pikuz, Skobelev, Faenov, Blasco, Dorchies, Caillaud, Bonte, Salin, Stenz, Loboda, Litvinenko, Popova, Baidin, Junkel-Vives and Abdallah2001, Reference Magunov, Faenov, Skobelev, Pikuz, Biemont, Quinet, Blasco, Bonte, Dorchies, Caillaud, Salin and Stenz2002, Reference Magunov, Faenov, Skobelev, Pikuz, Dobosz, Schmidt, Perdrix, Meynadier, Gobert, Normand, Stenz, Bagnoud, Blasco, Roche, Salin and Sharkov2003; Skobelev et al., Reference Skobelev, Faenov, Magunov, Pikuz, Boldarev, Gasilov, Abdallah, Junkel-Vives, Auguste, Dobosz, Monot, D'Oliveira, Hulin, Blasco, Dorchies, Caillaud, Bonte, Stenz, Salin and Sharkov2002a, Reference Skobelev, Faenov, Magunov, Pikuz, Boldarev, Gasilov, Abdallah, Junkel-Vives, Auguste, Dobosz, Monot, D'Oliveira, Hulin, Blasco, Dorchies, Caillaud, Bonte, Stenz, Salin and Sharkov2002b) in the case of a plasma generated by laser-irradiation of Ar clusters. In that case, the ionization potentials of multi-charged Argon ions, i.e., the energy needed to obtain H-, He-, Li-like ions, is much higher and the emission of the corresponding spectral lines was found to take place during the first stage of clusters evolution when the laser contrast played a significant role.
5. CONCLUSIONS
An experiment has been performed in which a clustered CO2 gas jet of variable parameters was irradiated with ultra short powerful laser pulses in two regimes of pulse contrast. The main diagnostic was based on X-ray spatially resolved spectroscopy. This latter was supported by optical interferometric data which, after deconvolution, provided measurements of the plasma density distribution which could be compared with the density measurements retrieved from X-ray data, and were found to be in a good agreement. Our study provides evidence of conditions in which the X-ray emission occurs, even for light ions, when the cluster expansion is in a late, non-adiabatic stage. This was possible thanks to the high luminosity, high resolution, space-resolved spectroscopy performed with the focussing spectrometer with spatial resolution (FSSR) spectrometer, allowing an unprecedented detection of the high-n Rydberg excited levels in the X-ray range of the plasma self-emitted spectrum. The experimental investigation of the stage of cluster expansion, which has been carried out, shows two causes for the non-adiabatic behavior. The first is related to the inter-cluster distance and the second due to the post-pulse irradiation effect. Information regarding the X-ray line emission spectra of light elements due to Rydberg transitions has also been used to determine parameters of the plasma. Comparison of the calculated and measured electronic density of quasi-homogeneous plasma column obtained in our experiment shows that in the case of high laser contrast ratio, it is possible to achieve a low degree of non-adiabaticy in the cluster expansion, but only in the case of a sufficiently low cluster concentration. Our measurements also demonstrate that the same circumstances cannot be attained in the case of low laser contrast ratio, even in the presence of lower cluster concentrations. Our observations demonstrate that, in the case of low Z elements clustered gas-jets irradiated by ultra short, intense laser interaction, X-ray spectroscopy can be successfully employed to unfold the role of a critical laser feature like the contrast ratio in the fast dynamics of cluster expansion.
Acknowledgements
This work was partially supported by grants RFBR 06-02-16174, 06-02-72005-MNTI_a, and the Program of basic researches of Presidium RAS number 9. Access to the CEA facility was granted by the LASERLAB initiative of the sixth Framework Programme of the European Union. The Pisa authors wish to acknowledge support from the Italian MIUR projects FISR “Impianti in multiscopo per la produzione di radiazione X ed ultravioletta,” FIRB “BLISS - Broadband Laser for ICF Strategic Studies,” and “SPARX.” The Pisa group also acknowledges support from the INFN project “PLASMONX - Plasma Acceleration and Monochromatic X-ray generation.”


