


I. Introduction
Water is turning into wine. The same culture that surrounds the production and consumption of wine is emerging around water. Water competitions akin to wine competitions are now held. At one such competition, an award for the world's best bottled water is given based on a blind taste test (Berkeley Springs International Water Tasting, 2015). Many fine dining establishments also now offer a wide selection of bottled waters. One restaurant in Los Angeles, California, even has a 45-page “water menu” with 20 different brands of bottled water selected by a so-called “water sommelier” (Popken, Reference Popken2011; Ray's and Stark Bar, 2015). As another example of the wine-like culture emerging around water, a guidebook to bottled waters written by another water sommelier is now in its second edition (Mascha, Reference Mascha2006, Reference Mascha2013). The two editions of the book combine to cover over 100 different brands of bottled water, and each brand's water is described in terms of various characteristics like its source, carbonation, orientation, minerality, hardness, and virginality.
Water treated like wine is priced accordingly with some bottles of water priced as if they were bottles of fine wine. At the Los Angeles restaurant mentioned above, their bottled waters range from $8 per liter (when buying an $8, 1-liter bottle of the FIJI brand) to $27 per liter (when buying a $20, 750-milliliter [ml.] bottle of the Berg brand). Even outside a restaurant, bottled water can still be expensive. Systematic data on bottled water prices are scarce, but one source of data is the prices charged by websites that specialize in the retail and distribution of bottled waters. One such website, AquaMaestro.com, sells bottled waters that range in price from as little as about $1 per liter (when buying a case of 12 1.5-liter, plastic bottles of the Evian brand, for example) to as much as about $50 per liter (when buying a case of 12 750-ml., glass bottles of the Bling H2O brand).
Given that water is increasingly treated like wine, many of the same questions that wine economists have asked about wine can now be asked about water. Approaches developed to answer questions about wine can also be applied to the analysis of water. In this article, we attempt to explain why some bottled waters are more expensive than others by drawing on the hedonic pricing approach that has been applied many times before to try to explain price differences among bottles of wine (Ashenfelter, Reference Ashenfelter2008; Ginsburgh et al., Reference Ginsburgh, Monzak and Monzak2013; Haeger and Storchmann, Reference Haeger and Storchmann2006; Lecocq and Visser, Reference Lecocq and Visser2006) and that has been applied once before to try to explain price differences among bottles of water (He et al., Reference He, Jordan and Paudel2008). Applying that approach to a set of bottled waters that are featured in the guidebook mentioned above and sold on websites like the one mentioned above, we find that characteristics related to the water inside a bottle explain only a small part of the price differences among bottled waters. Thus, to a large extent, the premium that consumers pay for a more expensive bottled water does not seem to be a premium for the water inside its bottle.
The rest of this article is organized as follows. Section II discusses how previous studies have drawn on the hedonic pricing approach to try to explain price differences among bottles of wine, bottles of water, and many other goods and services. The same section also discusses how this article draws on that approach to try to explain price differences among bottled waters. Section III discusses the results of applying the approach. Section IV concludes by considering why characteristics related to the water inside a bottle seem to explain so little of the price differences among bottled waters. Directions for future research into water are also considered to conclude.
II. Data and Methods
A. The Hedonic Pricing Approach
An approach that has been applied to try to explain price differences among many goods and services, including bottles of wine and water, is the hedonic pricing approach. In that approach, the price that consumers pay for a good or service is decomposed into the implicit prices that consumers would be willing to pay for certain characteristics of the good or service. In terms of the study of price differences among bottles of wine, the approach has typically been applied by running a log-linear regression of the form
 $${\rm Ln}\left( P \right){\rm} = X \beta + \varepsilon $$
where P is a vector of the prices of different bottles of wine, X is a matrix of explanatory variables, β is a vector of parameters associated with those variables, and ε is an error term. In principle, the explanatory variables should be characteristics of a bottle of wine; but, in practice, the variables are often only proxies for such characteristics (Thrane, Reference Thrane2004; Unwin, Reference Unwin1999). That approach to the study of price differences among bottles of wine has identified a variety of variables (e.g., the weather in which grapes for a wine were grown) that appear to explain why some bottles of wine are more expensive than others. The approach has also identified variables that do not appear to explain price differences. The opinions that wine experts offer about a bottle of wine appear to bear little, if any, relationship to the price of the bottle, for example, at least after controlling for other factors (Ashenfelter, Reference Ashenfelter2008; Ginsburgh et al., Reference Ginsburgh, Monzak and Monzak2013; Haeger and Storchmann, Reference Haeger and Storchmann2006; Lecocq and Visser, Reference Lecocq and Visser2006; see also Storchmann, Reference Storchmann2012, pp. 22–27).
In addition to the study of price differences among bottles of wine, the hedonic pricing approach has also been applied to study price differences among bottles of water, but only once before. He, Jordan, and Paudel (Reference He, Jordan and Paudel2008) studied the price differences between 390 bottled waters sold at 10 supermarkets in Atlanta, Georgia.Footnote 1 The prices of the bottled waters ranged from about 15 cents per liter to $2.87 per liter (He et al., p. 338). He, Jordan, and Paudel (Reference He, Jordan and Paudel2008) tried to explain the price differences by regressing the log of the price of a bottled water (in cents per ounce) against a select number of variables. The variables were related to: the brand of a bottled water; the size of a bottle; the number of bottles packaged together; the supermarket in which a bottled water was sold; the country or U.S. state in which the water was bottled; and the source of the water (a spring, an artesian aquifer, etc.). Among their findings, they found that certain brands of bottled water were more expensive than other brands, other things being equal. They speculated that the brand of a bottled water was a proxy for some unspecified characteristics for which consumers are willing to pay (He et al., p. 339). The exact characteristics were unclear, however, because He, Jordan, and Paudel (Reference He, Jordan and Paudel2008) did not have any data on differences among different brands of bottled water.
B. Characteristics of Fine Waters
A useful source of data for trying to identify characteristics for which consumers are willing to pay is a guidebook to bottled waters entitled Fine Waters: A Connoisseur's Guide to the World's Most Distinctive Bottled Waters, which is now in its second edition (Mascha, Reference Mascha2006, Reference Mascha2013). The author of that book is a self-described bottled-water connoisseur who has been recognized for his expertise on water and who has even been called a “water sommelier” (Hooks, Reference Hooks2013; Stein, Reference Stein2007). The two editions of the book combine to cover 154 different brands of bottled water that are, in the words of its author, “fine,” “high end,” “personal favorites,” and some of the world's “best” and “most distinctive” (Mascha, Reference Mascha2006, pp. 8, 21, 68). Some of those brands come in both still and sparkling varieties, so the two editions actually cover 241 different types of bottled water in total between the various brands and their still and sparkling varieties.
For each of those 241 types of bottled water, the Fine Waters book provides details such as the source of the water inside the bottle. Every source of water is unique with its own terroir, according to Mascha (Reference Mascha2006, pp. 7–8, 11), but the general sources of water identified by the book include springs, artesian aquifers, wells, glaciers, icebergs, rainwater, seawater, and the sap from maple trees (Mascha, Reference Mascha2006, pp. 26–30; 2013, p. 70). Consumers may be willing to pay a premium (or they may demand a discount) for water drawn from some of those sources. Mascha (Reference Mascha2006, p. 28) suggests that well water has a negative public perception, for example.
Details about a water's carbonation are also provided by the book. Still water is uncarbonated, of course, but sparkling waters can vary in their level of carbonation. The book categorizes a sparkling water as “effervescent,” “light,” “classic,” or “bold” based on its milligrams of carbon dioxide per liter, where the latter categories correspond to more carbonation (Mascha, Reference Mascha2006, pp. 43–46). A water's level of carbonation apparently affects its mouthfeel (Mascha, Reference Mascha2006, pp. 43–46), so consumers may be willing to pay a premium for certain levels.
The book also provides details about a water's “orientation,” which is based on its pH factor and classified as “acidic,” “neutral,” “hint of sweet,” or “alkaline.” Waters with different pH factors have different tastes ranging from sour to sweet, the book claims, although the book also notes that the differences in taste are subtle because bottled waters do not vary too widely in terms of their pH (Mascha, Reference Mascha2006, pp. 38–39).
The “minerality” of a water has a much more significant effect on its taste than its orientation, according to Mascha (Reference Mascha2006, p. 39). A water's minerality (which should not be confused with a wine's minerality; on that, see Teague Reference Teague2013) is categorized as “super low,” “low,” “medium,” “high,” or “very high” based on its milligrams per liter of total dissolved solids (TDS), where the latter categories correspond to more TDS. The dissolved solids that count toward a water's TDS include “carbonates, bicarbonates, chlorides, sulfates, phosphates, nitrates, calcium, magnesium, sodium, potassium, iron, manganese, and a few other minerals” (Mascha, Reference Mascha2006, pp. 35–37).
Among those dissolved solids, three minerals—calcium, magnesium, and nitrate—seem to be especially important. Calcium and magnesium determine a water's “hardness,” which is classified as “soft,” “slightly hard,” “moderately hard,” “hard,” or “very hard” as the milligrams per liter of those two minerals increase (Mascha, Reference Mascha2006, pp. 37–38).
The other mineral, nitrate, determines a water's “virginality,” which is categorized as “superior,” “very good,” “good,” “acceptable,” or merely “potable” as the milligrams per liter of that mineral increase. Nitrate, which comes from sources such as animal and human waste, is seen as a contaminant because high concentrations can be harmful to humans (Mascha, Reference Mascha2006, pp. 41–42).
The purpose of this article is to explore whether those characteristics related to the water inside a bottle—the source, carbonation, orientation, minerality, hardness, and virginality of the water—can explain price differences among the different bottled waters featured in the Fine Waters book. That can be done by following He, Jordan, and Paudel (Reference He, Jordan and Paudel2008) and running a log-linear regression like the one in equation (1) in which our explanatory variables are dummy variables that correspond to each source of water and each category of the other characteristics.
It can be noted that, for some brands, the Fine Waters book provides a few other details besides those mentioned above. Some waters are drawn from as deep as 3,000 feet below sea level (the Kona Deep brand's water is drawn from that depth under the ocean; Mascha, Reference Mascha2006, p. 115), while others are drawn from as high as 6,350 feet above sea level (the Daggio brand's water is drawn from a mountain spring at that height; Mascha, Reference Mascha2006, p. 86). Some waters are also as old as 16,000 years based on carbon dating (the Trinity brand's water is that old; Mascha, Reference Mascha2006, p. 157), while others are as young as one week old (the Cape Grim, Cloud Juice, Oregon Rain, and Tasmanian Rain brands of rainwater are that young; Mascha, Reference Mascha2006, pp. 79, 83, 132; Reference Mascha2013, p. 136). Those pieces of information are not provided for every (or even most) brands, however, so we ignore them in our analysis.
C. Prices of Fine Waters
In order to run our regression of the log of the prices of different bottled waters against the characteristics of the water inside the bottles, we need information about the prices of the bottled waters and not just information about the characteristics of their water. Unfortunately, while the Fine Waters book provides many details about many different bottled waters, it does not provide any information about their prices. The book's companion website (FineWaters.com) does not provide any information about prices, either, but it does link to websites that specialize in the retail and distribution of bottled waters. Those online retailers are among the few places besides boutique grocery stores where consumers can buy some of the bottled waters featured in the Fine Waters book, as pointed out by Mascha (Reference Mascha2006, pp. 21–22).Footnote 2 Some of the websites are no longer up and running, but three sites—Aqua Amore's (Aqua-Amore.com), Aqua Deli's (AquaDeli.co.nz), and Aqua Maestro's (AquaMaestro.com)—are still operating, so the prices they charge can be taken from their sites.
By looking at the bottled waters sold by those three retailers on a particular day and matching their bottled waters to the ones featured in the Fine Waters book, we constructed a dataset of the prices and associated characteristics of a set of bottled waters. For the day we gathered data, many of the brands of bottled water sold by the retailers are included in at least one edition of the book.Footnote 3 There are also three other brands (Aquadeco, SOH2O, and Vidago) that are sold by the retailers and described in detail by the book's companion website, even though they do not appear in either edition of the book. Instead of ignoring those three brands in our analysis, we include them by using details provided by the book's site. Other brands sold by the retailers are either not on the book's site or not described in the same detail. Including those brands, the three online retailers combine to sell 51 of the different brands of bottled water described in at least one edition of the Fine Waters book (or described in detail on the book's companion website) and 72 of the different types of bottled water after accounting for still and sparking varieties of different brands.
For those 72 types of bottled water, the retailers do not sell them in bottles that are all the same size, made out of the same material, or packaged together in the same quantity. Instead, the bottles range in size from as small as 200 ml. to as large as 2 liters; the bottles are also made out of various materials, including glass, plastic, and aluminum; and the quantities in which they are packaged together range from just 1 bottle by itself to a case with as many as 36 bottles. Those differences can be controlled for in our regression by including dummy variables for each of the sizes, materials, and quantities.
D. Other Complications and Controls
Using data from only one of the three online retailers would severely limit the number of bottled waters in our analysis and thereby cast doubt on the main findings presented below (which are mainly null findings), but using data from more than one of the retailers creates some complications because they operate out of different countries. Aqua Amore, Aqua Deli, and Aqua Maestro operate out of the United Kingdom, New Zealand, and the United States, respectively.Footnote 4 The prices they charge are therefore denominated in different currencies (the British pound, New Zealand dollar, and U.S. dollar, respectively). To try to make their prices comparable, we converted them to U.S. dollars by using exchange rates from the same day we gathered data from the retailers’ websites.
The fact that the retailers operate out of different countries suggests that simply converting their prices to a common currency might not be sufficient to make their prices comparable. The retailers may charge different prices for the same bottled waters due a myriad of factors like taxes and transportation costs. To thoroughly control for such factors, we would need to include dummies for each retailer, dummies for each country in which a bottled water is produced, and interaction terms between those retailer and country-of-origin dummies. We will use retailer and country-of-origin dummies in our regression, but including interaction terms between all those dummies would create severe multicollinearity problems. So, instead of using interaction terms, we will simply use a dummy variable for whether a bottled water sold by a retailer is produced in the retailer's home country or not. That dummy should capture any premium associated with bottled waters that are not produced domestically and must be imported from abroad. The country-of-origin dummies also create multicollinearity problems, but we include them in the full specification of our model for now and discuss those problems later.
A final complication of using data from retailers that operate out of different countries is that they might not be selling to the same consumers. Online shoppers in the U.S. would presumably buy their bottled water from the U.S.-based Aqua Maestro, for example, if only because of shipping and handling fees. If the retailers are not selling to the same consumers, then that is not a problem in and of itself, unless they are selling to consumers who do not have the same or a similar willingness to pay for certain characteristics of a bottled water. For now, we assume that the retailers are selling to consumers with the same tastes, but we explore that assumption below.
E. Summary and Identifying Restrictions
In summary, the dataset we constructed is one in which the unit of observation is the price in U.S. dollars per liter of a bottled water, where the bottle is a certain size, made out of a certain material, packaged together in a certain quantity, produced in a certain country, sold by a certain retailer that may operate out of a different country, and filled with water that has a certain source, carbonation, orientation, minerality, hardness, and virginality. There are a total of 296 such observations, and the prices vary. The cheapest bottled water costs about 50 cents per liter. Aqua Amore sells a case of 6 1.5-liter, plastic bottles of the Cristaline brand of still water for about that price (46 cents per liter). The most expensive bottled water costs about $50 per liter. Aqua Maestro sells a case of 12 750-ml., glass bottles of the Bling H2O brand of still water for about that price ($49 per liter). The prices therefore vary by two orders of magnitude, but they are highly skewed with a mean of about $3.74 per liter.
We attempt to explain those price differences by running a regression like the one in equation (1) in which the dependent variable is the log of the price of a bottled water and the explanatory variables are several sets of dummy variables. The highly skewed nature of the bottled water prices is a reason to use the log of those prices as our dependent variable. Table 1 provides summary statistics and Figure 1 displays a histogram for that dependent variable. The distribution of the logged prices is somewhat left skewed and leptokurtic, yet those log-transformed prices are much closer to a normal distribution than the untransformed ones.
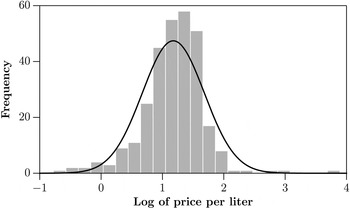
Figure 1 Histogram of Logged Bottled Water Prices
Table 1 Summary of Logged Bottled Water Prices

Note: This table reports statistics on the log of the prices per liter of the bottled waters in our dataset.
Table 2 summarizes the sets of dummy variables that are included as explanatory variables in our regression. To avoid the dummy variable trap, an identifying restriction must be imposed on each set of dummies. We simply drop one dummy from each set (or, formally speaking, we restrict the coefficient associated with one dummy from each set to be zero). When we drop some of the dummies, the basis for comparison becomes a bottled water with the characteristics of the dummies we drop. We drop dummies so that the basis for comparison is a bottle that is 500 ml., packaged together in a case of 12 bottles, made of glass, sold by Aqua Maestro, imported by that retailer, imported from Italy, in particular, and filled with spring water that is still in terms of its carbonation, neutral in terms of its orientation, low in terms of its minerality, very hard in terms of its hardness, and superior in terms of its virginality. That bottle is a somewhat arbitrary basis for comparison, but its characteristics are the most frequent ones in our dataset, so, in the regressions that follow, its estimated price is never too different from the average price of the bottled waters in our dataset.
Table 2 Summary of Explanatory Variables
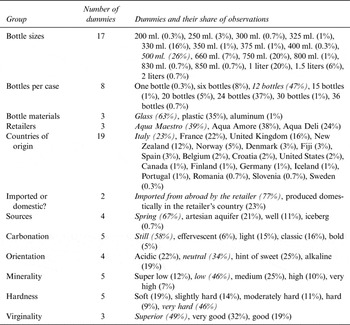
Note: This table summarizes the explanatory variables in the hedonic regression discussed in the text, which are all dummy variables. The percentage of the 296 observations associated with a given variable is reported in parentheses. Groups of variables without a natural ordering are ordered by their percentage of associated observations. The most frequent variable in each group is in italics; those are the variables we drop from our regression for identification purposes. None of the bottled waters in our dataset are merely “acceptable” or “potable” in terms of their virginality.
III. Results and Discussion
A. The Regression with the Country Dummies
Results of the regression discussed above are reported as part of Table 3. The estimated coefficients from the regression should not be interpreted directly because the explanatory variables in our log-linear regression are dummy variables rather than continuous variables (Kennedy, Reference Kennedy1981), but the results reported in the table can be used to estimate the premium (in percentage terms relative to the price of the baseline bottled water) that consumers would pay for a bottled water with a given characteristic. We estimate those price premiums and their standard errors by following the suggestions of Kennedy (Reference Kennedy1981) and Van Garderen and Shah (Reference Van Garderen and Shah2002).Footnote 5
Table 3 Hedonic Regression Results

Note: This table reports, for the hedonic regressions discussed in the text, results of estimating those regressions by ordinary least squares with robust standard errors.
* p < 0.10, ** p < 0.05, *** p < 0.01.
The results of our regression with the country-of-origin dummies should be interpreted with caution, however, because that regression seems to suffer from multicollinearity. The variance inflation factor (VIF) for one of the explanatory variables is as high as about 18 (in the case of the country dummy for New Zealand), and the VIFs for five of the explanatory variables (including the country dummies for the United Kingdom and Norway) are higher than 10. As a rule of thumb, a VIF higher than 10 is seen as a sign of severe multicollinearity.
That multicollinearity is partially due to a strong correlation between the retailer and country dummies. Only Aqua Deli sells bottled waters produced in New Zealand, for example. The multicollinearity is also due to a strong correlation between certain water-related characteristics and the country dummies. The VOSS brand of bottled water is the only bottled water produced in Norway in our dataset, so the characteristics of that brand of bottled water are strongly correlated with the Norway dummy, for example.
As long as our regression is properly specified, multicollinearity should not bias our estimates, and it should only inflate the standard errors. However, our regression with the country dummies suggests some results that would be peculiar if they were true. In particular, a bottled water that was more contaminated with nitrates so that it was only “very good” in terms of its virginality rather than “superior” would be about 32% more expensive per liter (s.e. = 15%, p = 0.03).
Omitting the country-of-origin dummies reduces the degree of multicollinearity. Once omitted, the VIFs for the remaining explanatory variables are all lower than the threshold of 10. We therefore adopt a specification that drops those dummies.
B. The Regression without the Country Dummies
Results of our hedonic regression without the country dummies and the multicollinearity problems they create are reported as another part of Table 3. Price premiums based on that regression are as follows, although at least some of the findings discussed below are qualitatively similar to conclusions that can be drawn from the regression with the country dummies.Footnote 6
Source of water
The regression suggests that, other things being equal, a bottled water would be roughly the same price regardless of whether its water was drawn from a spring, an artesian aquifer, or a well. If its water was drawn from an artesian aquifer rather than a spring, then the bottled water might be about 1% more expensive per liter, while it might be about 12% more expensive per liter if its water was drawn from a well. Those price premiums are not significantly different than zero at conventional levels of statistical significance, however. The price premiums do not seem substantively or economically significant either, given that the most expensive bottled water in our dataset is about 10,000% more expensive than the cheapest one.
Water drawn from an iceberg does seem to be significantly more expensive than water drawn from the other sources. A bottled water is estimated to be about 280% more expensive per liter if its water is drawn from an iceberg rather than a spring (s.e. = 67%; p < 0.01). Yet the extent to which consumers are actually willing to pay a premium for iceberg water is unclear because only one brand of bottled water in our dataset is drawn from that source. The only brand is Berg, whose water is melted off icebergs drifting in the North Atlantic (Mascha, Reference Mascha2013, p. 63). It is therefore unclear whether consumers are willing to pay a premium for that brand because of the source of its water or because of another brand-related characteristic like an attractive bottle.
Price premiums associated with the other water-related characteristics are generally not statistically significant. They are arguably not substantively significant either, given that the largest price premium or discount is only about 28% per liter. That said, a few possible relationships can be noted.
Carbonation
Still water without any carbonation and sparkling water with relatively high levels of carbonation cost roughly the same amount, while “effervescent” water with a low level of carbonation costs more. Consumers are therefore perhaps willing to pay a premium for water with that level of carbonation, although many of the brands of bottled water that are carbonated naturally as opposed to artificially are effervescent, according to Mascha (Reference Mascha2006, p. 44), so consumers may only be willing to pay a premium for naturally carbonated water.
Orientation
The relationship is not monotonic, but waters with the highest pH are the least expensive, while those with a lower pH are more expensive. To the extent that consumers are able to detect the subtle differences in taste due to differences in pH, consumers seem to prefer acidity to alkalinity.
Minerality
Waters that are either “super low” or “very high” in terms of minerality cost more, while waters with intermediate levels of minerality cost less. Extremely low and high levels of minerality may therefore be the ones for which consumers are willing to pay a premium.
Hardness
Waters that are “moderately hard” may tend to cost more, while both softer and harder waters may tend to cost less. Results presented below also suggest that.
Virginality
At least based on the regression without the country dummies if not the regression with the country dummies, waters with lower amounts of nitrate are more expensive. Such a finding is consistent with the notion that nitrate is a contaminant.
Consumers may therefore be willing to pay a premium for certain characteristics related to the water inside a bottle, although the water-related characteristics only explain a small portion of the variation in the (log of the) price of the bottled waters in our dataset. By themselves, they would explain less than a quarter (about 23%) of the variation. After controlling for the other variables, which can explain about 60% of the variation by themselves, adding the water-related characteristics to the regression would only explain about 33% of the remaining variation.
According to an interview that the author of the Fine Waters book gave to a reporter, about 75% of “the fine-water experience” is based on a water's carbonation. Of the remaining 25%, about 20% is based on the water's minerality and 5% is based on its orientation (Stein, Reference Stein2007). While it is not clear what “the fine-water experience” might be, and while those percentages were presumably not meant to be precise, our regression results suggest that water-related characteristics do not explain anywhere near 100% of the price differences among some of the world's finest bottled waters.
C. The Regression with and without Minerality Decomposed
Any multicollinearity between the water-related characteristics would not affect our conclusion about their combined lack of explanatory power. Two or more of the characteristics would simply share a similar relationship to bottled water prices. Multicollineraity could affect our conclusions about the explanatory power of an individual characteristic, however. By inflating our standard errors, it could affect the statistical significance of a price premium. Thus, to further explore the possible effects of multicollinearity, alternative specifications of our hedonic regression can be considered.
Aside from the country-of-origin dummies, variables with a relatively strong correlation in our dataset include those related to a water's minerality, hardness, and virginality. Those correlations would be expected a priori based on the definitions of the variables. A water's hardness depends on its calcium and magnesium, yet a water's minerality also depends on those minerals. Likewise, virginality depends on nitrate, yet minerality also depends on that mineral.
Continuing to omit the country dummies, part of Table 4 reports results of a hedonic regression that includes the minerality dummies but omits the hardness and virginality dummies, while another part of the same table reports results of a regression that omits the minerality dummies but includes the hardness and virginality dummies. Differences among those regression results and our earlier ones could be due to the introduction of a misspecification problem rather than the resolution of a multicollinearity problem, but the results are generally consistent with our earlier ones with a few notable exceptions.

The most notable exceptions relate to a bottled water's source. The price premiums associated with iceberg and artesian water are slightly larger than our earlier estimates, and there is now a discount associated with well water. A discount on well water would be consistent with Mascha's (Reference Mascha2006, p. 28) suggestion that such water suffers from a negative public perception. The premiums and discounts associated with artesian and well water are relatively small, however, at least relative to the premium that iceberg water commands. The fact that the discount on well water disappears when we include the full set of water-related characteristics in our regression may also be consistent with Mascha's (Reference Mascha2006, p. 28) claim that well water's negative public perception is unduly deserved because some can be quite good.
In terms of the other water-related characteristics, the price premium associated with effervescent water is slightly smaller than before, but the results related to a water's carbonation are still consistent with the notion that effervescent water commands a high or the highest premium. The price discounts associated with alkalinity are slightly larger than our earlier estimates, but those results are still consistent with the notion that there are discounts for more alkaline water.
D. Retailer-Specific Regressions
If the three online retailers sell to consumers who do not have the same or a similar willingness to pay for certain characteristics of a bottled water, then the results presented so far could be misleading because those results are based on regressions that use data on the bottled waters sold by all the retailers. Table 5 therefore presents results of three regressions that only use data on the bottled waters sold by Aqua Amore, Aqua Deli, and Aqua Maestro, respectively.
Table 5 Retailer-Specific Regression Results

Note: This table reports, for each retailer, results of regressions that are like the earlier ones but only use data on the bottled waters sold by a given retailer. If a retailer does not sell any bottled waters with a characteristic, then the coefficient associated with the characteristic cannot be estimated, which is denoted by n/a in the table.
* p < 0.10, ** p < 0.05, *** p < 0.01.
For each retailer-specific regression, there is a significant price premium associated with iceberg water, but the premiums associated with the other water-related characteristics are generally neither statistically nor substantively significantly different from zero, which is consistent with our earlier findings.
In addition to not being significantly different than zero, the price premiums estimated from each regression are generally not significantly different from one another. A notable exception is that water with a “high” rather than “low” minerality is estimated to be about 39% more expensive per liter according to the Aqua Deli-specific regression (with a 95% confidence interval of 19% to 59% per liter), but about 25% cheaper according to the Aqua Maestro-specific regression, and about 45% cheaper according to the Aqua Amore-specific regression. Another notable exception is that the Aqua Deli regression implies that water that is “hard” rather than “very hard” would be about 26% cheaper per liter (with a 95% confidence interval of 44% to 9% cheaper), while the Aqua Maestro regression implies that it would be about 56% more expensive (with a 95% confidence interval of 10% to 103% more expensive). Such cases could suggest that the retailers sell to different consumers with different willingnesses to pay for certain characteristics, but those cases are exceptional.
Consistent with our earlier findings, the retailer-specific regressions also suggest that the water-related characteristics do not explain 100% of the price differences among bottled waters. For the regressions reported in the table, the control variables by themselves would explain about 69%, 80%, and 68% of the variation in the (log of the) price of the bottled waters sold by Aqua Amore, Aqua Deli, and Aqua Maestro, respectively. After controlling for those variables, adding the water-related characteristics to the regressions would explain more than half of the remaining variation, but not all of it.
E. Quantile Regressions
The results presented above are all based on estimating our hedonic regression as an ordinary least squares (OLS) regression, but some previous studies on wine have estimated similar hedonic regressions as quantile regressions (Cacchiarelli et al., Reference Cacchiarelli, Carbone, Laureti and Sorrentino2014; Costanigro et al., Reference Costanigro, McCluskey and Goemans2010; Lee and Gartner, Reference Lee and Gartner2015). Unlike an OLS regression, which estimates the conditional mean of a dependent variable, a quantile regression estimates a conditional quantile of the dependent variable such as the 25th, 50th, or 75th quantile. Quantile regressions can therefore be used to explore whether an explanatory variable's effect on a dependent variable varies across the quantiles of the dependent variable (Koenker and Hallock, Reference Koenker and Hallock2001). Our OLS results suggest that water-related characteristics have little or no effect on the price of a bottled water, but, if those characteristics have heterogeneous effects on bottled water prices, then OLS regressions may belie their effects and quantile regressions might reveal them.
Table 6 reports, for select quantiles, results of estimating our hedonic regression as a quantile regression. The results are broadly consistent with our earlier ones. The price premiums associated with iceberg water are statistically significant, substantively significant, and roughly the same at each quantile. For the other water-related characteristics, almost all of their associated price premiums are neither statistically nor substantively significant. At the 25th, 50th, and 75th quantiles, only three, five, and three of the other water-related characteristics have price premiums that are statistically significant at the 5% level. The biggest price premium or discount among those is the one at the 50th quantile associated with effervescent water. At that quantile, effervescent water is estimated to be about 29% more expensive per liter (with a 95% confidence interval of 4% to 54% more expensive).
Table 6 Quantile Regression Results

Note: This table reports, for the 25th, 50th, and 75th quantiles of the conditional distribution of the dependent variable, results of estimating our hedonic regression as a quantile regression with robust standard errors. The pseudo R-squared is Koenker and Macado's (Reference Koenker and Machado1999). See the second regression in Table 3 for comparable OLS results.
* p < 0.10, ** p < 0.05, *** p < 0.01.
Even though most of the price premiums are not significantly different from zero or each other, a noteworthy relationship between the water-related characteristics and bottled water prices is as follows. Like our earlier findings related to a water's orientation, the quantile regression results suggest that, relative to neutral water, there is a price premium associated with more acidic water and a discount associated with more alkaline water. Yet the quantile regression results also suggest that the acidity premium and alkalinity discount both increase as the price of a bottled water increases. More sophisticated consumers (or, at any rate, consumers who pay higher prices for their bottled water) may therefore have stronger preferences for the pH of their water. Whether even the most sophisticated consumer could detect a water's pH during a blind taste test is, of course, another matter.
IV. Conclusion
On a molecular level, water is always the same. It is simply a combination of hydrogen and oxygen atoms. Yet, on the scale in which we live, water is almost always more than just water molecules. Even potable water can contain contaminants like pathogens and pollutants, albeit in amounts that are safe to drink. Water can also contain other additions like certain minerals and gases. Purifying water so that it is nothing more than water molecules would be prohibitively expensive and perhaps impossible. Indeed, it has been suggested that pure water is a myth (Mascha, Reference Mascha2006, pp. 22–23). Thus, water is not always the same.
An open question is whether some types of water are different enough from others for anyone to tell the difference and to be willing to pay a premium for those differences. Consumers are apparently willing to pay a premium for certain bottled waters, but this article found only a weak association between characteristics related to the water inside a bottle and the price that consumers are willing to pay. Other water-related characteristics may have stronger associations, but the characteristics we considered were ones identified by a so-called “water sommelier” in his guidebook to fine waters, so they are presumably the most important ones.
The notion that consumers might be willing to pay a premium for certain types of water is not implausible, however. One direction for future research is to take this study's approach and apply it to a wider selection of bottled waters. Associations that appear weak when comparing a relatively small number of the world's finest bottled waters may be more pronounced when comparing a larger number of bottled waters that vary more dramatically in terms of their characteristics. Although the Fine Waters book only provides information about a limited number of the thousands of brands of bottled water that exist (Mascha, Reference Mascha2006, p. 20), the book's classification scheme could be applied to any bottled water for which information about its water—the source of the water, its carbonation, and the amounts of any organic or inorganic substances in the water—could be collected.
Another direction for future research is to directly study whether consumers are able to tell the difference among different types of water and, if so, whether they prefer some types to others. To that end, water tastings akin to wine tastings could be performed. The extent to which such tastings might reveal information about consumer preferences is unclear. Given that differences among waters are much more subtle than differences among wines (Mascha, Reference Mascha2006, p. 32), and given that even wine experts seem to have difficulty evaluating different types of wine (Storchmann, Reference Storchmann2012, pp. 22–27), it is unclear whether anyone but a water sommelier could distinguish different types of water and pick their personal favorites.
Supplementary Material
For supplementary material accompanying this paper visit http://dx.doi.org/10.1017/jwe.2015.15.


