Introduction
Polar regions in south-east Alaska, Spitsbergen, Greenland and Antarctica have distinct glaciomarine environments in terms of turbid plume sedimentation (Powell Reference Powell1990, Syvitski et al. Reference Syvitski, Andrews and Dowdeswell1996). The Antarctic Peninsula has experienced rapid regional warming and, as a result, glaciers from sub-polar to polar fjords have retreated (Cook et al. Reference Cook, Fox, Vaughan and Ferrigno2005). This area is characterized by valley and tidewater glaciers, which respond quickly to climatic variations. Very little suspended sediment is produced by meltwater streams from the various sources of the glaciers in most Antarctic fjords (Domack & Williams Reference Domack and Williams1990, Domack et al. Reference Domack, Foss, Syvitski and McLennen1994, Yoon et al. Reference Yoon, Park, Domack and Kim1998). Domack et al. (Reference Domack, Foss, Syvitski and McLennen1994) reported the importance of the deposition of non-biogenic particles and transport mechanisms below the surface waters in the ice-proximal zone. The dynamics of ice-proximal plumes are, therefore, key to our understanding of the glaciomarine sedimentation of Antarctic fjords and to building a framework for multidisciplinary research. Sedimentation at the ice-proximal zone is essential not only for understanding modern fjord sedimentation, but also for interpretation of stratigraphic sequences preserved in the rock record (Powell & Molnia Reference Powell and Molnia1989). However, our understanding of these plumes remains poor, in part due to the complexity of glacial meltwater discharge and limited accessibility at the glacial terminus.
To understand glaciomarine hydrodynamics and sedimentation in the ice-proximal zone of Antarctic fjords, Marian Cove, King George Island was chosen (Fig. 1). Marian Cove is affected by temperate to sub-polar atmospheric systems, which are very sensitive to climatic variations. Therefore, the cove is a good site for identifying the variation in sedimentation patterns associated with regional climate fluctuations (Khim et al. Reference Khim, Shim, Yoon, Kang and Jang2007). Furthermore, research at Marian Cove can provide new information for comparison with other polar fjords (Domack & Williams Reference Domack and Williams1990, Domack et al. Reference Domack, Foss, Syvitski and McLennen1994). Extensive time series of conductivity/temperature/depth/transmissivity (CTDT) hydrocasts were obtained in Marian Cove from 1996–2000, by the Korea Antarctic Research Program (KARP). In this paper, the characteristics of turbid meltwater plumes from the tidewater glacier are described and discussed. Then, hydrographic variations in glacier-derived plumes and the forcings (tide, wind, glacier status, etc.) controlling their configuration (Cowan Reference Cowan1992, Brandini & Rebello Reference Brandini and Rebello1994, Klöser et al. Reference Klöser, Ferreyra, Schloss, Mercuri, Laturnus and Curtosi1994) are discussed to explain sedimentation of suspended particulate matter in the cove.

Fig. 1 Location of a. King George Island, b. Maxwell Bay, and c. Marian Cove in the western Antarctic Peninsula. The CTDT measurements in the bay (eight stations) and the cove (stations 1–7) are represented by black squares. AP: Antarctic Peninsula, BS: Bransfield Strait, CH: Collins Harbour, DP: Drake Passage, KGI: King George Island, NI: Nelson Island, PC: Potter Cove.
Environment
Maxwell Bay, at c. 62°S and c. 58°W, is one of two large fjords on King George Island, which is situated on the northern periphery of West Antarctica (Fig. 1). The main inlets of the bay, which opens towards Bransfield Strait, are Potter Cove, Marian Cove and Collins Harbour. Marian Cove (c. 4.5 km long and c. 1.5 km wide) is bounded by the Weaver Peninsula to the north-west and the Barton Peninsula to the south-east. Much of the bedrock of both peninsulas is covered by glacial till. The geology of the Barton and Weaver peninsulas consists of Palaeocene to Eocene volcaniclastic sediments, tuffs and lavas of andesite and basaltic andesite, that were intruded by Eocene granodiorite (Hur et al. Reference Hur, Lee, Hwang and Choe2001). During summer, some volcanic particles are exposed at the surface of the melted glacier or tephra layers are found at the terminus of the glacier. Landscapes modified by periglaciation are widespread.
Marian Cove consists of three basins (outer, central and inner) with a maximum depth of c. 120 m in the ice-proximal zone (Fig. 1). A sub-marine sill (c. 70 m deep) is located at the mouth of the cove where it enters Maxwell Bay. An additional sill, also c. 70 m deep, separates the middle and inner basins. Ice caps are present on King George Island, and glaciers terminate at vertical or near-vertical calving ice cliffs. The coast is typically gravel beach with steeper slopes in the south than in the north. The tidal regime is of mixed-type and semi-diurnal with a distinct inequality in tidal heights (Yoo et al. Reference Yoo, Yoon, Oh, Kim and Kang1999). Mean tidal range is 1.5 m with a maximum spring tidal range of 2.8 m. Water exchange between Maxwell Bay and the cove occurs by tidal forcing over the entrance sill and the inner sill (c. 70 m deep) between the central and inner basins. The cove is ice-free during summer.
Based on meteorological data of King Sejong Station (1988–2007) (KOPRI 2009), mean relative humidity is c. 90% and annual precipitation is c. 600 mm yr-1. The tidewater glacier entering the cove experienced a retreat rate of c. 81 m yr-1 between 1994–2001 (Park et al. Reference Park, Chang, Yoon and Chung1998a), compared with c. 12.5 m yr-1 between 1957–94, possibly as a consequence of recent rapid warming (Park et al. Reference Park, Chang, Yoon and Chung1998a). Sea ice in the cove breaks up prior to the beginning of November. During summer, monthly mean air temperature rises >1.0°C (Fig. 2). Due to relatively high humidity and solar radiation, the snow line rises in elevation through summer. Snow melting and glacier calving at the glacier front begin in early December, introducing large volumes of icebergs and meltwater to the cove (Yoon et al. Reference Yoon, Han, Park, Oh and Chang1997). Meltwater streams with terrigenous particles persist until late March, when the sea ice begins to form again (Yoo et al. Reference Yoo, Kang, Yoon, Suk and Oh2002).

Fig. 2 Typical monthly variation in air temperature (°C), wind speed (m s-1) and precipitation (mm) at King Sejong Station (see Fig. 1 for location). Solid line=mean between 1988 and 2000, and dashed line=mean in 2000.
Methods
The oceanographic data were collected during the summer from 1996–2000 to examine the short-term variations of water characteristics due to hydrographic forcings. The vertical profiles of CTDT measurements at the seven stations in Marian Cove are examined in this paper. All measurements were made while the CTDT underwater unit was descending at a rate of 0.3–0.5 m s-1. On-board measurements (RV Yuzhmorgeologiya) were conducted along a longitudinal transect (stn 3, 5, 6 and 7). In particular, continuous time series measurements at an interval of one hour were obtained from stn 5 in the inner basin, where the water depth is c. 110 m. The CTDT castings from stn 1 to stn 4 of the transverse transect were carried out from a rubber boat.
The CTDT profiles were obtained by a SEABIRD model SBE 911 with a SEATECH transmissometer (660 nm wavelength and 25 cm beam pathlength). Data were collected at 24 samples per second. The output data of light transmittance at 660 nm were values of voltage ranging from 0–5 V, corresponding to 0–100% transmittance. The transmissometer values reflect the suspended sediment load within the water column. All CTDT data were averaged over 1-m intervals for smoothing the plots of salinity, temperature, depth and transmittance, and are considered to be correct to±0.01°C and to ± 0.01 psu.
For the vertical distribution of suspended particulate matter, water samples were collected using a Rosette water sampler containing 12 ea 1 litre Niskin bottles. Three-litre water samples were collected to measure the concentration of suspended particulate matter and to identify its nature. One litre of sampled water was vacuum-filtered through pre-weighed nucleopore filters having a nominal pore size of 0.4 µm. Filters were air dried and re-weighed in the laboratory. Some filtered samples were analysed using a scanning electron microscope (SEM). Total suspended sediment concentration was then calculated using the sample volume and sediment weight (Table I). Ten litre water samples were used for grain size analysis (a laser particle size analyser by Malvern) (Table II). Tide data were obtained from a tide gauge installed adjacent to King Sejong Station and meteorological data (air temperature, wind speed, wind direction, etc.) by an automatic observatory at King Sejong Station (Fig. 1). Values on meteorological profiles are presented as daily and/or 10-minute averages.
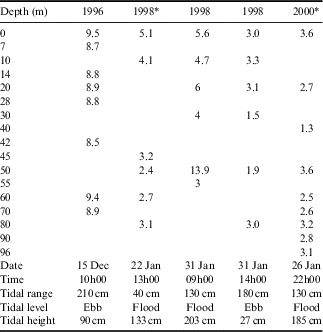
Table I Concentration (mg l-1) of suspended particles in the ice-proximal zone of Marian Cove.

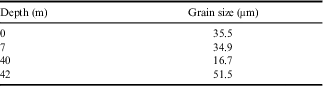
Table II Mean grain diameter (μm) of suspended particles with water depth in the ice-proximal zone of Marian Cove measured in 1998.
Water structure and glacial meltwater discharge
Longitudinal profiles of CTDT data on 3 January 1996 (Fig. 3) and transverse profiles along the glacier cliff in the ice-proximal zone on 7 February 2000 (Fig. 4) were acquired to illustrate general hydrographic structure in the cove. The approximate ranges for temperature, salinity and transmissivity were -0.7–1.5°C, 33.30–34.10 and 2.8–3.9 V, respectively. Density is controlled mainly by salinity, with temperature only playing a small role (Chang et al. Reference Chang, Jun, Park and Eo1990). Near the terminus of the tidewater glacier, four distinct water layers are recognized during summer: i) a surface layer including a turbid and cold meltwater plume, ii) a warm layer having characteristics similar to surface water in Maxwell Bay (Maxwell Bay inflow layer), iii) a turbid and cold mid-depth layer, and iv) a fjord deep water layer comprised of remnant winter water.

Fig. 3 Vertical profiles of temperature (T), salinity (S) and transmissivity (Tr) along the axis of Marian Cove on 3 January 1996.

Fig. 4 Vertical profiles of temperature (T), salinity (S) and transmissivity (Tr) along the strike of the ice-proximal zone of Marian Cove measured on 7 February 2000 (modified from Yoo et al. Reference Yoo, Kang, Yoon, Suk and Oh2002).
The turbid surface layer is stratified within a few metres from the surface (Figs 3 & 4), and is related to local freshwater discharge to the cove. Within the drainage areas, surface heating due to radiation and warm summer temperatures (>2.0°C) (Fig. 2) causes melting of snow and glaciers, and thus the sediment-laden freshwater input increases significantly. Surface meltwater discharge is concentrated at the head of the cove and its influence decreases towards the mouth (Fig. 3). In the surface layer, the surface plume of supraglacial meltwater discharge exists within 1 m of the surface. Due to vertical mixing by waves and wind, the surface plume does not maintain its integrity from the head to long distances. Thus, the surface plume, as defined by slight horizontal salinity and turbidity gradients, is not considered as a distinct water mass.
Temperature and salinity data measured in Maxwell Bay just off the inlet of Marian Cove (surface water in Maxwell Bay) and at stn 5 in the inner basin of the cove (16 December 2000) are illustrated in Fig. 5. Surface water temperature in the bay is vertically homogeneous in winter, but becomes warm gradually during summer (Yoo et al. Reference Yoo, Kang, Yoon, Suk and Oh2002). Chang et al. (Reference Chang, Jun, Park and Eo1990) reported the presence of warm surface water in the upper c. 50 m of the bay: 0.5–1.4°C on 27 January 1989, 0.7–1.1°C on 4 February 1989, and 0.2–0.5°C on 16 January 1990. The high temperatures can be explained by supply of warm surface water in addition to direct solar heating of the surface layer. The sill between the bay and the cove permits free water exchange in the surface layer and the bay strongly affects the temperature distribution within the cove in summer. Because sea ice is formed partly from June to September in the cove, melting of sea ice does not play a significant role in freshening of surface water during summer. Salinity in the cove is consistently lower than that in the bay due to the local freshwater discharge (Yoo et al. Reference Yoo, Yoon, Oh, Kim and Kang1999, Reference Yoo, Yoon, Oh, Kang and Khim2000, Reference Yoo, Yoon, Oh, Kang, Kim and Bae2003). On 3 January 1996, mid-depth (52–74 m) water with slightly colder temperatures (-0.63 to -0.58°C) and slightly lower transmissivity (3.60–3.65 V) than the ambient water (Maxwell Bay inflow layer and deep water) was observed at stn 3 near the glacier front (Fig. 3), which suggests water originating from a subglacial tunnel or grounding line of the glacier. The presence of a turbid/cold mid-depth layer is often reported in the ice-proximal zone of Antarctic fjords (Domack & Williams Reference Domack and Williams1990, Domack et al. Reference Domack, Foss, Syvitski and McLennen1994). On 7 February 2000, the turbid/cold feature of the cove was pronounced from 11–26 m water depth at stn 1 and stn 2 of the transverse transect (Fig. 4). Dumping of a large amount of sediment at the base of the tidewater glacier can generate down-slope turbidity currents (Domack et al. Reference Domack, Foss, Syvitski and McLennen1994), but such currents were not observed in the ice-proximal zone of Marian Cove (Yoo et al. Reference Yoo, Yoon, Oh, Kim and Kang1999, Reference Yoo, Yoon, Oh, Kang and Khim2000, Reference Yoo, Yoon, Oh, Kang, Kim and Bae2003), suggesting that turbulence is weak near the grounding line of the tidewater glacier. Far-field stations (stn 6 and stn 7) away from the glacier front do not exhibit such a water layer.

Fig. 5 Temperature-salinity diagram of Marian Cove (near stn 5) and Maxwell Bay (8 stations) (see Fig. 1 for location). The data were obtained on 14–16 December 2000.
The turbid/cold mid-depth layer was clearly visible in profiles from at stations 1 and 2 in front of the north-western glacier of the cove (Fig. 4). The glacier at the calving front is c. 50–170 m thick and is thicker with increasing water depth (Fig. 6). The starting point of the features in sub-polar fjords is a subglacial meltwater conduit system that is closely associated with the crevasses in summer (Paterson Reference Paterson1981). Supraglacial meltwater can potentially connect to subglacial pathways through crevasses. The presence of the turbid/cold mid-depth layer in the inner cove indicates well developed subglacial networks on the north-western side of the glacier. Figure 6 is a schematic view of the water structures in the cove and subglacial discharges with crevasse conduit systems, consistent with typical Antarctic fjords in terms of water turbidity (Syvitski et al. Reference Syvitski, Andrews and Dowdeswell1996).

Fig. 6 Schematic diagram of water structures and glacial meltwater discharges (supra- and subglacial discharges) in Marian Cove during summer (modified from Yoon et al. Reference Yoon, Han, Park, Oh and Chang1997). The sedimentary facies in the cove are also shown.
Factors influencing water structure and behaviour of meltwater plumes
Tides
A 24-hour time series of CTDT profiles was obtained at stn 5, in the inner basin, at c. 1-hour intervals between 21h00 14 December and 20h00 15 December 1996. A maximum tidal range of c. 220 cm was recorded over c. 1.5 semi-diurnal cycles (Fig. 7a).

Fig. 7 Vertical and temporal variations of a. air temperature (°C) and tidal height (cm) (dashed line), b. wind direction (°) (I: northern sector, II: western sector, III: southern sector, IV: eastern sector) and wind speed (m s-1) (dashed line), c. temperature (°C), d. salinity, and e. transmissivity (V) of seawater at station 5 during CTDT casting on 14 and 15 December 1996. The two flood periods are shaded in grey. Turbid/cold surface and mid-depth layers are shaded in blue in c. and brown in e., respectively.
Closely packed isotherms (< 0.0°C) and low transmissivity (< 2.7 V) were observed in the upper 10 m of the surface water (Fig. 7c & e). During the melt season, a surface layer characterized by low salinities, high turbidity and cold temperatures develops in the cove. The presence of a sediment plume in the cove indicates freshwater release from the glacier to the cove. From our field observations, a small waterfall near the glacier terminus and small meltwater streams formed by melting of side glaciers or draining of a linked lake were identified. Most of the turbid sediment-laden plumes were restricted largely to the north-western margin of the glacier (Yoon et al. Reference Yoon, Park, Domack and Kim1998, fig. 8) which is heavily crevassed and terminates on land (Yoon et al. Reference Yoon, Park, Domack and Kim1998, fig. 2 aerial photograph). The direct thermal melting of ice contributes to the fresh surface plume, but water from this source retains a less turbid character due to a relatively clean glacial face. In Marian Cove, the well-defined turbid fresh surface water is derived from terrestrial and supraglacial meltwater. This turbid water plume was well developed during the first flood tide while it was not clearly observed during the second (Fig. 7e). Considering winds were calm or light during the measurement, plume development is thought to be controlled by air temperature. Air temperature before the measurement maintained at c. 1.0°C and a large supply of increased meltwater could intrude into the cove. From the beginning of the measurement to 09h00 15 December it dropped to 0.0°C. Therefore, due to the colder air temperature, decreased potential of meltwater input into the cove may result in less developed surface water during the second flood tide.

Fig. 8 Vertical and temporal variations of a. air temperature (°C) and tidal height (cm) (dashed line), b. wind direction (°) (I: northern sector, II: western sector, III: southern sector, IV: eastern sector) and wind speed (m s-1) (dashed line), c. temperature (°C), d. salinity, and e. transmissivity (V) of seawater at station 6 on 21 and 22 January 1998 (modified from Yoo et al. Reference Yoo, Yoon, Oh, Kim and Kang1999). Two flood periods are shaded in grey, turbid/cold surface and mid-depth layers in blue in c. and brown in e., respectively, and upwelling event period in blue in c., d. and e. (from 15h00 to 18h00 21 January).
The turbid/cold layer was observed at intermediate depths (c. 40–70 m), and was characterized by lower temperature (<-0.1°C) and higher turbidity (<3.1 V) compared to the ambient water (Fig. 7c & e). This observation indicates that the characteristics may have originated from neutrally buoyant water through conduits of the crevasse system. The overarching trend in temperature and transmissivity profiles is the presence of the mid-depth layer during the flood tide and disappearance during the ebb tide (Fig. 7c & e). In addition, the presence of this layer was prominent over the first flood tide, while it was less pronounced during the second flood tide. This suggests that the variability of the mid-depth layer may be closely associated with tidal frequencies. The difference between the first and second flood tides may be due to changes in air temperature and the associated extent of supraglacial streams. At higher air temperatures, these streams may supply large volumes of water to crevasse conduits, and thus the mid-depth layer is more prominent during the first flood tide.
Winds
Yoo et al. (Reference Yoo, Yoon, Oh, Kim and Kang1999) reported that winds played an important role in water exchange of Marian Cove. Their work was based upon 23-hour on-board CTDT profiles obtained at 1-hour intervals at stn 5 on 21–22 January 1998 (Fig. 8). The maximum tidal range was c. 90 cm and air temperatures ranged from -0.1–3.2°C (Fig. 8a). With the exception of the second flood tide during the measurement period, the feature of closely packed isohalines and low transmissivity was not observed over the measurement when wind was light (<6.0 m s-1). The most remarkable aspect in the water column is that the Maxwell Bay inflow was not observed for the first 3 hours of the measurement (Fig. 8c). At that time, the Maxwell Bay inflow layer (>0.8°C) appeared at 15–30 m (Fig. 8c). The interaction of tidal effects with the fjord water under calm or light wind is demonstrated in Fig. 7. The variation pattern of Maxwell Bay inflow was nearly consistent with tidally-induced vertical movement of water which extends into the inner cove (Fig. 7c). The disappearance of warm water may be explained by an upwelling event, upward movement of deep water that is colder than the Maxwell Bay inflow.
The upwelling event (shaded in blue in Fig. 8) in the early stage of CTDT measurements (from 15h00 to 18h00 21 January) is probably related to the wind influence prior to the measurements under weak tidal influence (Fig. 8a & b). For 15 hours prior to the measurements (from 00h00 to 15h00 21 January), there was a strong easterly wind with speeds of >9 m s-1. The wind-induced advection can be strong enough to generate upwelling near the head of the cove. There were no icebergs in the inner cove even though ice calving was actively occurring in January, which indicates the movement of icebergs out of the cove by the easterly winds. In an earlier study of Maxwell Bay, Klöser et al. (Reference Klöser, Ferreyra, Schloss, Mercuri, Laturnus and Curtosi1994) reported that frequent easterly and katabatic winds at Potter Cove (Fig. 1) could enhance the speed of the outflow and slow down or reverse the inflow, thus the surface water in the ice-proximal zone would be replenished by upwelling water. In addition, Nowosielski (Reference Nowosielski1980) reported that wind-induced advection caused the generation of outflow and the upwelling along the bottom of the inner bay of Admiralty Bay (Fig. 1).
When wind forcing became weak and the upwelling stopped, the Maxwell Bay inflow appeared in the inner cove (Fig. 8c). After 6 hours, the tide was ebbing and the turbid/cold layer (<0.7°C, <4.2 V) was observed at 40–55 m (Fig. 8e). This observation may have been controlled by changes in air temperature. Throughout measurement, air temperatures were c. 0.7–3.0°C, leading to meltwater production in supraglacial streams and percolation to the glacier bed; thereby facilitating development of the mid-depth layer.
Besides the instability of water column, high turbidity of surface water due to the resuspension of benthic material is accompanied by upwelling. Brandini & Rebello (Reference Brandini and Rebello1994) reported that the surface layer was turbulent and turbid during upwelling periods due to the resuspension of benthic diatoms in the inner inlets (c. 10–30 m) of Admiralty Bay. In Potter Cove, with shallow depths in the inner basin (<30 m), resuspension of benthic material was observed (Klöser et al. Reference Klöser, Ferreyra, Schloss, Mercuri, Laturnus and Curtosi1994). In contrast, the resuspension of bottom material in Marian Cove would be insignificant because the depth of the inner basin (c. 120 m) is too deep to cause resuspension of the bottom sediment by upwelling. This interpretation is supported by the low turbidity of the surface water during the upwelling event (Fig. 8e).
Other factors
The Coriolis effect is important only where the fjord width exceeds the Rossby radius of deformation (Gill Reference Gill1982), which is c. 5–10 km in typical polar environments. The surface circulation of Maxwell Bay is influenced by a cyclonic gyre associated with the Coriolis effect (Chang et al. Reference Chang, Jun, Park and Eo1990). However, Marian Cove is only c. 1.5 km wide, and the Coriolis effect does not seem to be present even at the low speed of outflow from the cove. Nevertheless, the hydrography of the cove appears to be influenced by the surface cyclonic circulation in adjacent Maxwell Bay. The inflowing Maxwell Bay water entrains clastic and suspended particles along the northern shore of the cove and carries them out to Maxwell Bay (Yoo et al. Reference Yoo, Yoon, Oh, Kang and Khim2000). Indirect evidence for such a current regime is provided by the paths of icebergs calved from Marian Cove glacier; these flow along the northern shore between head and inlet under calm conditions. This circulation is able to deliver surface water and suspended particles to Maxwell Bay.
The glacier entering Marian Cove is gradually retreating, with active calving in summer. Although most floating icebergs move out of the cove, occasionally abundant icebergs are observed in the cove. Yoo et al. (Reference Yoo, Yoon, Oh, Kang and Khim2000) measured the water column structure and dispersal pattern of suspended particulate matter when the cove contained a large number of floating icebergs. Icebergs were completely stuck in the inner basin of the cove by strong north-western winds (>7.5 m s-1). The maximum tidal range was c. 140 cm and air temperature ranged from 1.0–2.5°C. From the 24-hour CTDT profiles obtained at stn 6 in the central basin (Fig. 1), a cold, clean, fresh surface layer (>10 m thick) was observed throughout the measurement. This layer may simply be the result of mixing of clean meltwater from icebergs within the inner cove. In the central basin, the turbid/cold structure observed in the ice-proximal zone (stn 5) was not exhibited.
Strong rainfall may be one of the factors affecting short-term meltwater discharge in sub-polar regimes during the summer. Yoo et al. (Reference Yoo, Yoon, Oh, Kang, Kim and Bae2003) reported variable meltwater discharges during a rainstorm event. A 12-hour rainstorm resulted in 22.7 mm of rainfall near Marian Cove and supplied freshwater to the glacial drainage basin. Such an event may lead to high-density glacial meltwater discharges into the cove. However, strong rainfalls in summer are infrequent and have a short duration, and thus their records in the cove may not be recognized (i.e. Yoon et al. Reference Yoon, Han, Park, Oh and Chang1997), although rainstorm-induced event sedimentation is commonly observed at the front of temperate tidewater glaciers (e.g. Cowan et al. Reference Cowan, Powell and Smith1988).
Sedimentation in the cove
Marian Cove is floored with a thin sediment drape (<6 m) on the acoustic basement (Yoon et al. Reference Yoon, Han, Park, Oh and Chang1997). Park et al. (Reference Park, Han, Yoon and Kim1998b) reported that the apparent sediment accumulation rate on the floor ranges from 0.15–0.43 cm yr-1, much lower than that estimated in many Northern Hemisphere fjord environments (e.g. Powell & Molnia Reference Powell and Molnia1989). Sediment accumulation rate obtained from 210Pb age dating is 0.075 cm yr-1 (Kim Reference Kim1989) at the central basin of the cove, very similar to the 0.09 cm yr-1 (14C radiocarbon age dating) rate for the upper facies of core sediment obtained from the same basin (Yoon et al. Reference Yoon, Yoo, Park, Kim, Khim and Kang2004).
The core sediment in the upper facies over the cove was composed of basal or supraglacial meltwater-derived sediment (Yoon et al. Reference Yoon, Han, Park, Oh and Chang1997, Reference Yoon, Yoo, Park, Kim, Khim and Kang2004). The absence of gravity-flow structures and rhythmic laminations indicates that the sedimentation in the cove was slow, as evidenced by preservation of whole shells (i.e. Yoldia eightsi (Couthouy)) on the floor (Yoon et al. Reference Yoon, Han, Park, Oh and Chang1997).
Exchange of surface waters between Maxwell Bay and Marian Cove is active, yielding significant lateral transport of suspended particulate matter (SPM) from the cove to the bay (Yoon et al. Reference Yoon, Park, Domack and Kim1998). The SPM in the fjords and bays of the South Shetland Islands consists of fine silty mud, and SPM in surface waters accounts for > 50–90% of the total SPM (Khim et al. Reference Khim, Shim, Yoon, Kang and Jang2007). Most SPM in Marian Cove consists of clastic sediments and organic matter from primary production (Yoon et al. Reference Yoon, Park, Domack and Kim1998, fig. 6). Using data from a sediment trap deployed in the cove, Khim et al. (Reference Khim, Shim, Yoon, Kang and Jang2007) reported that lithogenic particle flux comprises c. 90% of the total flux of terrigenous sediments. The deposition of suspended particles on the sea floor would depend upon their residence time, which is set by fjord circulation patterns within the cove. However, the cove has weak potential for sediment deposition on the bottom due to low SPM concentrations (<10 mg l-1) (Table I).
From early December to late April, Marian Cove is free from sea ice. At the start of summer, turbidity level rises, which indicates the initiation of sediment flux into the cove. The degree of turbidity decreases with increasing water depth except for the mid-depth layer found only in the inner basin of the cove (Figs 3, 4, 7 & 8). In the surface layer of the cove (Yoon et al. Reference Yoon, Park, Domack and Kim1998), aggregates of fine-grained lithogenic and organic materials and flocs of biological detritus were observed. In contrast, in the mid-depth layer, only coarse silty materials (mean grain size: c. 51.5 µm) with typical morphoscopic characteristics of glacial-originated sediments, such as conchoidal fractures, step-like features, sharp edges and breakage block, were observed (Fig. 9, Table II). This indicates that the suspended sediments in the mid-depth layer were transported by horizontal buoyant plume rather than vertically deposited by settling from the supraglacial meltwater plume at the head of the cove. Hydrographically driven fluctuations in the position of the mid-depth layer and associated suspension settling can contribute to the depositional source in the ice-proximal zone.

Fig. 9 Scanning electron microscope photomicrographs of suspended particulate matters in the cold/turbid tongue of mid-depth layer (42 m; referred in Table II). a. Filtered particles and b. angular to sub-angular particles with sharp edges, cleavage block and step-like features.
The contribution of ice-rafted debris (IRD) to ice-proximal sedimentation in Antarctic fjords is known to be much less than that occurring in Alaskan and Greenland fjords (Syvitski et al. Reference Syvitski, Andrews and Dowdeswell1996). Detachment of the tidewater glacier along a crevasse system of the northern glacier occurs during summer. However, on X-radiographs of core sediment from Marian Cove (Yoon et al. Reference Yoon, Yoo, Park, Kim, Khim and Kang2004, fig. 5), there is no condensed IRD in the upper facies, but some scattered IRD, indicative of a small influx of IRD. This seems to be due to relatively clean icebergs and/or the short residence time of icebergs in the cove.
In summer, fjord water in Marian Cove is subject to tide and wind forcings, similar to the observations from other fjords in King George Island (Klöser et al. Reference Klöser, Ferreyra, Schloss, Mercuri, Laturnus and Curtosi1994). The wind- and tidally-induced behaviours of surface and mid-depth layers seem to control the depositional processes of SPM in the cove. The easterly wind, coupled with ebb tides, will drive out surface water and accordingly the suspended sediment flux out of the cove would be quite high. In contrast, flood tides coupled with the north-western and western winds allow enhanced sedimentation in the cove by increasing residence time of SPM. The mid-depth layer is no exception to this pattern. The maximum development of the mid-depth layer during flood tides increases the potential for deposition for suspended sediments in the inner basin, while its weak development during ebb tides decreases the potential of sediment deposition. This implies that suspended sediments will be selectively deposited in the ice-proximal zone of the inner basin, leading to the deposition of the laminated sand and mud facies in association with tidal cycles. However, in the upper part of the core sediment from the central basin (Yoon et al. Reference Yoon, Yoo, Park, Kim, Khim and Kang2004), this facies was not distinct, although some faint laminations associated with seasonal variations of deposition were observed. This observation can be explained by the destabilization of the water column due to strong and frequent wind forcings and/or by the limited influence of mid-depth layer on the deposition of SPM in the ice-proximal zone. Another explanation for the structureless facies may be the unstable subglacial conditions during summer. Due to the recent warming, the glacial terminus in the cove has retreated rapidly at c. 81.2 m yr-1 from 1994–2001 (Park et al. Reference Park, Chang, Yoon and Chung1998a). Such a rapid retreat rate suggests unstable subglacial conduit networks resulting in low entrainment of glacial meltwater and a weak turbulent jet at the grounding line.
Summary
Hydrographic measurements during summer in Marian Cove from 1996–2000 reveal the presence of glacial meltwater plumes and their effect on water structures, and provide information on hydrodynamics and depositional processes in the cove. Four distinct layers are recognized in summer: i) a cold and turbid surface layer, i) a warm Maxwell Bay inflow layer with characteristics of surface waters in adjacent Maxwell Bay, iii) a mid-depth turbid/cold layer originated from subglacial meltwater discharge, and iv) a fjord deep layer comprised of remnant winter water. Although Marian Cove is in some ways a typical Antarctic fjord, it has its own unique circulation patterns and morphological features.
Marian Cove is characterized by two turbid sediment-laden meltwater systems. Surface plumes are produced by thermally melting ice due to glacier-water contact melting, waterfalls and meltwater streams. The turbid/cold mid-depth layer close to glacier terminus represents subglacial discharge rising tens of metres to form buoyant plumes. The fluctuations in the position and thickness of the mid-depth layer are best explained by the subglacial meltwater discharge dynamics related to hydrographic conditions (including tide, wind, temperature and rainfall) and tidal flushing of the grounding line from the subglacial conduit system. With no precipitation or icebergs, the time-dependent plumes at the surface and mid-depth in the ice-proximal zone are developed mostly by tides coupled with wind effects. Under weak tidal influence, strong and persistent winds from the eastern direction generated an upwelling event near the cove head, which interrupted the usual development of surface and mid-depth layers within the cove.
The depositional environment of Marian Cove is characterized by suspension settling of meltwater-derived sediment, and the depositional processes are mainly influenced by the hydrographic and meteorological forcings. Tidal forcing coupled with wind stress played an important role in the ice-proximal distribution and deposition of SPM in the cove.
Wind effects keep sediments of the turbid surface layer in suspension, which facilitates transportation of suspended particles into and out of the cove. However, the north-westerly and westerly winds coupling with flood tides probably caused supraglacial meltwater particles to deposit in the ice-proximal zone. Above all, the turbid/cold mid-depth layer becomes a main contributor to the source of terrigeneous sediments in the inner basin of the cove.
Acknowledgements
We would like to thank the over-wintering party of the King Sejong Station for operation of the rubber boat in Marian Cove during the 1996–2000 KARP (Korea Antarctic Research Program) cruise. We are also grateful to the crew of RV Yuzhmorgeologya for all their help during the CTDT on-board measurements. This research was funded by KOPRI Grant PP14010. This manuscript benefited from constructive comments by the Editor Dr Laurence Padman and two anonymous reviewers.