


Introduction
Fertility levels and patterns vary widely across the regions of India. The northern part of India is characterized by high fertility rates, but the southern part has below replacement level fertility (Guilmoto & Rajan, Reference Guilmoto and Rajan2002; ORGI, 2014). Situated in the eastern part of the country, West Bengal lies between the much talked about North–South demographic divide of India (Dyson & Moore, Reference Dyson and Moore1983; Bhat, Reference Bhat and Srinivasan1996). The unique geographical features of West Bengal include the Himalayas in the extreme north, the Rarh regions in the west, the fertile Gangetic plains in the south-eastern regions and the coastal Sunderbans in the south, engulfed by the Bay of Bengal. With a population of 91,347,736, West Bengal is the fourth most populous state in India with 31.87% of the population residing in urban areas (Census of India, 2011). A detailed description of the demographics of West Bengal is presented in Table 1.
Table 1. Demographic profile of West Bengal by rural–urban place of residence

Source: Census of India, 2011.
Note: the sex ratio in India is computed as the number of females per 1000 males.
The demographic transition of Greater Bengal, encompassing the present Bangladesh, is one of the most intensely studied transitions in the world. The fertility decline in Bengal in terms of both aspects of onset and pace have defied many standard explanations of fertility decline (Basu & Amin, Reference Basu and Amin2000). Studies have demonstrated that historical and cultural factors have notable roles in reproductive change in Bengal (Amin & Lloyd, Reference Amin and Lloyd2002; Basu & Amin, Reference Basu and Amin2000; Amin et al., Reference Amin, Basu and Stephenson2002). The Bengali-speaking elite have been important sources of transmission of new ideas among the general population. Notably, the state capital Kolkata (formerly known as Calcutta) underwent fertility transition from the early 1970s and achieved the lowest Total Fertility Rate (TFR) (2.0) in the country (Bhat, Reference Bhat and Srinivasan1996) before any other area – a rank it maintains to date (in 2011, the TFR for West Bengal was 1.7 and for Kolkata it was 1.2) (Bhat, Reference Bhat and Srinivasan1996; Census of India, 2011; Guilmoto & Rajan, Reference Guilmoto and Rajan2013). While Kolkata has been the centre of epitome when it comes to the adoption of new reproductive choices, rural–urban differentials in fertility preference and levels persist (ORGI, 2014).
Rural–urban differentials in fertility patterns date back to the early studies on fertility (Robinson, Reference Robinson1961; Kuznets, Reference Kuznets1974) and the ideas are still relevant to contemporary work (Guilmoto & Rajan, Reference Guilmoto and Rajan2002; Khan, Reference Khan2013; ORGI, 2014). These were characterized by a decline in fertility rates in urban areas, followed by a reduction in rural areas. Fertility in the urban areas in West Bengal in the early 1980s was lower than in most other urban places in the country. Fertility decline in West Bengal is deep-rooted culturally. However, son preference might be more dominant in rural villages, which might increase fertility, but this might not exist in urban places. Additionally, the uptake of modern contraception has been rather low in the state compared with other states of India as a substantial proportion of women rely on traditional methods (IIPS & ORC Macro, 1995, 2000, 2007; IIPS & ICF, 2017). In fact, the use of contraception is higher among rural women than their urban counterparts. The uptake of modern contraception has been shown to vary between 58.7% in rural areas and 53% in urban areas of West Bengal (IIPS & ICF, 2017).
Several prior studies on West Bengal have indicated a reliance on traditional contraceptive methods and diffusion processes through peers and elites leading to an early decline in fertility (Chandrasekaran & George, Reference Chandrasekaran and George1962; Pakrasi & Halder, Reference Pakrasi and Halder1981; Basu & Amin, Reference Basu and Amin2000). However, increased age at marriage and education have been shown to have more direct roles in fertility decline (Nag, Reference Nag1984; Das, Reference Das2004). Primary studies have also found that religion undermines the effects of female education in certain villages (Mandal et al., Reference Mandal, Mallik, Roy, Mandal, Dasgupta and Mandal2007). A recent study suggested that changes in the value system played a role in recent declines in fertility in West Bengal (Ghosh, Reference Ghosh2017).
The annual state-level variations in fertility rates are captured by the Sample Registration System in India (SRS). Using data from the census and different surveys, indirect estimates of fertility rates have been provided by different studies (Bhat, Reference Bhat and Srinivasan1996; Guilmoto & Rajan, Reference Guilmoto and Rajan2002, Reference Guilmoto and Rajan2013; Das & Mohanty, Reference Das and Mohanty2012; Mohanty & Rajbhar, Reference Mohanty and Rajbhar2014). However, these studies did not analyse fertility rates by place of residence. Also, there is a dearth of studies comparing the factors associated with the decline in fertility in West Bengal by place of residence. Level of urbanization plays a crucial role in determining fertility in ancillary ways. As West Bengal shows quite a unique feature in terms of its fertility behaviour in both rural and urban areas, it will be useful for policymakers to understand how the factors affect fertility in rural and urban West Bengal. The present study attempted to capture the rural–urban differences in fertility levels and preferences and the factors associated with these at the macro level in West Bengal.
Methods
Sources of data
The study was based on data from the 2011 Census of India (Census of India, 2011) and 2015–16 National Family Health Survey (NFHS)-4. The Census of India is conducted in every 10 years and covers different parameters of population, providing data to analyse fertility, migration, mortality and development. The NFHS-4 is the fourth round of the Demographic and Health Survey (DHS) in India and provides extensive information on fertility, mortality, morbidity, fertility preferences and health (IIPS & ICF, 2017). District-level Under-5 Mortality Rates (U5MRs) were derived from Ram et al. (Reference Ram, Jha, Ram, Kumar and Awasthi2013). Also, the life tables and certain state-specific data were drawn from the Sample Registration System (ORGI, 2014). The questions pertaining to fertility and fertility preferences were drawn from the individual file of NFHS-4 asked to women of reproductive age (15–49 years).
Analysis
The unit of analysis was ‘district’, and the analysis focused on all nineteen districts of West Bengal. The Singulate Mean Age at Marriage (SMAM) was computed using Hajnal’s technique (Reference Hajnal1953). This is the average length of a single life expressed in years among those who marry before age 50. The following formula was used to compute SMAM separately for rural, urban and total areas:
 $${\rm{SMAM}} = {\rm{}}{{15 + 5 \times \mathop \sum \nolimits_{a = 15 - 19}^{45 - 49} Sa + 50 \times {{\left( {{S_{45 - 49}} + {S_{50 - 54}}} \right)} \over 2}} \over {1 - {{\left( {{S_{45 - 49}} + {S_{50 - 54}}} \right)} \over 2}}}$$
where Sa denotes the proportion single in age group a. The TFR was computed using the Reverse Survival Technique, which is one of the most commonly used indirect techniques to compute fertility rates (Bhat, Reference Bhat and Srinivasan1996; Das & Mohanty, Reference Das and Mohanty2012; Mohanty & Rajbhar, Reference Mohanty and Rajbhar2014). Survival ratios were calculated for all the bigger states of India for the population aged 0–6 years using the life table populations provided by the SRS, which are available only for the bigger states and union territories (Andhra Pradesh, Assam, Bihar, Chhattisgarh, Delhi, Gujarat, Haryana, Himachal Pradesh, Jammu & Kashmir, Jharkhand, Karnataka, Kerala, Madhya Pradesh, Maharashtra, Odisha, Punjab, Rajasthan, Tamil Nadu, Uttar Pradesh and West Bengal). Here, in the age group 5–9 years, since the study only concentrated on 5 and 6 years, the value 0.4(2/5) was multiplied to the term.
The regression coefficients from state-specific survival ratios were used to compute the district-specific survival ratios separately for rural, urban and total populations. The U5MRs for rural and urban areas were computed using Brass indirect estimation using the age groups 20–24 and 25–29 years in the United Nations South Asian Model. Next, the total births were computed using the population aged 0–6 and the survival ratios disaggregating by rural and urban areas. The following step was the computation of the Crude Birth Rate (CBR) using the total number of births and the mid-year population between March 2005 and 2011, which refers to the total number of births taking place before the 2011 Census of India was conducted. An annual growth rate of 1.384% was considered.
Lastly, based on the state-level time series data (1981–2011) for West Bengal, TFRs were regressed on CBRs separately for rural, urban and total sectors to obtain regression coefficients. It should be noted that the TFRs so obtained were based on births in the last 6 years preceding the census, hence the estimates should ideally refer to the midpoint between 2005 and 2011. A detailed description of the method is available elsewhere (Das & Mohanty, Reference Das and Mohanty2012).
To understanding fertility preferences, different dimensions including ‘mean ideal number of children, sons and daughters’, ‘wantedness of children by number of surviving children’ and ‘gap between ideal and actual number of children, sons and daughters’ were computed for all the districts. The mean values of these measures were computed at the district level based on the answers given by the women interviewed in the survey. Those who declared having been sterilized, did not have sex or declared being infecund were dropped from the analysis.
For the multivariate analysis, multiple linear regression was used with TFR by place of residence as the dependent variable in each of the models. The independent variables used were percentage of currently married women in the age group 15–49 years using any contraceptive method, under-five child mortality rate, singulate mean age at marriage (SMAM), percentage of women with 10 + years of schooling, percentage of poor population and percentage of Muslim population.
Results
Trends in fertility rates by place of residence
The TFR of West Bengal declined from 4.2 in 1981 to 1.6 in 2013, and varied from 2.4 to 1.6 between 1981 and 2013 in the urban territories, and from 4.8 to 1.2 between 1981 and 2013 in the rural areas of West Bengal (Fig. 1). Over these three decades the gap between rural and urban TFRs reduced substantially, with the decline mainly beginning in the 1990s.

Figure 1. TFRs in West Bengal by rural–urban place of residence (1981–2013) at 5-year intervals. Source: Sample Registration System, 2014.
Differentials in mean age at marriage by district
West Bengal displayed an overall singulate mean age at marriage (SMAM) of 20.1 years in rural and urban areas combined. The rural–urban difference in SMAM was around 1–2 years in most districts (Fig. 2 and Table 2). The urban SMAM was slightly higher (21.6 years) than that of rural areas (19.5 years). Kolkata showed the highest SMAM (23.1 years), and the lowest was observed in Murshidabad and Birbhum (19.2 years). In the rural settings, the highest SMAM was observed in Darjiling (21.7 years) and the lowest in Murshidabad (18.9 years). In the urban settings, the SMAM was lowest in Purba Medinipur (20.3 years) and highest in Kolkata (23.1 years). Gaps of more than 2 years in rural–urban SMAM were noted in Koch Bihar, Bardhhaman, North Twenty-Four Parganas and South Twenty-Four Parganas. North Twenty-Four Parganas exhibited the highest gap in rural–urban SMAM (2.5 years), and the lowest was observed in Jalpaiguri (0.1 years).

Figure 2. Singulate Mean Age at Marriage (SMAM) by district and rural–urban place of residence, West Bengal, 2011.
Table 2. Estimated TFR and SMAM by rural–urban place of residence, West Bengal, Census of India 2011

a There are no rural areas in Kolkata district so this was no included.
Fertility preference by place of residence
Figure 3 presents the mean ideal number of children, sons and daughters as stated by the women in the districts of West Bengal by rural–urban place of residence. The mean ideal number of children stated by the women was 2.0; this varied slightly between 1.9 in urban areas and 2.0 in rural areas, with little deviations across districts. The highest ideal number of children stated was 2.6 in the district of Uttar Dinajpur and the lowest was 1.8 in the districts of Darjiling, Nadia, North Twenty-Four Parganas and Kolkata. In urban areas, the highest and lowest ideal number of children varied between 1.6 in Jalpaiguri and 2.3 in Murshidabad and Puruliya; whereas in rural areas it varied between 2.7 in Uttar Dinajpur and 1.6 in Jalpaiguri. The ideal number of sons and daughters in West Bengal varied slightly between 0.9 and 0.8, respectively, with little difference by place of residence. The highest mean ideal number of sons was observed in Uttar Dinajpur (1.4), and this varied from 0.9 to 1.4 in urban and rural parts of the district, respectively. The least was observed in the district of Haora (0.8), with little difference by place of residence. Similarly, the highest mean ideal number of daughters was observed in Uttar Dinajpur (1.2); this ranged between 0.8 and 1.2 in the urban and rural parts of the district, respectively, and the lowest value was found in Haora (0.7).
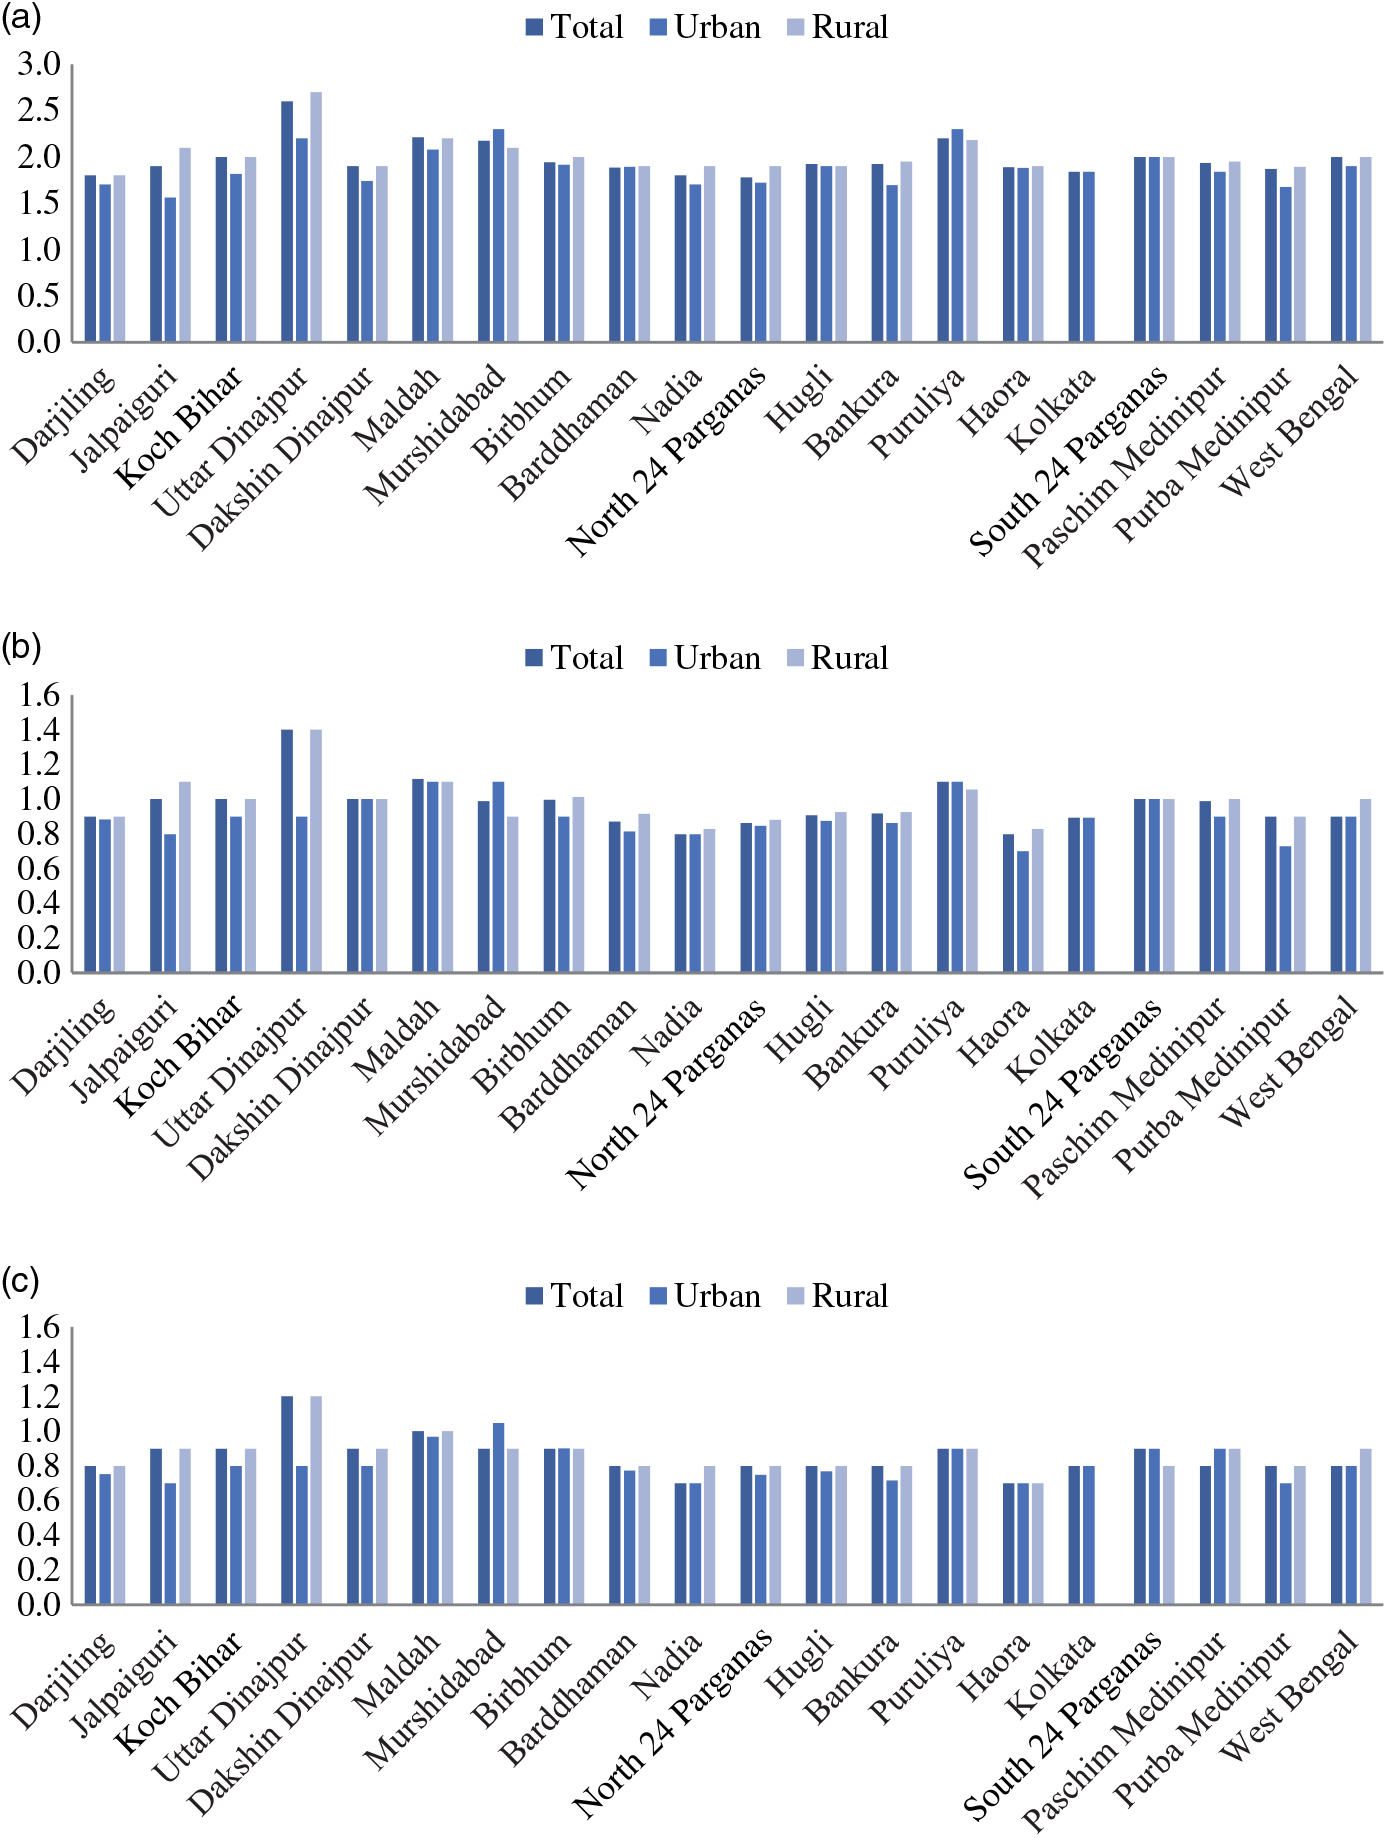
Figure 3. Ideal number of children (a), sons (b) and daughters(c) by district and rural–urban place of residence, West Bengal, NFHS-4.
Difference in urban–rural fertility preference was examined at the district level. Table 3 presents the wantedness of children by the women based on the number of living children disaggregated by place of residence. In general, with increasing parity, the wantedness of children declined substantially for all districts. The wantedness of children at 0 parity was 82.4%, declining to 45.9% for parity 1 and further to 10.1% for women with 2 + parity. The wantedness of children at parity 0 for urban areas was 77.7%, compared with 84.6% in rural areas. At parity 1 it ranged from 35.6% in urban to 52.3% in rural areas. The wantedness of children was found to be least in Darjiling at parity 1 (30.8%) followed by Bardhhaman and Kolkata (34.9%). Of the nineteen districts of West Bengal, in only eight districts did more than 50% of women with 1 living child want to have more children. Compared with two districts, viz. Murshidabad and South Twenty-Four Parganas, in the urban settings, more than 50% of the women with 1 living child in twelve districts in the rural areas wanted additional children. The wantedness of children varied between 30.9% in Puruliya and 1.4% in Koch Bihar at parity 2 + . Among women with no children it was least in urban Bankura (35.9%). Also, among women with 2 + parity, it was highest in urban Paschim Medinipur (34.6%) followed by Puruliya (32.7%).
Table 3. Wantedness of children by number of living children (0–2 + ) and rural–urban place of residence, West Bengal, NFHS-4 (% of women)

a There are no rural areas in Kolkata district so this was no included.
Table 4 shows the gap between ideal and actual number of living children, sons and daughters as stated by the women. At the state level, only 40% of the women had their desired number of children and this varied little by place of residence. The percentage ranged between 48.8% and 29.8% in Nadia and Uttar Dinajpur, respectively. In urban settings, it ranged from 29.1% in Murshidabad to 53.6% in Purba Medinipur. However, in rural settings, the highest and lowest values were found in Nadia (48.2%) and Uttar Dinajpur (28.5%) respectively. At the state level, the women’s actual number of children was more than their ideal number for only 16.9% of the women, whereas 43.1% did not reach their ideal number of children. Having more children than desired was higher in districts with the highest rates of fertility such as Uttar Dinajpur (21.8%), Paschim Medinipur (20.7%) and Maldah and Koch Bihar (20%). Not being able to reach their ideal number of children was lowest in Nadia (36%) and highest in Uttar Dinajpur (48.5%) and Kolkata (48.3%). The percentage of women having less than their desired number of children was higher in urban settings (45.9%) than in rural areas (41.7%). The rate of having more than their desired number of children ranged from 19.4% in Puruliya to 9.6% in Koch Bihar among urban settings, whereas in rural settings it ranged from 22.5% in Uttar Dinajpur to 15.6% in Haora.
Table 4. Gaps between ideal and actual number of living children, sons and daughters by rural–urban place of residence, West Bengal, NFHS-4 (% of women)

a There are no rural areas in Kolkata district so this was no included.
A total of 44.4% of women had their desired number of sons, and this varied from 46.3% in urban to 43.5% in rural settings. At the same time, having more sons than desired was 19.8% in West Bengal, and this varied between 176% and 20.8% in urban and rural settings respectively. Around 36% of the women had less than their ideal number of sons. Having the same number of sons as desired was as high as 50.7% in Nadia and as low as 35.9% in Uttar Dinajpur. In urban settings this varied between 54.5% in Nadia and 39.3% in South Twenty-Four Parganas. In the rural settings, it varied between 49.2% in Nadia and 33.7% in Uttar Dinajpur. Having more sons than desired was highest in Koch Bihar (23.2%) and lowest in Darjiling (15.8%). It ranged from 24.5% in urban Purba Medinipur to 10.8% in urban Bankura. In rural areas it ranged between 25.7% in Murshidabad and 17.7% in Darjiling and Jalpaijuri. In Koch Bihar, 44.7% of the women had fewer sons than desired, compared with 28.9% in Nadia. In urban settings this varied from 47.4% in Murshidabad and 28.7% in Haora. However, the gap was lower in rural settings, ranging between 46.4% in Uttar Dianjpur and 27.4% in Nadia.
The gap between the desired and actual number of daughters was 44.4% in West Bengal, differing only slightly in urban (45.9%) and rural areas (43.6%). Having more daughters than desired was found to be 20.4%: 18.8% in urban areas and 21.1% in rural areas. However, 35.5% of the women had fewer daughters than desired. Having the same number of daughters that was thought ideal was lowest in Uttar Dinajpur (35.6%) and highest in Darjiling (49.4%). This was highest in urban Puruliya (52.7%) and lowest in urban Murshidabad (35.7%). For North Twenty-Four Parganas, 48.7% of women had their desired number of daughters, in contrast to 33.7% Uttar Dinajpur in rural settings. The gap between actual and desired number of daughters was highest at 24.9% in Haora and lowest in Darjiling at 14.6%. The gap was higher in urban than in rural settings. Concurrently, the proportion of women with fewer daughters than desired varied between 43.5% in Uttar Dinajpur and 28.2% in Nadia. However, having fewer daughters than desired was more common in the urban than in rural settings.
Differentials in fertility rates by district and place of residence
Table 2 shows the estimated TFRs by district corresponding to 2008 for rural, urban and total sectors (Fig. 4). Overall, West Bengal displayed a TFR of 1.9. Uttar Dinajpur showed the highest fertility with a TFR of 3, followed by Maldah with a TFR of 2.7. The lowest fertility was observed in Kolkata, with a TFR of 1. Even at the aggregate level, thirteen of the nineteen districts exhibited below replacement fertility (TFR < 2.1). The rural sectors of West Bengal exhibited a TFR of 2.1. Of these, fertility was highest in Uttar Dinajpur with a TFR of 3.2. This was followed by Maldah district with a TFR of 2.8. Ten districts showed below replacement level fertility (TFR < 2.1). However, the lowest fertility was observed in Hugli district with a TFR of 1.5. A TFR of 1.7 was found in urban West Bengal. In the urban settings, the highest fertility was noted in Murshidabad with a TFR of 2.7 and Maldah with a TFR of 2.7. The lowest urban fertility rate was found in Kolkata with a TFR of 1.0 (lowest-low fertility). Fifteen out of nineteen districts in the urban sector exhibited below replacement level fertility (TFR < 2.1). As is evident from the study, West Bengal, both in rural and urban settings, exhibited fertility rates that were not very high compared with the national level. Rural–urban differentials existed even at the district level, although the patterns were not very consistent. Fertility was higher in the regions of Uttar Dinajpur, Maldah and Murshidabad and Puruliya. Lowest fertility was observed in the south-east region in districts like Kolkata, Hugli and North Twenty-Four Parganas. Rural and urban TFRs in West Bengal differed by 0.4. Koch Bihar, Uttar Dinajpur and Dakshin Dinajpur showed very high gaps in rural–urban fertility (>0.5). Uttar Dinajpur, with an overall TFR of 3, exhibited the highest gap of 1.1 in rural and urban TFR. Haora, Hugli, Maldah and East Midnapore showed almost no variations in fertility rates in rural and urban areas. The rural–urban gaps were quite high (around 0.4), barring the districts of Hugli, North Twenty-Four Parganas (TFR 1.5) and Nadia (1.6). Most of the districts with moderately low TFRs (1.7–2.1) showed moderate gaps of around 0.2. Among the districts with highest levels of TFR, except Uttar Dinajpur, districts like Malda and Murshidabad showed low gaps of around 0.1–0.2. Interestingly, districts exhibiting TFRs around 2.2–2.5 were observed to have quite high gaps of around 0.4.

Figure 4. Total (a), urban (b) and rural (c) TFRs and by district, West Bengal, Census 2011.
Factors affecting fertility
The factors affecting district-level TFR by place of residence are presented in Table 5. Overall, a 10% increase in contraceptive use was associated with a 0.17 decline in the number of births in West Bengal. The association was stronger in rural than in urban areas, whereby a 10% increase in contraceptive use was associated with 0.15 and 0.28 declines in the number of births, respectively. Also, under-five mortality was positively associated with TFR. However, in the urban areas, due to low levels of under-five mortality the association was insignificant and reversed. Again, the age at marriage (SMAM) was significantly associated with declining fertility, its effect being stronger in rural than in urban settings. A negative association was found between women with at least 10 years of schooling and fertility with a stronger association in rural areas. A positive association existed between the poor population as well the Muslim population and TFR in urban West Bengal.
Table 5. Results of multiple linear regression of TFR on different parameters in West Bengal, Census of India 2011

# Indicates logarithmic form.
Discussion
This study computed rural–urban differentials in fertility levels and preferences in West Bengal using Census of India (2011) and NFHS-4 (2015–16) throwing light on the factors associated with rural and urban fertility rates. With a few exceptions, low fertility was exhibited by almost all districts of West Bengal regardless of rural–urban place of residence. At the aggregate level, lowest-low fertility (TFR < 1.5) was featured in the three districts of Kolkata, Hugli and North Twenty-Four Parganas. Of the rural areas, Hugli experienced the lowest-low fertility. Also, six districts witnessed lowest-low urban fertility, i.e. Koch Bihar, Dakshin Dinajpur, Nadia, North Twenty-Four Parganas, Hugli and Kolkata.
The mean ideal number of children as stated by the women in West Bengal was 2.0. In seven of the nineteen districts of West Bengal, the preferred ideal number of children by the women exceeded 2. The mean ideal number of children was more than 2.0 in five and ten districts of urban and rural West Bengal respectively. No significant differences existed in the mean ideal number of sons and daughters across the districts of West Bengal.
The wantedness of additional children of the women was examined by rural–urban place of residence and number of living children at the district level. Fewer than half of the women with a living child wanted to have more children, and this was more common in urban areas. A small percentage of women with parity 2 + expressed a desire to have further children. The desire to have additional children was somewhat higher in the rural areas and in districts with higher fertility rates.
Although limiting children is a concern for most women in India (Chatterjee & Kastor, Reference Chatterjee and Kastor2018), around 40% of the women in West Bengal attained their desired number of children, sons and daughters irrespective of their rural–urban place of residence. Further, the inability of a substantial proportion of women to reach their desired number of children was found to differ slightly by sons and daughters. This could be due to increasing sterility in the population, or it is likely that the women have yet to complete their families. Given their mean ideal number of children, this seems to be less likely.
In Uttar Dinajpur, with a TFR of 3 and women stating a mean ideal number of children of 2.6, 48.5% of the women were still to attain their ideal number of children. This could be because women were giving socially desirable answers to the question of their ideal number of children.
Contraception use, female education, under-five mortality, and poor and Muslim population levels all exert an effect on fertility differentials by rural–urban place of residence with a stronger influence on rural fertility. The effect of women’s education, age at marriage and contraception on urban fertility was much lower than on rural fertility. Nevertheless, the recent fertility decline in India in the absence of increased contraceptive use calls for further investigation (Mohanty et al., Reference Mohanty, Fink, Chauhan and Canning2016). The negative association between under-five mortality and fertility in urban West Bengal could be partially explained by its low under-five mortality (16) (IIPS & ICF, 2017). However, the negative association between poor population and Muslim population levels with fertility needs further investigation. It can be said that urban fertility decline in West Bengal needs special attention and further investigation as these factors fail to decipher the 50% variation in fertility decline in urban West Bengal.
The study has its limitations. Census and survey data can be subject to recall bias and socially desirable answers. Also, the rural and urban child mortality rates were computed using the Brass method, which might overestimate the number of births if mortality continued to be as high for children aged 5–6 years as that of the under-5 age groups. Also, the analyses were based on a low number of cases owing to the small number of districts in West Bengal.
The present situation in West Bengal, especially that of urban West Bengal, resembles that of the fertility situations in developed countries. There are ongoing debates whether declining fertility patterns will show a reverse direction in developed countries relying on pro-natalist policies or through immigration to solve the issues of de-population. Adequate and pertinent initiatives must be taken by the Government of India to understand the fertility decline in the state, putting aside the historical factors affecting fertility. Likewise, it must strive to make every effort to understand why women in most districts of West Bengal are failing to attain their desired number of children.
Author ORCIDs
Sayantani Chatterjee 0000-0002-0732-5102
Acknowledgments
A previous version of this manuscript was presented at the 28th International Population Conference 2017 of International Union for the Scientific Study of Population (IUSSP), Cape Town, South Africa. The author would like to thank the reviewer for his/her comments, which helped to improve the overall quality of the manuscript.
Funding
This research received no specific grant from any funding agency, commercial entity or not-for-profit organization.
Conflicts of Interest
The author has no conflicts of interest to declare.
Ethical Approval
The analysis described in this paper was performed using secondary data obtained from publicly available sources.


