

Introduction
The Chinese classics say ‘Guo zhi da shi, zai si yu rong (国之大事, 在祀与戎)’, meaning that both worship and the military were critical for ancient leaders. Sacrifices (mainly animals) were burned in burial rituals and in the worship of the cosmos, the gods and the ancestors. Oracle bone inscriptions of the Shang Dynasty (1600–1046 BC) have recorded these as ‘Liao sacrifices’. The scripts also frequently record that jade was used by the Shang Dynasty in Liao sacrifices (Yu & Fang Reference Yu and Fang2014: 22–23).
Although Liao sacrifice involving jade was first documented during the Shang Dynasty, it must have had earlier origins. Chinese archaeologists have found jade artefacts with possible traces of burning from several Neolithic sites. Some may have been used in funerary rituals or worship, such as those unearthed from the Songze Culture (4100–3300 BC) Fuquanshan site in Shanghai (Nanjing Museum 1984; The CPAM of Shanghai 2000). Here, a Liao sacrifice site has been found next to tombs. A jade bead was also unearthed from tomb M94, which was filled with sintered soil and ashes (The CPAM of Shanghai 2000: 18, 21, 49, 134). Such sacrificial activities at this site continued until the Liangzhu Culture (3300–2100 BC), as evidenced by the burning of the altar and ground. The four sides and base of tomb M136 also exhibited burn marks, and fragments of four jade artefacts all displayed fine surface cracks and evidence of burning (The CPAM of Shanghai 2000: 58, 64, 66, 67, 79; Huang Reference Huang2005). Burnt Liangzhu Culture jade artefacts from tomb M3 at the Sidun site in Jiangsu Province were assumed to be important proof of “jade sacrifice” (Nanjing Museum 1984: 113–14), although this interpretation is controversial due to a lack of scientific evidence; some scholars argue that these ‘burn’ marks were caused by post-depositional weathering (Nanjing Museum 1991: 103; Fang Reference Fang2014: 180).
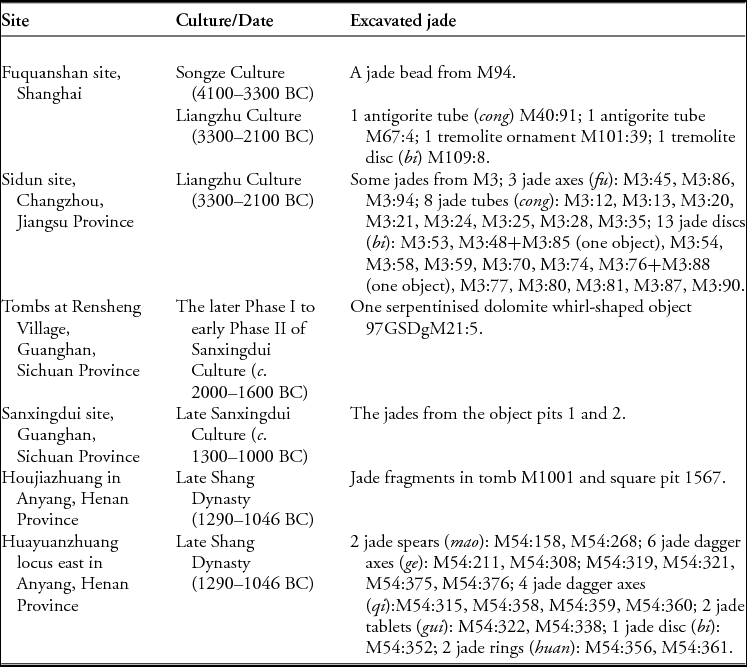
Similar phenomena are known for sites and tombs of the pre-Qin period (before 221 BC), including Xia (2070–1600 BC) and Shang Dynasty (1600–1046 BC). Tomb M1001 at Houjiazhuang (1290–1046 BC) in Anyang, for example, yielded burnt carbon layers mingled with jade fragments, possibly suggestive of Liao sacrifice (Deng Reference Deng and Guo2012: 189). Other examples include burnt jade artefacts from tomb M54 at Huayuanzhuang locus east (1290–1046 BC) in Anyang and Rensheng Village in Sichuan Province (c. 2000–1600 BC), as well as other areas that were beyond the direct control of Xia and the Shang Dynasty (Jin et al. Reference Jin, Xu, He and Tang2007: 375–76; Yu & Fang Reference Yu and Fang2014: 119). At the Sanxingdui site (c. 1300–1000 BC), many artefacts, including jade wares, were burned at a high temperature (The CPAM of Sichuan et al. 1987, 1989). While some scholars argue that this represents evidence for large-scale and grand Liao sacrifice, others believe that the artefacts were burned and buried by those invaders after this area was conquered (Shi Reference Shi2004). Table 1 summarises suspected cases of jade associated with the Liao sacrifice.
Table 1. Excavated jade with suspected heating traces before Shang in China.
Suspected evidence for jade-artefact burning varies by site. At Fuquanshan, Sidun and Rensheng Village sites, for example, such evidence is confined to fine surface cracks and blackish-grey colouring on jade artefacts, whereas the Yinxu site provides indirect evidence of burning in the form of jade fragments mixed within carbon layers. Some of the tremolite jade at the Yinxu site was opaque and yellowish-brown or greyish-white in colour; it is clearly different from modern jade. Previous mineralogical analysis of Sidun artefacts led Zheng (Reference Zheng1996) to argue that suspected ‘burning’ is actually the result of natural weathering processes. Hence, there is insufficient evidence to confirm that the ancient Chinese societies burned jade in Liao sacrifices.
To address this issue, a research team from Fudan University and the Institute of Archaeology at the Chinese Academy of Social Sciences undertook non-destructive analyses on 91 jade objects excavated from the tomb of Fu Hao (Figure 1), the wife of King Wu Ding (1250–1192 BC), at the Yinxu site. This is one of the best-preserved Shang Dynasty tombs in Anyang (Henan Province) and probably dates to slightly before 1200 BC. 1928 pieces of objects were recovered, including bronzewares, jade, jewellery and ivory. Inscribed bronze, jade and stone artefacts provide important details for researchers of the Shang Dynasty.
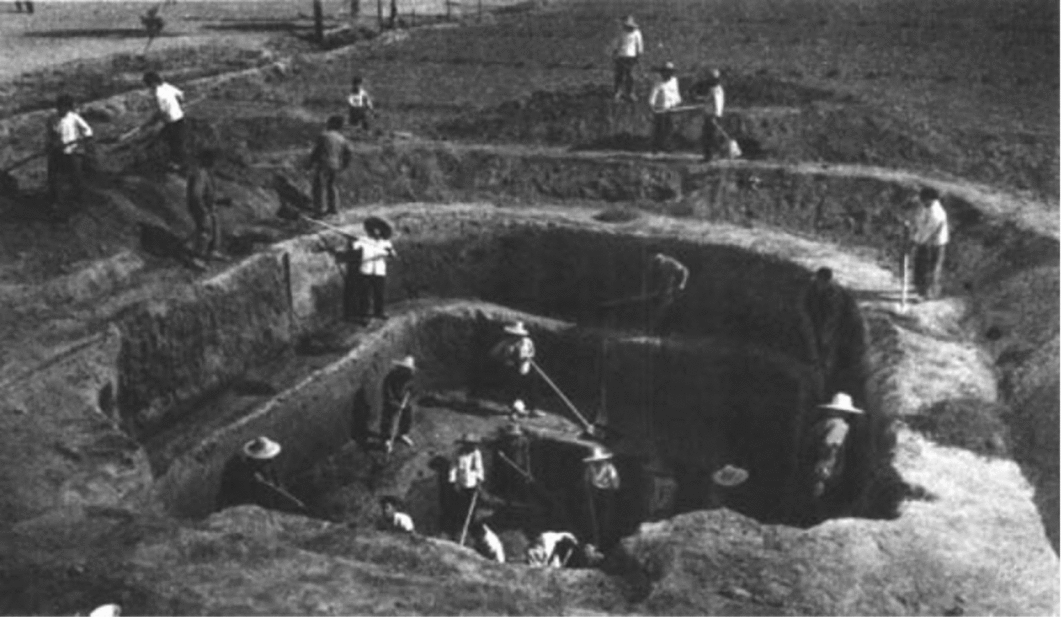
Figure 1. Excavation at the tomb of Fu Hao (Institute of Archaeology 1980: pl. Ⅱ).
Our research demonstrated that more than 20 fragments of jade were heated. Two among these—a jade parrot (1976AXT-M5:993) and a jade dagger-axe (1976AXT-M5:445)—provide direct evidence of heating in the form of areas of phase transition.
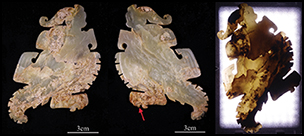
The jade parrot sample
The jade parrot (Figure 2) was recovered from the tomb in 1976. It is light green in colour and slightly transparent. The object's texture is dense and cryptocrystalline, and there are multiple open cracks inside. The brownish-yellow areas are lump- or band-shaped, with some situated around the fractures. The yellowish-white areas are sheet-shaped. To evaluate its transparency, the sample was irradiated from one side with a LED light at a colour temperature of 5600K. As expected, the brownish-yellow and the yellowish-white areas had low transparency, while the light green areas had high transparency.
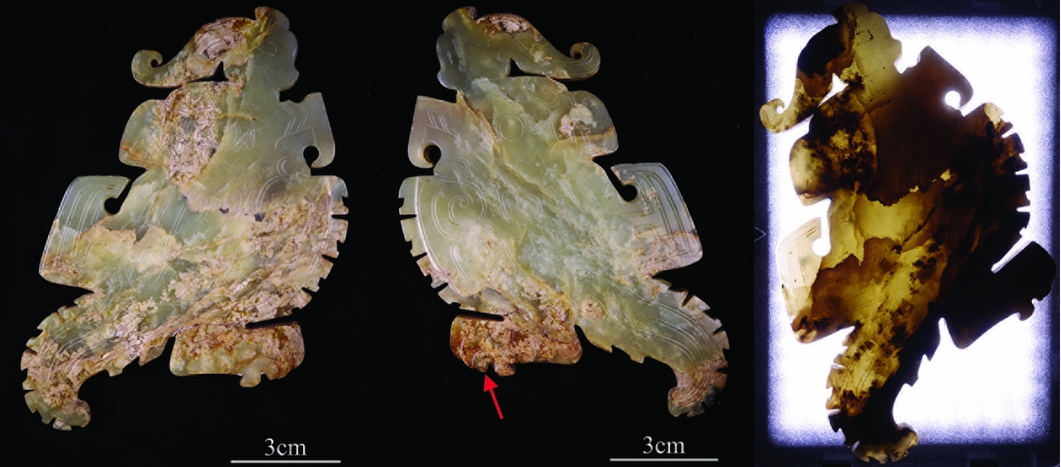
Figure 2. Two sides of the jade parrot 1976AXT-M5:993 (left and middle) and its image under transmitted light (right).
Research methods
A portable CM-2300d integrating sphere spectrophotometer (Konica Minolta) was used to measure the Lab value and the relative gloss of the jade parrot. (Lab value is a quantitative and objective representation of colour.) Lab colour space consists of lightness (L) and the a and b value of relevant colour. L is the colour lightness and ranges from 0–100; a represents the position between red and green (red when at +120, green when at −120), while b is between yellow and blue (yellow when at +120, blue at −120); the a and b both range between +120 and −120.
A XploRA Raman Spectrometer (Horiba Jobin Yvon), with a 785nm excitation light source and 50× objective lens, was used to study the phase of the jade, as was a IS50 Nicolet Fourier Transform Infrared Spectrometer (Thermo Nicolet). The portable Tracer III-SD X-ray fluorescence spectrometer (Bruker) can be connected to portable vacuum devices, which ensure that weak signals transmitted by elements such as magnesium (Mg) and aluminium (Al) would not be absorbed by the air. Voltage for the experiments was 15kV and the electric current was 25µA. The Quanta 650 scanning electron microscope (SEM) (FEI) has a chamber of sufficient size for non-destructively observing the microstructure and analysing the element content of larger artefacts. External contamination on test areas that may have adversely affected microscopic analysis was removed by cleaning with alcohol. All experiments were conducted at the Institute of Archaeology, Chinese Academy of Social Sciences.
Results and analysis
Analysis on colour and glossiness
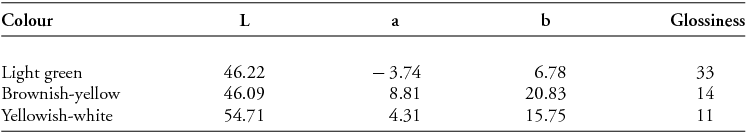
Figure 3 shows an enlarged view of the area indicated by the arrow on the middle of Figure 2. As shown in Table 2, from the light green area on the sample to the brownish-yellow and then to the yellowish-white area, the value of a turns to a red tone and the value of b turns to a yellow tone, respectively; the glossiness reduces, while the value of L of the yellowish-white area increases. Comparing the yellowish-white area with the brownish-yellow area, the value of L apparently increases, while the value of a and b, as well as the glossiness, all decrease.

Figure 3. The enlarged view of the area indicated by the arrow on the second image in Figure 2.
Table 2. The value of Lab and glossiness of the sample (1976AXT-M5:993).
Raman spectra analysis
Figure 4 shows the black Raman spectrum for the light green area of the parrot. The peaks at 1062cm−1 and 1031cm−1 reflect the anti-symmetric stretching vibration of Si-O-Si; the peak at 932cm−1 demonstrates the symmetric stretching vibration of O-Si-O; and the peak at 676cm−1 shows the symmetric stretching vibration of Si-O-Si (Rinaudo et al. Reference Rinaudo, Belluso and Gastaldi2004). For the shifts shorter than 676cm−1, the peaks at 438cm−1, 417cm−1, 396cm−1, 371cm−1 and 351cm−1 are related with the vibration of M-OH (M = Ca, Mg, Fe); while the peaks at 252cm−1, 225cm−1, 180cm−1, 161cm−1 and 123cm−1 are probably caused by the crystal lattice vibration (Zhao et al. Reference Zhao, Li, Liu, Hu and Gan2014). Hence, the mineral composition of the light green area is consistent with nephrite, a variety of the tremolite-actinolite series of amphiboles (Ca2(Mg, Fe2+)5Si8O22(OH)2).
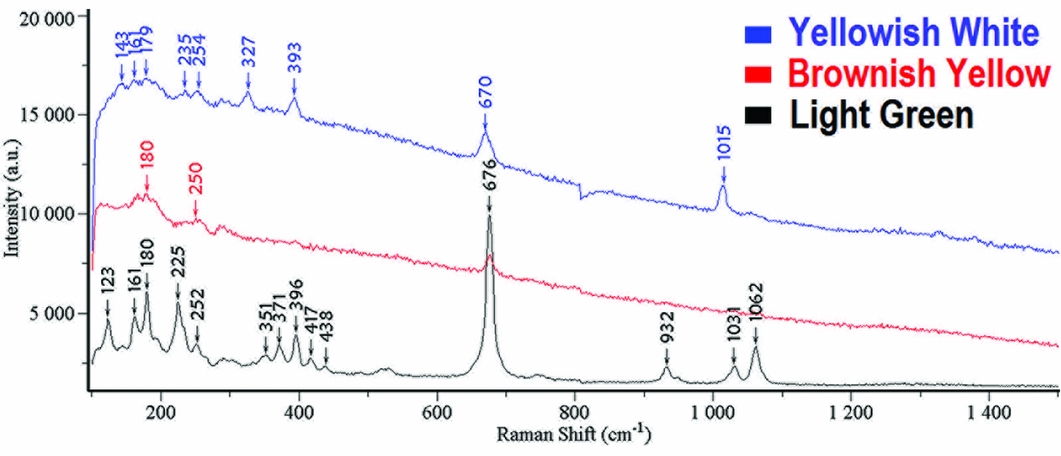
Figure 4. Raman spectra for areas with different colours on the sample (1976AXT-M5:993).
The spectrum for the brownish-yellow area only demonstrates Raman peaks at 676cm−1, 250cm−1 and 180cm−1, which indicates a mineral composition consistent with nephrite (tremolite-actinolite). Its crystal structure, however, has already been destroyed.
For the yellowish-white area, the peaks at 143cm−1 and 235cm−1 are related to the inclination of silicon tetrahedron. The peak at 179cm−1 is due to the vibration of Ca-O, while the peak at 254cm−1 is consistent with the vibration of calcium (Ca) and magnesium (Mg) (Prencipe et al. Reference Prencipe, Mantovani, Tribaudino, Bersani and Lottici2012). The peak at 327cm−1 originates from the stretching vibration of M-O, and the deformation vibration of M-O (M = Ca, Mg, Fe) forms the peak at 393cm−1. Additionally, the peak at 670cm−1 probably results from the symmetric bending vibration of Si-O-Si, while the peak at 1015cm−1 reflects the symmetric stretching vibration of Si-O (Wang & Zhang Reference Wang and Zhang2010). These analyses show the yellowish-white area is diopside (Ca(Mg, Fe2+)Si2O6).
Infrared spectra analysis
Figure 5 shows the infrared spectra for the artefact, and Table 3 demonstrates the spectral bands for areas of different colour, as well as their assignments (Wang et al. Reference Wang, Xu, Sun and Cao2009). It is clear that the spectra for the light green area and the brownish-yellow area are quite similar (Figure 5). This supports the conclusion that both areas comprise nephrite (tremolite-actinolite). There are two spectra for the artefact's yellowish-white area. Peaks between 1200cm−1 and 400cm−1 in the red spectrum (Figure 5) match the standard spectrum of diopside (Peng & Liu Reference Peng and Liu1982: 355). Peaks in the purple spectrum at 1070cm−1, 963cm−1 and 673cm−1 are also characteristic of diopside. The peaks at 1040cm−1, 996cm−1, 918cm−1 and 757cm−1 are, however, distinctive of nephrite (tremolite-actinolite), while those at 686cm−1, 638cm−1, 543m−1, 510cm−1 and 413cm−1 fall in between diopside and nephrite (tremolite-actinolite). This area therefore contains two phases: nephrite and diopside. The diopside (Ca(Mg, Fe2+)Si2O6) is the result of phase transition of nephrite (Ca2(Mg, Fe2+)5Si8O22(OH)2). This is discussed later.
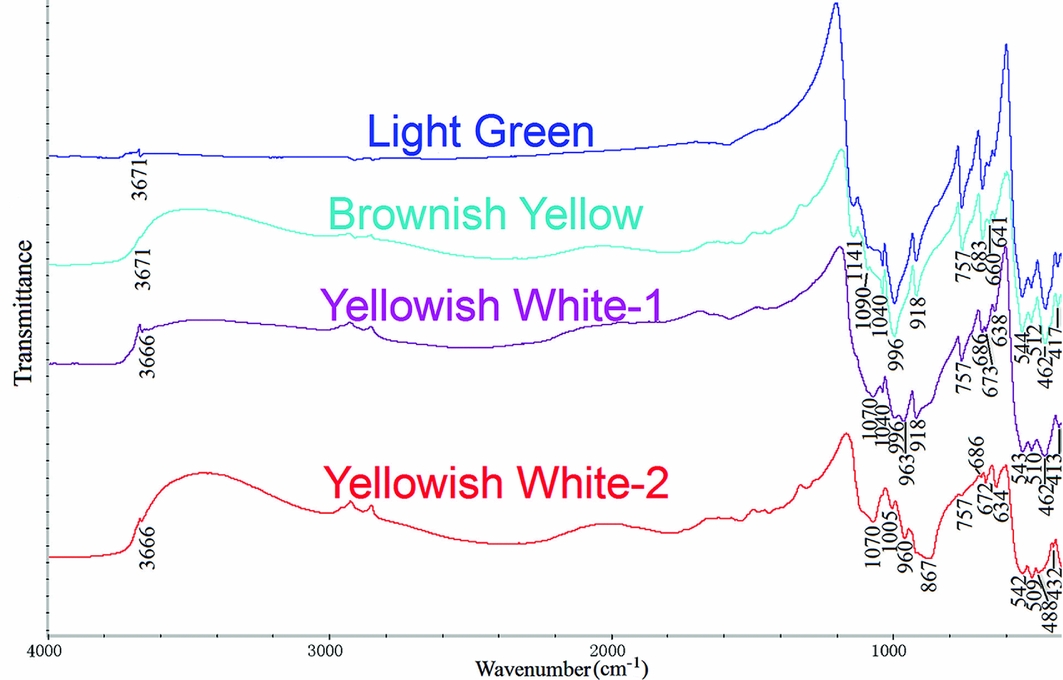
Figure 5. Infrared spectra for areas with different colours on the sample.
Table 3. Infrared spectra bands and assignments of areas with different colours on sample (νs = symmetric stretching vibration; νas = anti-symmetric stretching vibration; δ = bending vibration).

X-ray fluorescence (XRF) spectra analysis
The XRF spectra for the sample is shown in Figure 6. The blue line is for the yellowish-white area, while the red line is for the light green nephrite (tremolite-actinolite). Based on the standard spectrum of nephrite (tremolite-actinolite), the semi-quantitative composition of this nephrite is: CaO, 11.59 per cent; MgO, 23.51 per cent; SiO2, 61.34 per cent; and FeO, 1.2 per cent. It shows that the light green area is low-iron tremolite (Ca2Mg5Si8O22(OH)2). As there is no standard curve of diopside, the semi-quantitative composition for that part of the sample is unknown. The theoretical value can, however, be calculated as: CaO, 25.9 per cent; MgO, 18.5 per cent; and SiO2, 55.6 per cent. Nevertheless, qualitative analysis of the fluorescence peaks (Figure 6) clearly shows that the peak intensity for Ca in the yellowish-white area is relatively higher than that in the light green area, while the peak intensity for silicon and magnesium is lower. In comparison with tremolite, the quantity of Ca in diopside is higher, and the quantity of magnesium and silicon is lower. It demonstrates that the phase transition of the yellowish-white area does actually lead to the changes in the content of calcium, magnesium and silicon.
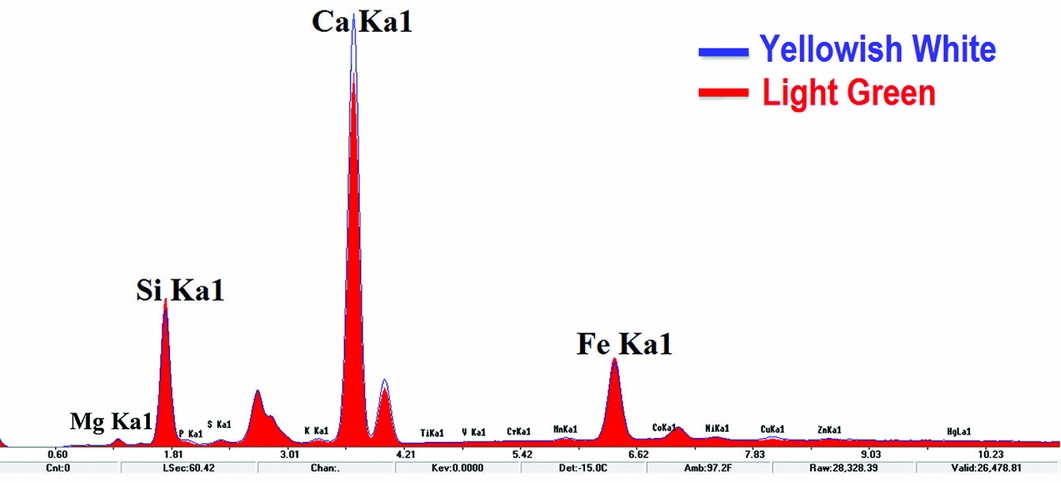
Figure 6. X-ray fluorescence spectra for areas with different colours on the sample.
SEM analysis
Figure 7 displays the micromorphology of the yellowish-white area. Although much of this area discharged under the scanning electron microscope, short fibre crystals were still visible on the undischarged area. That crystals and their interstices were observed under 600× magnification demonstrates that the structure of this area was already loose. The ratio of atoms for diopside CaMgSi2O6 is calculated as Ca:Mg:Si = 1:1:2, while the ratio for tremolite Ca2Mg5Si8O22(OH) is Ca:Mg:Si = 1:2.5:4. From the data on Figure 7, it can be calculated that the ratio of atoms for the yellowish-white area is Ca:Mg:Si = 1:1.86:3.47. This falls between diopside and tremolite, which implies that the artefact contains these two phases. This is identical to the results of infrared spectra analysis (see Figure 5) and XRF qualitative analysis (see Figure 6).
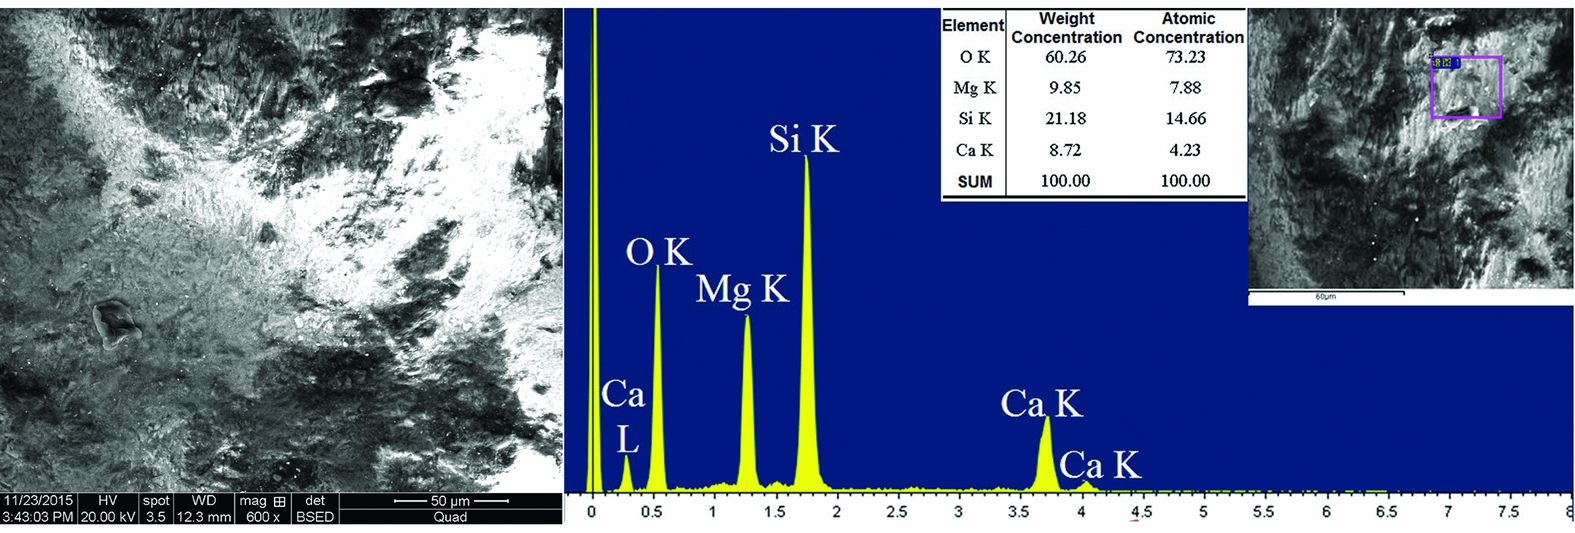
Figure 7. The micro morphology and EXD content analysis of the yellowish-white area on the sample.
Discussion
The origin of the diopside and the heating temperature
Wang (Reference Wang2011) argues that although the structure of nephrite (tremolite-actinolite) would loosen due to weathering and whitening, the mineral composition itself would not change. The research presented here demonstrates that even though the transparency of the yellowish-white area on the jade parrot sample is low and its structure is loose, part of its material has already transformed to diopside. This should not be caused by weathering. Generally speaking, the longer the wavelength in the molecular spectrum, the deeper it would penetrate (Ke & Gong Reference Ke and Gong2011: 203–205). The penetration of infrared spectra is deeper than that of the Raman spectra. Here, Raman spectra show that the surface of the yellowish-white area is diopside, while the infrared spectra suggest it is both diopside and tremolite. The interior of the sample was less heated than the outer, which means that the phase transition from tremolite to diopside becomes weaker from the surface inward. The diopside existed exclusively over the surface area exposed to higher temperatures on the jade parrot and dagger-axe. Such distribution shows the diopside could only have resulted from heating. The reaction equation for the transformation of heated tremolite to diopside is as follows (Deer et al. Reference Deer, Howie and Zussman1997):
 $$\begin{eqnarray}
&& {\rm C{a_2}}{\rm M{g_5}}{\rm S{i_8}{O_{22}}}{\left( {\rm {OH}} \right)_2}\left( {{\rm{tremolite}}} \right) + {\rm{ heat }} = {\rm{ }}{\rm 2CaMgS{i_2}{O_6}}\left( {{\rm{diopside}}} \right){\rm{ }} \nonumber\\
&& \quad +\, {\rm{ 3MgSi{O_3}}}\left( {{\rm{enstatite}}} \right) + {\rm{ Si{O_2}}}\left( {{\rm{cristobalite}}} \right) + {\rm{ {H_2}O}}\left( {{\rm{gas}}} \right)
\end{eqnarray}$$
$$\begin{eqnarray}
&& {\rm C{a_2}}{\rm M{g_5}}{\rm S{i_8}{O_{22}}}{\left( {\rm {OH}} \right)_2}\left( {{\rm{tremolite}}} \right) + {\rm{ heat }} = {\rm{ }}{\rm 2CaMgS{i_2}{O_6}}\left( {{\rm{diopside}}} \right){\rm{ }} \nonumber\\
&& \quad +\, {\rm{ 3MgSi{O_3}}}\left( {{\rm{enstatite}}} \right) + {\rm{ Si{O_2}}}\left( {{\rm{cristobalite}}} \right) + {\rm{ {H_2}O}}\left( {{\rm{gas}}} \right)
\end{eqnarray}$$
Scholars have studied the thermal transformation mechanism of nephrite (tremolite-actinolite) through infrared spectrum analysis, differential thermal analysis and X-ray diffraction analysis (as summarised in Table S1 in the online supplementary material (OSM)). We conclude that the phase transition of nephrite (tremolite-actinolite) would lead to the weakening of hydroxyl peaks, accompanied by the process of Fe2+ oxidising to Fe3+, and the amount of iron decreasing (Wang Reference Wang2017). Generally, the temperature for the initiation and end of the phase transition depends on the material being heated. Material with an increased iron content, for example, will require a lower temperature for phase transition completion. Secondly, it depends on the manner of heating. The longer the material is heated, the lower the temperature needed for phase transition. Infrared spectra from this research demonstrate that the complete disappearance of hydroxyl between the wavelength at 3600–3700cm−1 corresponded with the full phase transition of nephrite (tremolite-actinolite), while the change of fingerprint peaks between 1200cm−1 and 400cm−1 correlated with the early stage of phase transition. As shown in Table S1 in the OSM, phase transition always started at 700–900°C and was completed at 950–1200°C. The infrared spectrum for the yellowish-white diopside on the sample (see Figure 5, spectrum −2) still has the hydroxyl peak at 3666cm−1. The heating temperature for this part of the jade parrot was therefore between the starting and finishing points of phase transition. This temperature could be reached in an open fire without forced ventilation (Gillespie et al. Reference Gillespie, Jr and Abbott1989).
Colour change of heated nephrite (jade)
Table S1 in the OSM shows the colour change of nephrite (tremolite-actinolite) during heating. Belyankin and Donskaya (Reference Belyankin and Donskaya1939), Beck (Reference Beck, Leach and Davison1981), Zheng (Reference Zheng1996) and Douglas (Reference Douglas2001) all proved that nephrite (tremolite-actinolite) would darken or blacken at 300–500°C. Yu et al. (Reference Yu, Liu and Huang2006) and Zhang (Reference Zhang2011) argued that the appearance of green tremolite did not show a clear change, but microscopic analysis revealed that part of it had actually turned black; the darkening was possibly caused by the carbonisation of organic materials embedded in crevices, or by the oxidisation of Fe2+ to Fe3+.
Brownish-yellow materials were observed within the yellowish-white part of the jade parrot 1976AXT-M5:993. Raman spectra and infrared spectra showed this to be tremolite with a damaged structure, indicating that the heating temperature for this part of the sample did not reach the starting point of phase transition. When the heating temperature for nephrite (tremolite-actinolite) reaches the starting point of phase transition, the colour of heated areas will change accordingly. Experiments conducted by Tan et al. (Reference Tan, Qian, Lin, Tang and Yu1998), Yu and Tan (Reference Yu and Tan1998), Douglas (Reference Douglas2001), Jin et al. (Reference Jin, Xu, He and Tang2007) and Zhang (Reference Zhang2011) all demonstrated that low-iron tremolite would turn white or yellowish-white after full phase transition. Wen (Reference Wen1994) suggested that the colour of relatively high-iron tremolite would change from yellowish-green to brownish-black at 650°C, and into white at 950°C. Tan et al. (Reference Tan, Lee, Chen, Tien, Tsui and Yui1978) demonstrated that the Taiwan nephrite cat's eye (with a 3–3.5 per cent iron content) changed from yellowish-green to yellow at 700°C, and turned black and opaque at 860°C. As the heating process stopped at this temperature, the final colour is unknown. Yu et al. (Reference Yu, Liu and Huang2006) showed that green tremolite turned black at 850°C, and reddish-brown at 1050°C. These data demonstrate that the quantity of iron is probably an important factor in colour change during the heating process. This is supported by experiments on high-iron actinolite. Zheng (Reference Zheng1996), for example, showed that dark green actinolite turned brownish-black at 400–500°C, and reddish-brown at 1000°C. Jin et al. (Reference Jin, Xu, He and Tang2007) demonstrated that after heating, high-iron tremolite or actinolite firstly turned black, then faded to dark brown or dark yellowish-brown around 700°C, without evident change with further heating.
In summary, the colour change of tremolite and actinolite during the heating process is closely related to the quantity of iron. Low-iron tremolite tends to fade into a whitish tone, while high-iron tremolite and actinolite tends to fade into a brownish tone. The fading can be caused by the decrease in transparency, or by the vaporisation of carbonised materials. The mass quantity of iron for the jade parrot sample 1976AXT-M5:993 is 1.2 per cent (low-iron tremolite). When the object was placed in an open fire, even heating could not be guaranteed. The heating temperature for different regions was, therefore, variable. As a result, the regions with a higher temperature would fade into yellowish-white diopside, and those with a lower temperature would turn to brownish-yellow tremolite.
The purpose of heating jade
The prior discussion has demonstrated that the jade parrot from the tomb of Fu Hao at Yinxu was fire-heated. Both Beck (Reference Beck, Leach and Davison1981) and Jin et al. (Reference Jin, Xu, He and Tang2007) suggested that in antiquity jade was purposefully heated to achieve certain colours. Only small areas on the jade parrot's feet, head and tail, however, had turned yellowish-white or brownish-yellow. Although there is no rule concerning colour change, it can be assumed that heating of the parrot was not carried out to achieve a certain colour. Thus, sacrifice seems the most probable reason for heating the parrot. The Chinese character Liao is written as ![]() in the oracle bone script, which resembles burning something over firewood (He Reference He2007: 186). Records 11006, 14735, 15058, 32420, 32535, 32721 and 32657 of the Oracle bone scripts collection (Hu Reference Hu1999) all state that jade and animals (sheep and cattle) were used for Liao sacrifice; other such scripts have also documented that Lady Fu Hao was often in charge of worship. Chinese bronze inscriptions provide many references concerning the use of jade in Liao sacrifice between the Western Zhou Dynasty (1046–771 BC) and the Eastern Zhou Dynasty (770--221 BC). Examples are found in poetry from the sixth to eleventh centuries BC (e.g. Shi Jing: Da Ya Yun Han), third-century BC annotation (e.g. Lüshi Chunqiu: almanac for the last month of winter) and from first- to second-century AD notes on rituals (e.g. Rites of Zhou: offices of spring and Gongyang Zhuan: 31st year of King Xi).
in the oracle bone script, which resembles burning something over firewood (He Reference He2007: 186). Records 11006, 14735, 15058, 32420, 32535, 32721 and 32657 of the Oracle bone scripts collection (Hu Reference Hu1999) all state that jade and animals (sheep and cattle) were used for Liao sacrifice; other such scripts have also documented that Lady Fu Hao was often in charge of worship. Chinese bronze inscriptions provide many references concerning the use of jade in Liao sacrifice between the Western Zhou Dynasty (1046–771 BC) and the Eastern Zhou Dynasty (770--221 BC). Examples are found in poetry from the sixth to eleventh centuries BC (e.g. Shi Jing: Da Ya Yun Han), third-century BC annotation (e.g. Lüshi Chunqiu: almanac for the last month of winter) and from first- to second-century AD notes on rituals (e.g. Rites of Zhou: offices of spring and Gongyang Zhuan: 31st year of King Xi).
During the Zhou Dynasty, worship using Liao sacrifice involved burning livestock and jade over wood to make a smoke offering to the heavens, gods and ancestors. Even though such rituals are recorded in Zhou classics, they are thought to be inherited from previous worship rituals. The previous discussion has demonstrated that some jade objects from the tomb of Fu Hao were used for Liao sacrifice. Unfortunately, all the coffins and burial objects had been flooded after the tomb was constructed, so the exact burial location for the majority of jade objects is unknown—only their general position can be identified (Institute of Archaeology 1980: 9).
There was no visible trace of sintering soil or charcoal ashes in the tomb chamber. Additionally, around 50 pieces of ritual bronzewares had textile fragments attached (Institute of Archaeology 1980: 17). The tomb did not, therefore, experience large-scale fire after it was buried. Thus, the jade parrot had already been heated before the burial. The Erya: explaining heaven (尔雅·释天), which was completed during the Warring States period, notes that ‘heaven worship is burning, while earth worship is burying’ (translated by authors). The Western Han period Book of rites: the law of sacrifices (礼记·祭法) records that ‘with a blazing pile of wood on the Grand altar they sacrificed to Heaven; by burying stuff in the Grand mound, they sacrificed to the Earth’ (translated by authors). These records clearly show that Liao sacrifice was usually followed by burial sacrifice (He Reference He2007: 188). The jade parrot as Liao sacrifice was either for the burial ritual of the Fu Hao tomb, or for other worship during the life of Lady Fu Hao. Determining when the Liao sacrifice happened, either before or during the burial rituals, requires further exploration.
Conclusion
The sample used in this research (the jade parrot) was recovered from the tomb of Fu Hao at Yinxu. It comprises light green tremolite with a 1.2 per cent iron content. The yellowish-white area is diopside, with the quantity of iron decreasing inwards from the outside; this area results from the phase transition of tremolite due to heating. The brownish-yellow area is still tremolite, but its structure was destroyed by heating. Analyses show that along with the increase of heating temperature, the colour of jade changed from light green to brownish-yellow, and then lightened to yellowish-white. This transition is identical to that observed in experimentally simulated heating of low-iron tremolite. This proves that part of this jade parrot was heated in antiquity.
Among the 91 pieces of jade tested during this research, only the jade parrot and jade dagger-axe (1976AXT-M5:445) display the yellowish-white areas resulting from the phase transition from tremolite to diopside. The yellowish-white areas on the majority of the samples (>20 pieces) are still tremolite, but with many open cracks inside; these were heated, but the temperature did not reach the starting point of phase transition.
The burning of jade as an important part of ancient rituals is clearly documented in oracle bone inscriptions, bronze inscriptions and other Chinese classics. Such records concerning jade as Liao sacrifices have, however, never been verified through scientific research. This paper provides the first scientific evidence confirming historical documentation, although further research is required to ascertain whether such Liao sacrifices with jade occurred as part of the Fu Hao tomb burial ritual.
Analysis of the archaeological finds from one of the most well-represented Shang tombs, given the scale of the tomb and the excavated objects—the tomb of Fu Hao—has confirmed the use of jade in Shang Dynasty Liao sacrifice. The jade artefacts (including the jade parrot) shown to have been used in Liao sacrifices include ritual vessels and ornaments; thus, the diversity of jade used as Liao sacrifices in the Shang Dynasty is demonstrated. A more thorough and comprehensive analysis of other jade objects from the Fu Hao tomb will be conducted to provide a better understanding of the Liao sacrifices throughout the Shang Dynasty.
Acknowledgements
This research is supported by the Key Project of National Natural Science Foundation of China (U1432243). Many thanks to Da Kong (Department of Cultural Heritage and Museology, Fudan University) for the much appreciated assistance with English-language editing. Further thanks go to Jinxia Wang and Xiaohong Ye (Institute of Archaeology, Chinese Academy of Social Sciences) for their generous help with the analytical equipment.
Supplementary material
To view supplementary material for this article, please visit https://doi.org/10.15184/aqy.2017.220


