

Introduction
Besides well-known seasonal cycles in suicide mortality, weekly cycles have also been investigated since the 19th century, i.e., since the very beginning of suicide research (Durkheim, Reference Durkheim2002/1897). Researchers seem to have intuitively supposed that the two phenomena have something in common. Notwithstanding this, weekly cycles in suicide have been less frequently investigated and interpreted, perhaps because they appeared to be less suitable for grand sociological theory focusing on anomie and integration or biopsychiatric hypotheses related to meteorological and hormonal cycles. Recently, research on suicide seasonality has taken a more pragmatic turn (Preti & Miotto, Reference Preti and Miotto1998; Ajdacic-Gross et al. Reference Ajdacic-Gross, Bopp, Ring, Gutzwiller and Rossler2010), which may also yield new opportunities in approaching the issue of weekly cycles.
The weekly distribution of suicides in Western countries (MacMahon, Reference MacMahon1983; Massing & Angermeyer, Reference Massing and Angermeyer1985; Maldonado & Kraus, Reference Maldonado and Kraus1991; Johnson et al. Reference Johnson, Brock, Griffiths and Rooney2005; Miller et al. Reference Miller, Furr-Holden, Lawrence and Weiss2012), but also in Japan (Ohtsu et al. Reference Ohtsu, Kokaze, Osaki, Kaneita, Shirasawa, Ito, Sekii, Kawamoto, Hashimoto and Ohida2009), where Sunday is the weekly day of rest, is characterised by lowest frequencies on weekends and highest on Mondays. This might be called the regular pattern of weekly cycles in suicide. Analogously, the distribution of suicide in Jewish population falls and peaks a day earlier, because of the Saturday Sabbath (Weinberg et al. Reference Weinberg, Lubin, Shmushkevich and Kaplan2002). Deviations from the regular pattern are rare – for example, a peak on Wednesday in US rates, 2000–2004 (Kposowa & D'Auria, Reference Kposowa and D'Auria2010) or no Monday excess in Olmsted County, 1951–1985 (Panser et al. Reference Panser, McAlpine, Wallrichs, Swanson, O'Fallon and Melton III1995) and in Irish men, 1990–1998 (Corcoran et al. Reference Corcoran, Reilly, Salim, Brennan, Keeley and Perry2004) – which might be due to factors such as high rates of alcohol consumption on weekends.
The starting point of this study was to find deviations from the regular cyclical patterns. We pursued two tracks. First, we investigated weekly suicide distributions in Austrian and Swiss mortality data by dividing the data with respect to socio-demographic and suicide characteristics in order to find aberrant subgroups. Second, we examined the effect of disturbances in the temporal patterns evoked by holidays such as Easter and Pentecost by means of time series analysis (Ajdacic-Gross et al. Reference Ajdacic-Gross, Lauber, Bopp, Eich, Gostynski, Gutzwiller, Burns and Rössler2008, Reference Ajdacic-Gross, Knopfli, Landolt, Gostynski, Engelter, Lyrer, Gutzwiller and Rossler2012). It is well known that suicides tend to decrease on holidays and may display an intermediate peak thereafter (Jessen & Jensen, Reference Jessen and Jensen1999; Jessen et al. Reference Jessen, Jensen, Arensman, Bille-Brahe, Crepet, De Leo, Hawton, Haring, Hjelmeland, Michel, Ostamo, Salander-Renberg, Schmidtke, Temesvary and Wasserman1999b ; Bradvik & Berglund, Reference Bradvik and Berglund2003), so that holidays interfere with the weekly cycles if they fall on or include Mondays. Therefore, Easter and Pentecost/Whit attract particular attention.
Methods
The population of Austria is predominantly Catholic (median 82.6%) (Kapusta, Reference Kapusta2012), the political and economic centre of the country is the capital, Vienna. In contrast, the population in Switzerland is fairly equally divided into Catholics, Protestants and persons with other/no affiliation. Two major and two minor regions are defined by the dominating language and cultural background (German, French, Italian, Rumantsch). There are several centres, notably with a Protestant background.
The meaning and relevance of Easter and Pentecost/Whit is similar in both Catholic and Protestant contexts, except for Good Friday. This is an important day among Protestants; however, it is not a holiday in all Catholic regions. Furthermore, both Easter and Pentecost involve Saturdays, Sundays and Mondays.
For this study, we used data from the Swiss and Austrian mortality statistics for the periods 1969–2010 and 1970–2010, respectively. Both countries, Austria and Switzerland, which have traditionally had high suicide rates, have experienced a decrease in suicide rates since the mid-1980s, but still rank in the upper half in related lists of the OECD or European countries (Kapusta, Reference Kapusta2012).
The Austrian suicide mortality data were obtained from Statistics Austria for the period 1970 to 2010. Data on suicide have been registered electronically since 1970 and coded according to external cause-of-death ICD-8 and -9 codes E950–E959 and ICD-10 codes X60–X84. The reliability and validity of the Austrian suicide statistics is high in comparison to other countries, especially due to the infrequent use of the ‘unknown’ and ‘undetermined’ cause of death categories and high national autopsy rates (Rockett & Thomas, Reference Rockett and Thomas1999; Kapusta et al. Reference Kapusta, Tran, Rockett, De Leo, Naylor, Niederkrotenthaler, Voracek, Etzersdorfer and Sonneck2011; Rockett et al. Reference Rockett, Regier, Kapusta, Coben, Miller, Hanzlick, Todd, Sattin, Kennedy, Kleinig and Smith2012; Koger, Reference Koger2013). In uncertain cases where death certificates are incompletely filled out or contradictory, further investigations by coding officials of Statistics Austria are done. If the mode of death remains unclear (accident, murder or suicide) during death ascertainment, a police commission has to be involved and a forensic autopsy might be requested by medical examiners. In hospital-related deaths clinical autopsies are performed (Koger, Reference Koger2013). The autopsy rate in Austria has traditionally been high. In the meanwhile, the autopsy rate declined from a mean of 31.2% in decade 1988–1997 to 23.3% in 1998–2007 but still remains high in international comparison (Kapusta et al. Reference Kapusta, Tran, Rockett, De Leo, Naylor, Niederkrotenthaler, Voracek, Etzersdorfer and Sonneck2011).
In Switzerland, data on suicide mortality have been gathered since 1876, when standardised registration for cause of death was introduced (Minder & Zingg, Reference Minder and Zingg1989). Since 1969 the data have been available on the level of individual records thus enabling more detailed analyses. Switzerland used the ICD-8 coding system until 1994, and then switched to ICD-10 coding in 1995. A specific code denominating assisted suicides, which, in contrast to Austria, are legal in Switzerland, was introduced in 1998, thus enabling us to exclude these cases from the analysis. Given that suicides figure among violent deaths, all suicides are assessed by the police. The proportion of autopsies was 28.7% in the years following 2000, after omitting assisted suicides.
Initial descriptive analyses were based on cross-tabulations of suicide frequencies across socio-demographic variables (sex, age and religious affiliation), suicide methods and the period of death. The results were displayed by standardised frequencies in order to facilitate the inspection of cyclical patterns. In the related figures, the mean of a weekly series is represented by the index value of 100, so that the daily frequencies of the series can be read as percentage above/below the mean.
Time series analyses focusing on the Easter and Pentecost/Whit holidays relied on cumulated daily data. We used an approach similar to that used in a previous analysis of the Advent season (Ajdacic-Gross et al. Reference Ajdacic-Gross, Lauber, Bopp, Eich, Gostynski, Gutzwiller, Burns and Rössler2008), except that the variability of the Easter and Pentecost date had to be accounted for in each year. We included a period of 109 antecedent days before and 10 days after Pentecost (60 days before and 59 after Easter), thus resulting in a time series of 120 days. For the sake of simplicity, February 29 was excluded from the analyses.
The time series were analysed with the Box–Jenkins modelling approach which is also known as Autoregressive Integrated Moving Average – ARIMA modelling (Box & Jenkins, Reference Box and Jenkins1970). ARIMA has superseded the classical decomposition model in time series analysis for some time. It promises a greater rigidity in statistical terms, but equally a greater flexibility in analysis design.
Instead of trends, cycles and seasonal effects such as in classical time series analysis, a basic ARIMA (p,d,q) model examines auto-regressive AR(p) processes, moving-average MA(q) processes, and, for the purpose of detrending, also differencing terms (d). In simple terms, AR-processes represent slow dynamics, whereas MA-processes represent shocks in a time series. Differencing may include not only detrending but also extraction of seasonal effects, then resulting in a seasonal ARIMA (SARIMA) model. In this analysis, this was a 7 days SARIMA model in order to deal with weekly cycles (see also Gottman, Reference Gottman1981) or Diggle (Reference Diggle1990).
The formalistic aim in ARIMA is the same as in classical time series decomposition: to determine the best fitting model. The benchmark of ARIMA models is to leave residuals which are white noise (‘prewhitening’). Mostly, the AR- and MA-components lack specific meaning and merely serve to prepare further applications such as multivariate models (e.g., correlational analyses of residual (‘prewhitened’) series or regression analyses) or intervention models (so called interrupted time series or transfer function models). The latter account for pulses and shifts (steps) in the series (Helfenstein, Reference Helfenstein1991). In this analysis, we used intervention models to examine pulses in the suicide series due to holiday effects.
The concrete procedure was first to examine basic ARIMA models based on correlograms and partial correlograms. The adequacy of the models was assessed by the Ljung–Box Q-test. Besides, the Akaike's information criterion (AIC) values were also considered as an option to choose one model among two or more well-working alternatives (Schmitz, Reference Schmitz1989). Preliminary assessment of intervention models was carried out by implementing dummy variables, representing the days around holidays as pulses. The analysis steps in identification of an intervention model followed the procedure described by Helfenstein (Reference Helfenstein1996).
The analyses were carried out with Statistical Analysis System (SAS, Version 9.2).
Results
In the overall analysis, 70 275 suicides in Austria and 56 819 suicides in Switzerland were included. The weekly distribution was similar in the two countries with Mondays displaying the highest frequencies, followed by a successive decline and lowest frequencies on Saturdays and Sundays (Fig. 1). Men showed a larger range than women, in particular Swiss men.

Fig. 1. Weekly distribution of suicides in Austria (thick lines) and Switzerland (thin lines), males (dark lines) and females (grey lines); standardised values (index = 100).
Comparisons by age indicated a similar pattern in all age groups except for the young. Figure 2 shows that suicides in persons below the age of 30 also frequently occurred on Sundays, both in Austria and in Switzerland. This effect was again more pronounced in men than in women.
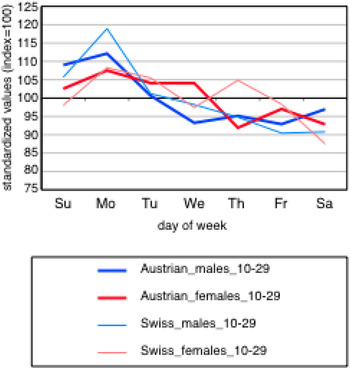
Fig. 2. Weekly distribution of suicides in Austria (thick lines) and Switzerland (thin lines) among young people (age <30 years), males (dark lines) and females (grey lines); standardised values (index = 100).
Religious affiliation made a particular difference among Jews (pooled N = 231), where we found lower frequencies in the second half of the week, notably a nearly 50% decrease against the mean on Fridays and a return to normal levels on Sundays. In Muslims (pooled N = 609), Saturdays showed the lowest frequencies and there was no backlog effect on Mondays (results not shown). These results should be interpreted with caution because of low numbers.
Most suicide methods, in particular frequent ones such as hanging, firearms suicides or railway suicides, showed patterns similar to those in the overall analysis. Deviations (results not shown) occurred notably in:
-
• drowning, where Sundays approach frequencies similar to other days of the week (both sexes in Austria and men in Switzerland);
-
• car exhaust (no dip at weekends, both sexes in Austria);
-
• jumping from a height (smooth curves, both in Austria and in Switzerland).
In ARIMA analyses, all time series were differenced by lag 7 in order to extract preliminarily the weekly cycles inherent in the series (see example in Fig. 3). No further differencing and no smoothing of the series were necessary. The AR- and MA-parameters varied slightly between the series (Table 1).

Fig. 3. Illustrative example of cumulated daily frequencies of suicides in Austria (dark line) and Switzerland (grey line) covering Easter and Pentecost; vertical lines represent Easter and Pentecost Sunday, respectively.
Table 1. Results of ARIMA/SARIMA models: cumulated daily suicide frequencies, 1969/70–2010, by subgroup

*p < 0.05, **p < 0.01, ***p < 0.001.
aThe terms in the first parentheses represent the parameters of the ARIMA model (AR, differencing, MA) and the terms in the second parentheses are the analogous parameters of SARIMA, the seasonal ARIMA model. The SARIMA model was based on lag 7.
bPulse (holidays) effects were introduced in the model by dummy variables. The parameters represent the number of deaths below/above the value, which was predicted by the baseline model. They compare to means of the Austrian series, which were 144.1 (men) and 58.1 (women), and to the means of the Swiss series 115.0 and 46.9, respectively.
The pulse effects in this analysis simply represented the number of deaths below/above the value predicted by the baseline model (see also notes of Table 1). The most pronounced effects concerned lower suicide frequencies on Pentecost Monday (all series except Swiss women). Also, Easter Monday among Austrian men, and Easter Saturday and Pentecost Sunday among Austrian women displayed remarkably lower frequencies. The departures from the predicted values extended to −37% (Pentecost Monday in Austrian women). No backlog effects occurred on Tuesdays after the holidays. More detailed analyses by religious affiliation using Swiss data – the proportions of Catholics and Protestants in Switzerland are similar, while Catholics predominate in Austria – showed that the decrease in suicides on Pentecost Monday was apparent only in Catholics.
Discussion
Weekly cycles in suicide – like seasonal cycles – have been described, replicated and poorly understood for a long time (Massing & Angermeyer, Reference Massing and Angermeyer1985). This study replicated the known weekly cycles based on data from two independent sources: Austria and Switzerland. A dip was found on weekends and an immediate peak on Mondays, followed by a successive decline. We also found a similar pattern among Jewish individuals, where the dip is advanced by one day because of the Saturday Sabbath (Weinberg et al. Reference Weinberg, Lubin, Shmushkevich and Kaplan2002).
Beyond the replication, we aimed to identify subgroups with specific weekly patterns. Interestingly, the cycles in men were more pronounced than those in women. Slight deviations from the regular pattern, i.e., a smoothed dip on weekends, involved car (exhaust) and outdoor suicide methods such as drowning and jumping, but also young persons, for whom Sundays completely lost their protective effect on suicide mortality. This goes against the finding that suicide attempts, which are mostly a phenomenon of youth, most frequently occur on Sundays (Jessen et al. Reference Jessen, Andersen, Arensman, Bille-Brahe, Crepet, De Leo, Hawton, Haring, Hjelmeland, Michel, Ostamo, Salander-Renberg, Schmidtke, Temesvary and Wasserman1999a ).
The second aim of the study was to determine how the weekly suicide pattern interacts with disturbances of the regular weekly rhythms due to extended holiday weekends (Easter and Pentecost). The ARIMA analyses showed that the backlog effect on Mondays mostly disappeared if a holiday fell on a Monday (Corcoran et al. Reference Corcoran, Reilly, Salim, Brennan, Keeley and Perry2004) and, in addition, no lagged backlog effect emerged on Tuesdays. Besides this, women in Austria showed an unexpected general decrease of in suicide frequencies during the holidays. Assuming that secular trends typically have more progressed in Protestants than in Catholics, one might conclude that the deviations from the regular weekly pattern are stronger in more traditional population groups, i.e., the stronger the people perceive a difference between holiday and normal weekends.
To summarise the findings we basically dealt with two different, although intertwined phenomena: the weekend dip effect and the Monday backlog effect. Recent improvements in the understanding of seasonal and other circannual effects in suicide are also helpful in understanding weekly cycles. The first template derives from suicide patterns during and after the Advent season (Bergen & Hawton, Reference Bergen and Hawton2007; Ajdacic-Gross et al. Reference Ajdacic-Gross, Lauber, Bopp, Eich, Gostynski, Gutzwiller, Burns and Rössler2008): there is a remarkable decrease in suicide frequencies during the Advent season followed by a partial backlog effect after New Year. The latter is apparent only in men, suggesting that this is not an inevitable sequel of the Advent dip. This is in line with the lacking backlog effects on the Tuesdays after Easter and Pentecost in this study. The core of this issue is that postponed suicides often turn into cancelled suicides, more so among women than among men. The decrease in suicides during the Advent season was basically explained by the more intense social contacts with relatives and friends, more ‘friendly’ meetings, and implicitly also more social control during Advent and the holidays (Ajdacic-Gross et al. Reference Ajdacic-Gross, Lauber, Bopp, Eich, Gostynski, Gutzwiller, Burns and Rössler2008). The same explanation also fits with the dip in weekend suicides.
However, the deviations of the weekly pattern found in specific suicide methods, point to an additional mechanism. Both suicide methods involved here – drowning and jumping – belong to the few methods connected with seasonal effects in suicide (Ajdacic-Gross et al. Reference Ajdacic-Gross, Wang, Bopp, Eich, Rossler and Gutzwiller2003, Reference Ajdacic-Gross, Bopp, Ring, Gutzwiller and Rossler2010). It has been argued that the availability of a method, in this instance the perceived availability of outdoor methods, is the main motive behind this finding. This may also be the key to understanding the smoothing of the weekend dips in these methods, since outdoor activities may be assumed to increase on weekends. Similarly, the availability of a car in the garage appears to make a difference with regard to weekly cycles. The heart of this issue is not much different from the first one: suicides often result from fleeting impulses, so that the probability of passing from ideas, phantasies and eventual plans to action greatly depends on apparently trivial contextual determinants, such as the (perceived) availability of methods, even on rhythms of outdoor activities.
There are two major lessons for prevention, which emerge from the analysis of suicides during Easter, Pentecost/Whit and the Advent season. First, given that suicide is often a fleeting phenomenon, gaining time becomes essential. The success of many prevention measures depends on whether they can delay the start or progress of the suicidal action. In this connection, there are a considerable number of contextual, social and psychodynamic issues that can be modified such as social contact (and thus also social control or surveillance), appointments and social support, availability of means, access of low-threshold services. Second, the turning points between low and high frequencies presumably provide promising frames for the timing of prevention actions. The gap between the lowest and highest frequencies is typically 25–30%, both in weekly data and in the Advent season.
Limitations
A common limitation of this study is the use of data from the official mortality statistics. Such data have well-known weaknesses, such as the under-reporting of suicides (Minder & Zingg, Reference Minder and Zingg1989). Although no seasonal variation in under-reporting was shown in previous research (Barraclough & White, Reference Barraclough and White1978), this issue cannot be excluded definitively for weekly distributions. In addition, official mortality statistics lack more detailed information such as the motives for suicide (e.g., history of psychiatric disorders, concomitant life events). Also, religious affiliation may be a rather weak proxy for the influence of religiousness on daily behaviour.
Acknowledgements
The Austrian suicide data were obtained from Statistics Austria with permission. We thank Mag. Barbara Leithner for her support. The Swiss data were extracted from the mortality records with the authorisation granted by the Swiss Federal Statistical Office in Neuchâtel, Switzerland.
Financial Support
This research received no specific grant from any funding agency, commercial or not-for-profit sectors.
Conflict of Interest
None.
Ethical Standard
The authors assert that all procedures contributing to this work comply with the ethical standards of the relevant national and institutional committees on human experimentation and with the Helsinki Declaration of 1975, as revised in 2008.


