I. INTRODUCTION
Iron ore sinter materials are an important feedstock material for the steel industry. Since fines cannot be used in conventional blast furnaces because they impair the upward gas flow, they are agglomerated in sinter plants (Ghosh and Chatterjee, Reference Ghosh and Chatterjee2008). Most steel plants use coal and iron ores from diverse sites, and the mixing of these materials as well as with the sinter material should be controlled carefully to obtain the optimal composition that would lead to a good quality of iron from a blast furnace. In particular, the increase of Fe2+ content in sinter may cause low pH in the furnace and make deoxidization difficult, which results in a higher fuel requirement in the furnace (Kwang-Su et al., Reference Kwang-Su, Hyeseon, Chi-Hyuck, Kwang-Hyun, Jae-Won and Seung-Bin2000). Although Fe2+ in sinter ores is one of the major constituents in making iron and steel, there have been little attempts for the prediction of Fe2+ content in sinter ores using the X-ray diffraction (XRD), which has several advantages over conventional analysis methods.
The composition of iron ore sinter according to Patrick and Lovel (Reference Patrick and Lovel2001) and Van den Berg (Reference Van den Berg2008) includes as main phases hematite (Fe2O3), magnetite (Fe3O4), ferrites [mostly silico-ferrite of calcium and aluminum (SFCA)], a glass phase, and dicalcium silicates (larnite), with the main sources of Fe2+ in iron ore sinter being magnetite. Minor amounts are also present within the SFCA phases.
According to Kwang-Su et al. (Reference Kwang-Su, Hyeseon, Chi-Hyuck, Kwang-Hyun, Jae-Won and Seung-Bin2000) two different methods are used to determine the amount of Fe2+ in iron ore sinter: (1) a wet chemical method based on the redox reaction between Fe2+ and standard potassium dichromate; and (2) an instrumental method based on the magnetic field permeability of Fe2+ in sinter ores. The wet chemical method is accurate but time-consuming (a typical analysis takes 4 h) and uses chemicals that may make hazardous effects on operators and environment. The instrumental method is rapid and environment friendly, but not as accurate as wet chemistry. A rapid, simple yet accurate determination of Fe2+ content in sinter ores is essential to provide appropriate materials in making iron and steel.
In addition to the Fe2+ content the mineralogical phase content determines the iron ore sinter quality. The basic properties for high-quality sinter as described by Ishikawa et al. (Reference Ishikawa, Shimomura, Sasaki and Toda1983) are reducibility, reduction degradation resistance, cold strength, and high-temperature behavior. According to Pownceby and Clout (Reference Pownceby and Clout2003), the sinter matrix which includes solid SFCA and pores directly determines sinter quality parameters such as strength, sintering fuel rate, and sinter softening and melting behavior in the blast furnace. SFCA must be a major phase to ensure reducibility, strength, and subsequently minimize the return of fines rate of the sinter. Magnetite is preferred to hematite because of volume changes during magnetite-to-hematite conversion.
The larnite content should be as low as possible since β–γ polymorph transformations can occur during heating-up compromising sinter strength. This paper describes how XRD data obtained from iron ore sinter allow a fast and reliable and environmentally friendly determination of the Fe2+ content and a better understanding of the mineralogical phase composition without the need for wet chemicals to be involved.
II. EXPERIMENTAL
A. Samples and sample preparation
Sample preparation of powder samples is an important issue to obtain correct results, especially for sinters which are notoriously inhomogeneous. Approximately 40 kg of each sample was split into a portion of 20 g. To guaranty a reproducible and constant sample preparation for the XRD measurements, the samples were prepared using automatic sample preparation equipment. All 35 powder samples were milled for 30 s and pressed for 30 s with a 10 Nm load into steel ring sample holders. The Fe2+ content of 35 sinter samples was determined by a wet chemical procedure in which a portion of finely ground sinter was dissolved in hydrochloric acid in non-oxidizing conditions and the resulting Fe2+ in solution was determined by redox titration.
B. Data collection and analysis
For the studies presented in this paper, a PANalytical CubiX 3Iron industrial diffractometer with Co anode, incident iron filter, and high-speed X'Celerator detector was used, featuring measurement times of less than 10 min per scan. XRD patterns were collected in the range 10–88°2θ. Data evaluation was performed using the software package HighScore Plus version 4.0. Two different quantification methods were trialed to quantify the Fe2+ content: (1) partial least-squares regression (PLSR) and (2) back calculation from the phase content obtained by the Rietveld method. The Rietveld method requires structural data of all crystalline phases, while PLSR only requires calibration samples with known Fe2+ content. The advantages of both methods are described in the following chapters.
C. PLSR: the method
Traditionally XRD relies on the accurately description of profile shapes in order to extract or predict information from the full pattern using physical models and fitting techniques. Sometimes this approach is stretched to its limits, usually when no realistic physical models are available or when the models are too complex. One very elegant way around this is multivariate statistics and PLSR, a technique that is rather popular in spectroscopy as well as in a number of science fields such as biosciences, proteomics, and social sciences. Using PLSR, as developed by Wold (Reference Wold and Krishnaiaah1966), it is possible to predict any defined property Y directly from the variability in a data matrix X (Figure 1). The matrix X typically contains non-systematic variations (sample preparation, impurities and grain size) and systematic “measurable” variations (different quantities). The aim is to correlate the systematic variation with a known property Y.

Figure 1. (Color online) The PLSR method extracts scores from matrix X accounting for the largest variation in responses Y (maximum covariance).
PLSR is particularly well suited when the matrix of predictors has more variables than observations and when multi-colinearity among X values exists. PLSR for XRD data are a full-pattern approach that totally dismisses profile shapes but still uses the complete information present in the XRD data sets. The software HighScore Plus version 4.0 uses the SIMPLS algorithm (De Jong, Reference De Jong1993; Lohninger, Reference Lohninger1999). It is easy to use, evaluation, and optimization of the regression model is semi-automatic and requires little knowledge of the method.
III. RESULTS
A. PLSR analysis
The influence of the scan range to the accuracy of the PLSR results was tested by using different ranges from the full XRD pattern. Optimal results with respect to accuracy and range were found using 27–52°2θ. A shorter scan range reduces the measurement time for the PLRS analysis and increases the sample throughput without the expense of accuracy. A visual comparison of all 35 XRD patterns shows only minor changes in the range of 39–43° 2θ (Figure 2).

Figure 2. (Color online) Comparison of 35 iron ore sinter measurements. The zoomed view shows minor differences in the area from 39 to 43°2θ.
The input for the PLSR analysis was the measured XRD scans (X) and the Fe2+ results from the wet chemistry (Y). An optimal regression model was found automatically using the PLSR tool in the software HighScore Plus version 4.0. The optimal number of PLSR factors was found to be 3 with the scaling mode “Center”.
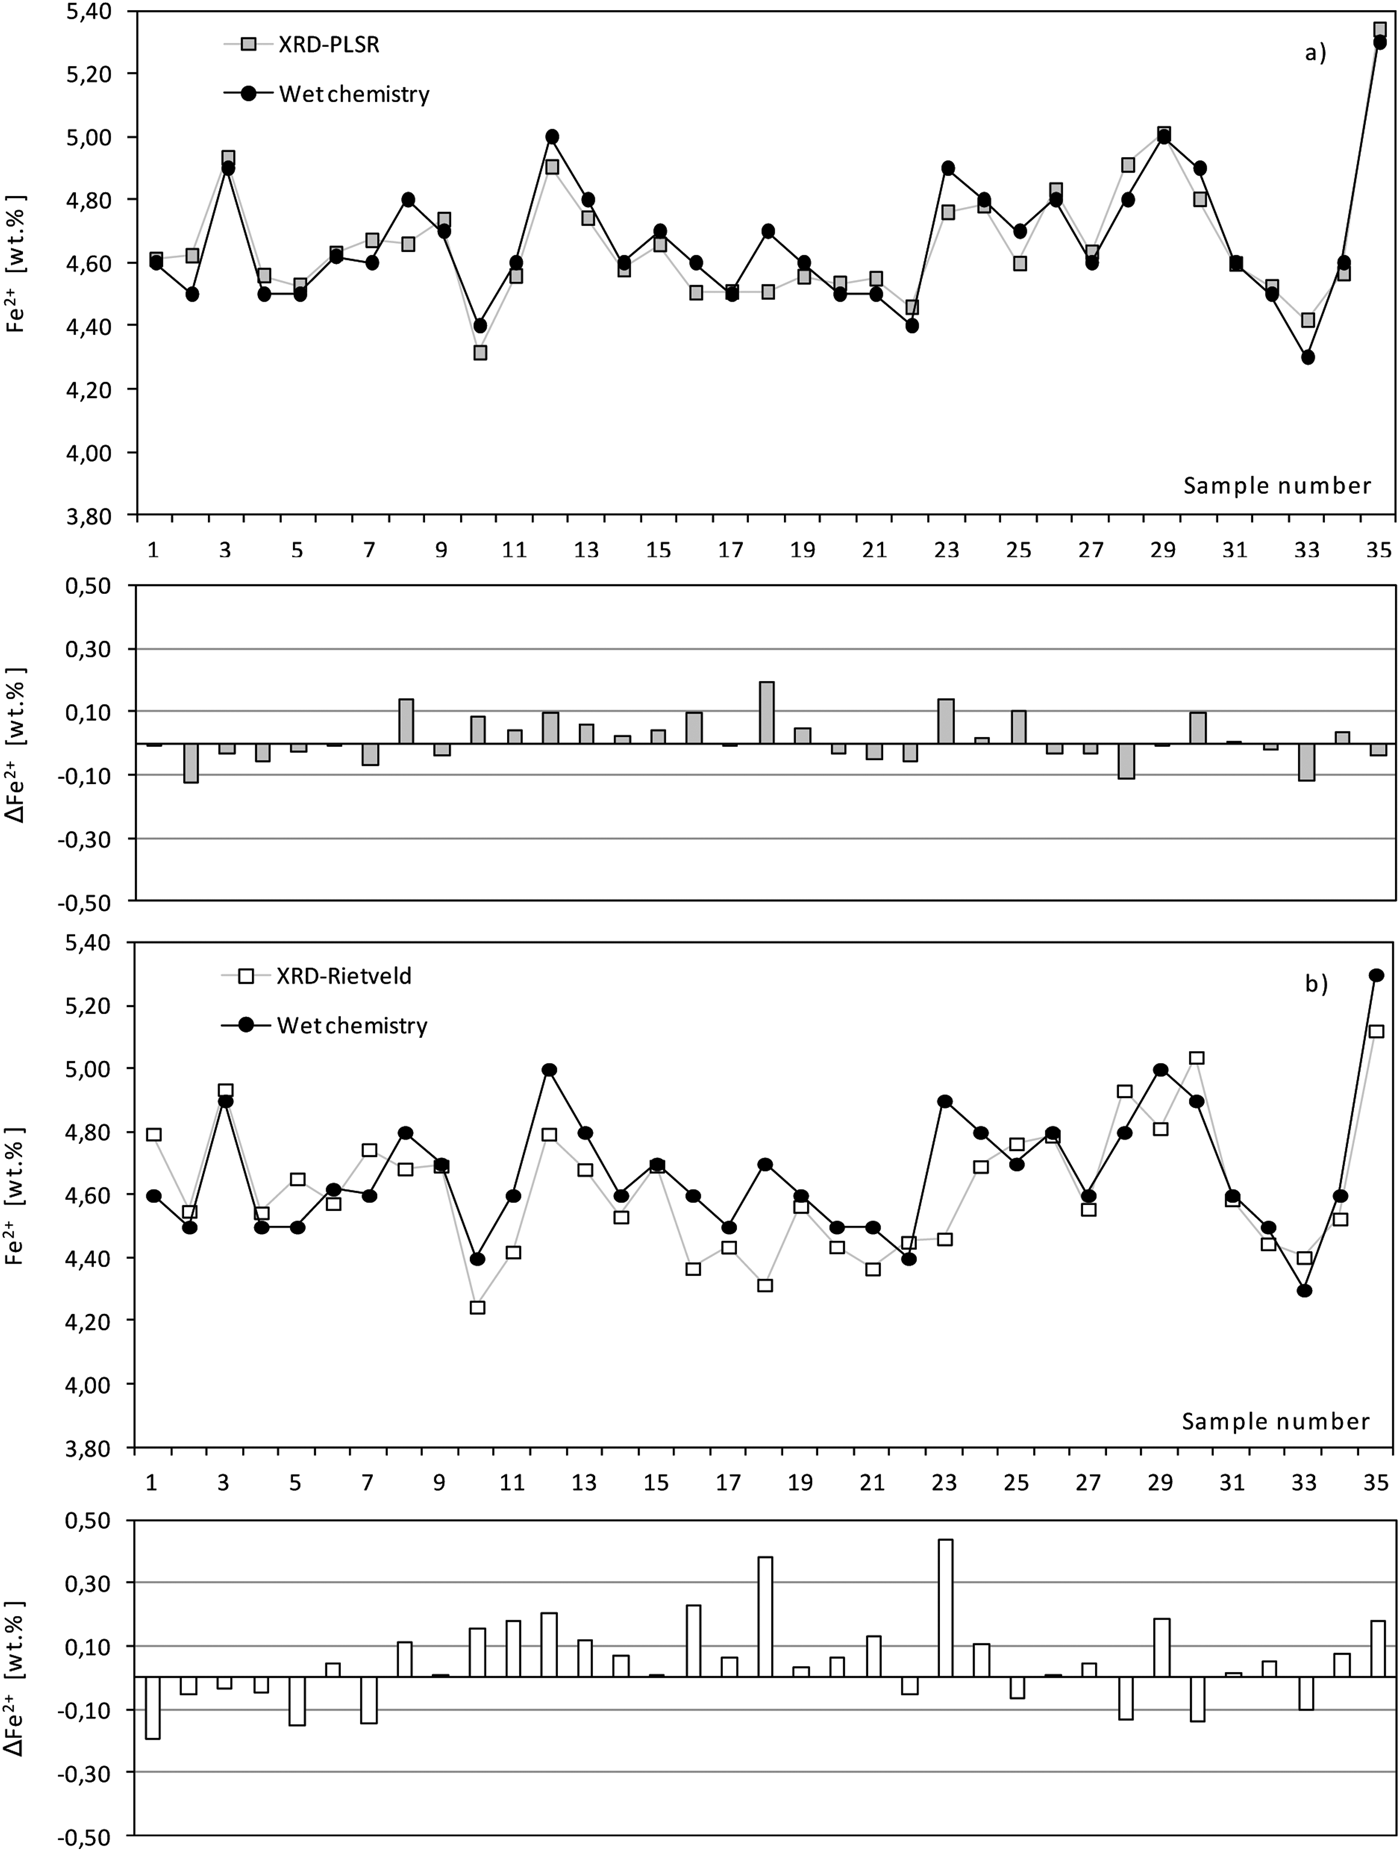
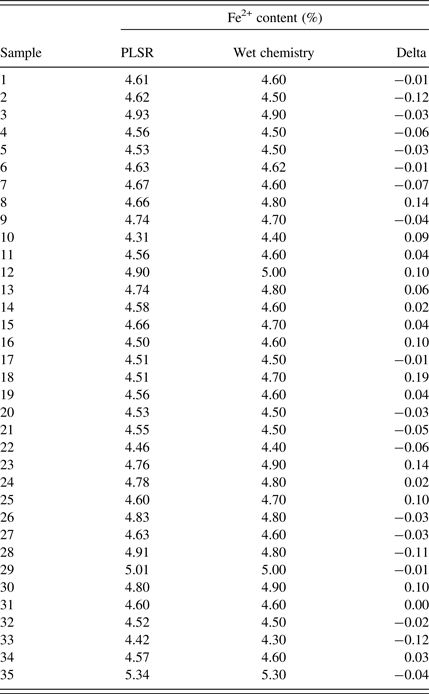
The root-mean-square error of prediction (RMSEP) give an absolute value of the expected variation of the property analyzed. Based on the optimization plot in Figure 3, the RMSEP was found to be 0.14% Fe2+. Cross-validation was used for estimating the errors of the PLSR calibration model. It was performed automatically by entering the number of test sets and the required repetitions. After PLSR calibration the Fe2+ content of unknown samples can be predicted. Table I and Figure 4(a) show the comparison between wet chemistry and PLSR results for the Fe2+ content in iron ore sinter.

Figure 3. (Color online) Optimization plot showing two tested scaling modes, the number of factors used and the RMSEP for a test set of 35 sinter scans, calibration is based on the even sample numbers.

Figure 4. Comparison of wet chemistry, PLSR (a) and Rietveld (b) results for Fe2+ in iron ore sinter, absolute errors below the graph in %.
Table I. Comparison of wet chemistry and PLSR results for Fe2+ in iron ore sinter (%), minimum delta = −0.12, maximum delta = 0.19%.

B. Rietveld quantification
Modern quantification analysis techniques such as Rietveld analysis are attractive alternatives to classical peak intensity or area-based methods since they do not require any standards or monitors (Rietveld, Reference Rietveld1969). For this study the method was initially used to determine the Fe2+ content for comparison with wet chemistry and PLSR data.
Since the amount of Fe2+ in the samples cannot directly be analyzed, a back calculation from the mineralogical phase content was performed. Prior to these calculations and phase quantification, all present crystalline phases were identified. Main components present in the analyzed sinter samples are hematite (Fe23+O3), magnetite (Fe23+Fe2+O4), larnite (Ca2SiO4, also known as belite or C2S), SFCA (Hamilton et al., Reference Hamilton, Hoskins, Mumme, Borbidge and Montague1989), and SFCA-I (Mumme et al., Reference Mumme, Clout and Gable1998). The basicity (CaO:SiO2 ratio) for the analyzed sinter samples was 1.9. A glass phase as it is typical especially for low basicity sinters was found to be a minor component and for that reason not quantified. The calculation of the Fe2+ was performed using the crystalline phases only.
Figure 5 illustrates an example for a full-pattern Rietveld refinement of one sinter sample in the measured range from 10 to 88°2θ. Measured and calculated patterns are shown as well as the difference plot between both. Agreement indices were R wp = 3.6 and GoF = 1.7. The advantage of the Rietveld analysis is the simultaneous quantification of all mineral phases. This valuable information can be used in addition to the Fe2+ content to optimize the quality of the sinter, the sinter conditions and the raw mix.

Figure 5. (Color online) Example for a Rietveld quantification of an iron ore sinter. Measured scan, calculated pattern, and the difference plot are shown as well as the quantitative phase content, R wp = 3.6 and GOF = 1.7.
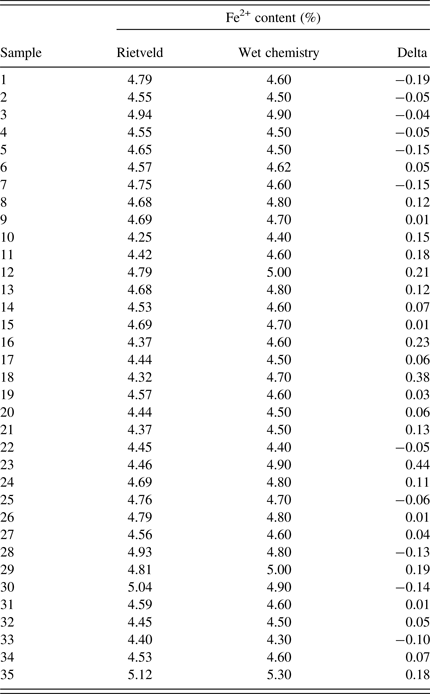
Based on the Rietveld results of all 35 samples the Fe2+ contents were calculated and compared with the results from wet chemistry [Figure 4(b) and Table II]. The deviations of the Rietveld based Fe2+ content compared with the wet chemistry results are slightly larger compared with the results of PLSR. The RMSEP was calculated with 0.25% Fe2+. However, both XRD methods follow the same trend as the wet chemistry results, and can be used as fast methods to monitor sinter production.
Table II. Comparison of wet chemistry and Rietveld results for Fe2+ in iron ore sinter (%), minimum delta = −0.19, maximum delta = 0.44%.

IV. CONCLUSION
It is shown how the XRD can be used to provide valuable information for process control of iron ore sintering. Today's optics, detectors, and software can provide rapid (within minutes) and accurate analyses, suitable for process control environments as well as in research. PLSR is a robust method for the determination of the Fe2+ content in iron ore sinter. An advantage of the method is that no pure phases, crystal structures, or complex modeling of peak shapes are required. PLSR is relatively simple, rapid, and accurate compared with other modeling techniques. The full-pattern variation is taken into account for the quantification. A reduced scan range can speed up the measurement time and lead to an optimized sample throughput and more frequent monitoring of the sinter quality. PLSR is less sensitive to non-ideal sample preparation and measurement setup. However, the method needs a set of samples for calibration. In comparison, the Rietveld method quantifies the total phase composition of the samples. This information helps to predict and monitor other parameters such as the hardness of the sinter. The Fe2+ content, calculated from the phases, shows good agreement with the wet chemistry data, but the deviations are bigger when compared with PLSR. Both methods take the full XRD pattern into account and can be therefore applied on the same measurement without additional costs and time.


