


1 Introduction
The model of voluntary contribution to a public good provides a simple metaphor for many social dilemmas in which cooperation is socially efficient, but where agents motivated by material self-interest have incentives to free-ride. In this setting, a large body of experimental evidence finds that while many people do indeed free-ride, there are others who contribute a not-inconsequential share of their resources to public goods, even in one-shot interactions.Footnote 1
A key insight from this literature is that many people are conditional cooperators, who prefer to contribute only when others do so, and even conditional cooperators display a “selfish bias” (Fischbacher et al. Reference Fischbacher, Gächter and Fehr2001, hereinafter FGF).Footnote 2 As a result, there is considerable interest in institutions such as peer punishment (Fehr and Gächter Reference Fehr and Gächter2000, Reference Fehr and Gächter2002) that may strengthen cooperation in the face of the temptation to free-ride. Since both conditional cooperation and punishment are at odds with conventional theory, especially in one-shot settings, they have helped to stimulate a lively literature on models of social preferences.Footnote 3
The aim of this paper is to enrich understanding of how willingness to conditionally cooperate or punish varies in response to the cooperativeness of others. Key to this is a more complete application of the “strategy method” (Selten Reference Selten and Sauermann1967), in which each subject specifies a complete profile of choices in response to every possible combination of the choices of others. Because FGF and related studies only apply a restricted version of the strategy method based on the average contribution, they overlook important aspects of how conditional cooperation responds to the full distribution of contributions. Likewise, previous studies of punishment in public good experiments have not used the strategy method at all.
The results demonstrate clearly that behaviour responds not only to the average level of contributions—as widely presumed in the pastFootnote 4—but also to the distribution of contributions that make up the average. This is the case both for conditional cooperation in a game without punishment, and for conditional punishment decisions in a game with punishment. Moreover, the observed effects are directionally consistent with the predictions of the Fehr and Schmidt (Reference Fehr and Schmidt1999, hereinafter FS) model of inequality aversion.
In the game without punishment, it is shown that there are two distinct sources of selfish bias in conditional cooperation. Firstly, in cases in which others contribute equally, the finding of FGF that even subjects classified as conditional cooperators fall short of matching others’ contributions is replicated. Secondly, holding the average contributions of others constant, conditional contributions decline even further as other players contribute more unequally.
In the game with punishment, there is a substantial positive response of punishment to deviations of the target player below the contribution of the punisher, and a smaller negative response to deviations above the punisher. Holding the contribution of the target constant, punishment responds positively to the contribution of a third player. Finally, the strategy method also detects “antisocial” punishment of high contributors. However, contrary to the suggestion that this may be an expression of disdain toward “do-gooders”, there are remarkably few instances of antisocial punishment directed specifically at higher contributors.
2 Related methods
The inherent difficulty of the strategy method in public good experiments arises from the very large number of combinations of contributions. For the standard parameters used by Fehr and Gächter (Reference Fehr and Gächter2000), there are 21 integer levels of contribution from 0 to 20. With each subject assigned to a group of four, there are 213=9,261 combinations of others’ contributions. In a game with punishment, each subject must decide how much punishment to assign to each of three others, so there are 9,261×3=27,783 different punishments to specify! Clearly, to make the strategy method operational, it is necessary to simplify the strategy space of the game.
To apply a restricted form of the strategy method to a game without punishment, FGF elicit contributions conditional on the average of others’ contributions, rounded to the nearest integer. Thus they do not truly elicit strategies in the game-theoretic sense of responses to all possible actions by others. In particular, their procedure cannot detect how contributions vary with changes in the composition of the average. For this purpose, it is necessary to elicit contributions in response to combinations of contributions, and not only to averages.
Previous studies of punishment in public good experiments rely on the “direct-response” method: subjects are simply asked to specify punishments in response to the actual specific contributions of their partners, such that the observable punishment is limited by the actual contributions of others. As a result, it is not possible to determine how a given punisher’s behaviour might differ in the face of some alternative counterfactual pattern of contributions.
More data, and possibly greater variation in the contributions of others, can be obtained by pooling decisions from repeated play. However, this introduces learning effects, may bring in strategic considerations, and in any case need not ensure that subjects respond to a full range of variation in the contributions of others. In short, existing procedures only reveal specific instances of punishment, not the full underlying preference or willingness to punish.
Falk et al. (Reference Falk, Fehr and Fischbacher2005) apply the strategy method to punishment in a one-shot three-person prisoners’ dilemma. However, one unusual feature of their design is that the “effectiveness of punishment” varies depending on whether punishment is directed toward a cooperator or defector. In particular, a given punishment assigned to a cooperator reduces the earnings of the target by more than if the same punishment were assigned to a defector. Since the demand for punishment is known to be responsive to this parameter,Footnote 5 this could distort the findings regarding defectors’ willingness to punish cooperators relative to other defectors.
3 Design
I introduce a simplified environment in which a player’s complete conditional contribution strategy (in a game without punishment) or punishment strategy (in a game with punishment) can be elicited using only ten sets of contingent decisions. The basic setting is a linear public good game with n=3 players, where the marginal per capita return is a=0.5. Each player has y=6 “points” and can choose one of four contributions: c∈{0,2,4,6}.Footnote 6 Each point not contributed generates a private return of 1 to the individual alone. Each point contributed by any player returns a to every player. Since n⋅a>1>a, full contribution is socially efficient, whereas in a one-shot game the dominant strategy in material payoffs is to contribute 0.
The contributions of the other two players are shown in ascending order, and subjects are only presented with the ten cases that are unique under this ordering, namely (0, 0), (0, 2), (0, 4), (0, 6), (2, 2), (2, 4), (2, 6), (4, 4), (4, 6), and (6, 6). In the game without punishment, each subject specifies a conditional contribution in each case. In the game with punishment, each subject assigns an amount of punishment, if any, to each of two other players in each case.
3.1 The game without punishment
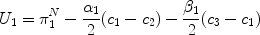
The game without punishment extends the procedure introduced by FGF to allow for cases in which others contribute more or less equally. Each subject first makes an “unconditional” contribution and then completes a “contribution table” in which conditional contributions are specified for each of the ten cases.Footnote 7 Afterwards, one player is randomly chosen to have their contribution determined by the contribution table, whereas for the other two the unconditional contribution is binding. With the contributions thus determined, the earnings of player i are:
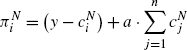
where the superscript N denotes the game without punishment.
3.2 The game with punishment
In the game with punishment, each subject first chooses a contribution (with no contribution table). Each subject then assigns punishment p∈{0,1,2,3} to the other two players. Each unit of punishment costs one point, and reduces the earnings of the target by e=3, however punishment inflicted by others cannot drive a subject’s earnings below zero.Footnote 8 Afterwards, beliefs are also elicited regarding the punishment that subjects expect to incur from others.Footnote 9
For each of ten cases, the punishment screen displays the subject’s own actual contribution, the (hypothetical) contributions of the other players, and the resulting earnings of each player before punishment. Each case is presented on a separate screen, with “Back” and “Next” buttons enabling subjects to navigate between cases prior to confirming their decisions.Footnote 10
Afterwards, the computer looks up the actual contributions of the other two players to determine which of the ten cases is applicable. Punishment is only actually allocated for this case. To assign punishment to others, the computer looks up the number of points assigned by a subject in the applicable case. To determine the punishment assigned to a subject, the same is done for the other players. Given these decisions, the earnings of player i are given by:
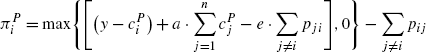
where the superscript P denotes the game with punishment, and p ij is punishment assigned by i to j.
3.3 Procedures and details of sessions
Each subject completed both games as one-shot games in the strategy method, and the order of the games was counterbalanced across sessions.Footnote 11 Importantly, subjects did not receive any feedback on the decisions of others until after they had completed both games. Accordingly, each subject can be treated as an independent observation in both games. Subjects were told at the start of the second game that they would be matched into a new group of three players, and that they would not be matched with any other player twice in both games.
The experiments took place at an Australian research university in March 2010. A total of 60 subjects took part in three “NP” sessions in which the game without punishment was followed by the game with punishment. A further 63 took part in three “PN” sessions in which the order was reversed.Footnote 12 Earnings were converted into cash at an exchange rate of AUD 1.5 per earnings point. The average duration of each session was 90 minutes, and the average payment was AUD 28.3 (USD 26.0 or EUR 19.4). The experiment was programmed in z-Tree (Fischbacher Reference Fischbacher2007) and subjects were recruited using ORSEE (Greiner Reference Greiner, Kremer and Macho2004).Footnote 13
4 Predictions of the Fehr-Schmidt inequality aversion model
A distinguishing feature of the strategy method design is that it permits examination of how contribution and punishment behaviours vary in response to a full range of variation in the contributions of others. To provide further motivation for why this information is of interest, in this section I briefly outline predicted responses in each of the games according to the standard FS model of inequality aversion. In so doing, I emphasise firstly that the FS model is not the only one that may explain the results, and secondly that the experiment was not designed either as a test of its predictions or to distinguish between it and other models.Footnote 14 Rather, the point is simply that since FS utility depends upon the full vector of bilateral payoff comparisons, the predicted responses will vary as a function of the full set of contributions, as elicited under the strategy method design. That is to say, this very familiar model—which is well-known to be an over-simplification—suffices to predict the effect of asymmetries in contribution in the important and extensively-studied setting of a public good game.
In a game with three players, the standard linear FS utility function may be written as:
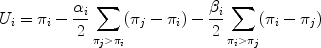
where α i and β i capture aversion to disadvantageous and advantageous inequality respectively, and FS impose the restrictions α i≥β i and 0≤β i<1. Note also that in a standard linear public good game, either without or in the absence of punishment, the bilateral payoff difference between any two players is simply the negative of the difference in their contributions.
4.1 Predictions in the game without punishment
In the game without punishment, a subject in the role of player 1 chooses a contribution level given information on the contributions of players 2 and 3. Consistent with the presentation of the experiment, assume here that c 2≤c 3. Each unit of contribution has three effects upon the FS utility of player 1: a direct decrease in 1’s earnings of (1−a) units (where a is the marginal per capita return), and a decrease in 1’s earnings relative to both 2 and 3 by one unit.
The FS model predicts that 1 will contribute up to c 2 if sufficiently averse to advantageous inequality, or zero otherwise. In particular, in the event that c 1<c 2, player 1’s FS utility is:
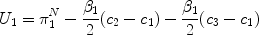
which, given a=0.5, is increasing in c 1 for β 1>0.5. However, the FS model also predicts that 1 will never contribute in excess of c 2. For example, in the event that c 2<c 1<c 3, 1’s utility is:
which is strictly decreasing in c 1 by the parameter restriction α i≥β i. That is, once c 1>c 2, the reduction in advantageous inequality relative to 3 cannot possibly outweigh the combined effects of lower own earnings and increasing disadvantageous inequality relative to 2.
Thus to summarise, in the game without punishment the FS model predicts that where others contribute equally, a subject who is sufficiently averse to advantageous inequality will contribute to the same level. However, as the others contribute unequally, the same subject will only match the minimum of their contributions.Footnote 15
4.2 Predictions in the game with punishment
In the punishment stage of the game with punishment, a subject in the role of player 1 assigns punishments to each of the other players given information on the contributions of all players. In this discussion I focus on punishment of a single player, taken without loss of generality to be player 2, and impose no restriction on the relative contributions of players 2 and 3. Each unit of punishment assigned to player 2 has three effects upon the FS utility of player 1: a direct decrease in 1’s earnings of one unit, a net decrease in the earnings of 2 relative to 1 of (e−1) units (where e is the effectiveness of punishment), and a decrease in 1’s earnings relative to 3 by one unit.
The FS model predicts that there is a broader range of parameter values for which player 1 is willing to punish 2 when 1’s contribution falls short of 3’s than when 1 exceeds 3. However, irrespective of the comparison between 1 and 3, player 1 will only punish 2 down to the point where 2’s earnings are equated to 1’s. Let
 $\tilde{\pi} _{i}$
denote provisional earnings of player i from the contribution stage (i.e. before punishment), and consider first the case where c
1 exceeds both c
2 and c
3. Noting that e=3, 1’s FS utility is:
$\tilde{\pi} _{i}$
denote provisional earnings of player i from the contribution stage (i.e. before punishment), and consider first the case where c
1 exceeds both c
2 and c
3. Noting that e=3, 1’s FS utility is:

which is increasing in p 12 (until 2’s earnings are equated to 1’s) for α 1>2. Compare this to the case where c 1 and c 2 are as before, however c 3>c 1. In the latter case, 1’s FS utility is:

which is increasing in p 12 for α 1>1−β 1/2. Since 0≤β i<1, punishment is utility increasing over a broader range of values of α 1 in this latter case. The reason is that when c 1>c 3 the cost of punishing player 2 increases player 1’s disadvantageous inequality with respect to 3, whereas when c 3>c 1 it decreases 1’s advantageous inequality with respect to 3. By writing out corresponding expressions for cases in which player 2’s earnings fall below 1’s, it is straightforward to show that the FS model does not predict punishment in those cases.Footnote 16
Thus to summarise, in the game with punishment the FS model predicts that, subject to the target contributing less than the punisher, there is greater scope for punishment as the contribution of the third player exceeds that of the punisher. Moreover, since punishment ceases once the earnings of the target are equalised with those of the punisher, the severity of punishment will be greater the lower the contribution of the target below that of the punisher.
5 Results of the game without punishment
As a first step in the analysis of the game without punishment, I follow FGF in classifying subjects into types based on their responses in the contribution table.Footnote 17 To avoid biasing the analysis of how conditional cooperators respond to differences in the contributions of the two other players, responses to unequal contributions are set aside for the purpose of this classification. Accordingly, define a conditional cooperator as someone whose contributions increase weakly monotonically over the cases (0, 0), (2, 2), (4, 4) and (6, 6); that is, if c(0,0)≤c(2,2)≤c(4,4)≤c(6,6) with c(0,0)<c(6,6), where c(l,h) denotes the conditional contribution when the ordered contributions of the two other players are l and h. A subject who enters 0 in all ten cells of the contribution table is classified as a free-rider. Subjects who do not meet either of these criteria are classified as “others”.
Using these definitions, 41 subjects (33 percent) are classified as conditional cooperators, 61 (50 percent) as free-riders, and the remaining 21 (17 percent) as “others”.Footnote 18, Footnote 19 Thus the proportion of conditional cooperators is lower than the 50 percent reported by FGF in Switzerland but comparable with the 35 percent reported by Burlando and Guala (Reference Burlando and Guala2005) in Italy. Conversely, the proportion of free-riders is higher than the 30 percent found by FGF. It seems likely that two factors contribute to these differences. Firstly, FGF classify some subjects as conditional cooperators even where their contribution schedule is not weakly monotonically increasing.Footnote 20 Secondly, in a cross-cultural study of sixteen subject pools, Herrmann et al. (Reference Herrmann, Thöni and Gächter2008, hereinafter HTG) found Australian students to be the least cooperative in a public good game without punishment.
The two upper panels in Fig. 1 depict the mean behaviour of subjects classified as conditional cooperators and “others”, respectively. Each point represents one of the ten cases in the contribution table. These are plotted against the implied mean contribution of the two other group members on the horizontal. It can be seen that the “others” conform on average to the “hump-shape” pattern identified by FGF. This is remarkable given that it is observed in responses to combinations of contributions, as opposed to averages as in FGF.Footnote 21
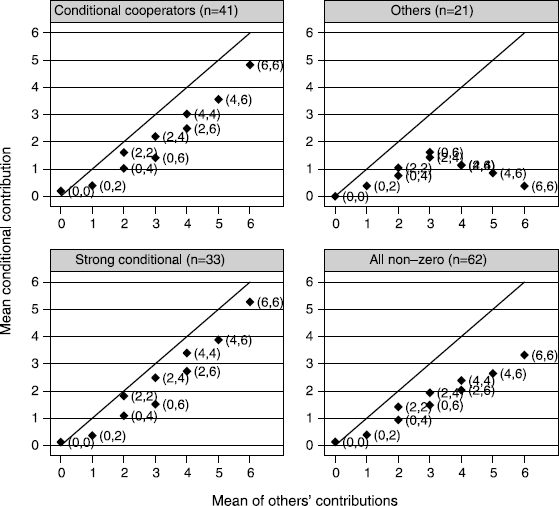
Fig. 1 Mean conditional contributions as a function of combinations of the other two players’ contributions, for alternative classifications of subjects’ contribution behaviour. The horizontal axis depicts the mean of the other two players’ contributions. The diagonal corresponds to perfect conditional cooperation
Recall that the standard linear FS model predicts that when others contribute equally, a subject who is sufficiently averse to advantageous inequality will contribute to the same level, or otherwise not at all. As others contribute unequally, the FS model can only explain contributing up to the minimum. The model can accommodate heterogeneity insofar as subjects differ in their aversion to inequality (and indeed, half of all subjects are insufficiently moved to make even a single contribution), however it cannot explain intermediate levels of contributions at an individual level, nor contributions in excess of the minimum.
It is clear in Fig. 1 that there is selfish bias in the behaviour of conditional cooperators, in that they do not on average fully match the mean contributions of others.Footnote 22 Moreover, it can be seen that there are two distinct sources of this bias. Firstly, in the cases (2, 2), (4, 4) and (6, 6) in which the two other players contribute equally, conditional cooperators on average fail to match that contribution. In effect, this replicates the selfish bias identified by FGF; relative to the FS benchmark it may represent a certain amount of under-contribution.
Secondly, there are three matched pairs of cases in which the mean of the two other players’ contributions are the same, but in one case they are more unequal than the other. In all three instances, the mean contribution of conditional cooperators is further depressed when the others contribute more unequally. This could not be observed in FGF since they only elicit responses to the average of the other players’ contributions. While this effect is directionally consistent with the FS benchmark, note that on all three occasions the mean contribution of conditional cooperators exceeds the minimum of the other players’ contributions, in clear violation of the model. Whereas FS predicts that subjects should only be willing to match the minimum, it is clear that the observed response is not as extreme as that prediction implies.
To examine the sensitivity of these effects to the definition of a conditional cooperator, consider two alternative classifications. For a narrower category, define a “strong conditional cooperator” as a subject for whom at least two of the inequalities c(0,0)<c(2,2),c(2,2)<c(4,4), and c(4,4)<c(6,6) hold strictly, with the remaining one holding at least weakly. There are 33 subjects (27 percent) for whom this is the case. For a broader classification, consider all 62 subjects (50 percent) who make at least one nonzero conditional contribution. The lower panels in Fig. 1 summarise the behaviour of these two groups. Naturally, compared to conditional cooperators, the contributions of the narrower group lie closer to the diagonal while those of the broader group lie further below it. Moreover it is also clear that the shapes of the functions are similar for all three classifications.
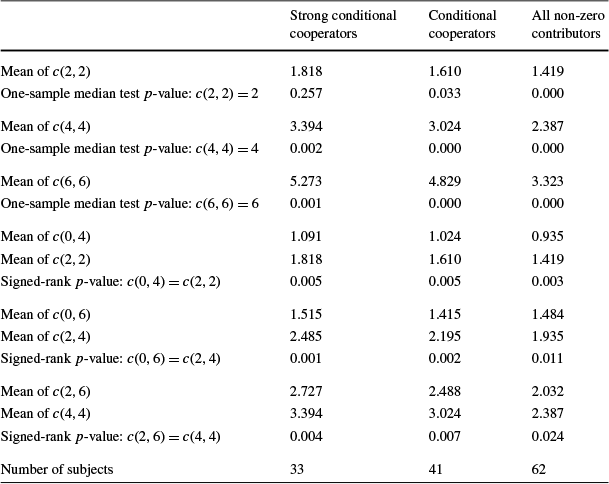
Table 1 reports nonparametric tests of the significance of these two forms of selfish bias, both for conditional cooperators (in the middle column) and the two comparison groups. The top rows relate to cases where the two other players contribute equally. Among conditional cooperators the mean of c(2,2) is 1.610, and a one-sample median test rejects the hypothesis that c(2,2)=2 with p=0.033. Likewise, c(4,4) and c(6,6) differ significantly from 4 and 6 respectively, with p<0.001 for both. Among strong conditional cooperators it is not possible to reject the hypothesis that c(2,2)=2 (p=0.257), while it remains the case that c(4,4) and c(6,6) differ significantly from 4 and 6 respectively (p≤0.002, one-sample median tests).
Table 1 Tests of two sources of selfish bias in conditional contributions
|
Strong conditional cooperators |
Conditional cooperators |
All non-zero contributors |
|
|---|---|---|---|
|
Mean of c(2,2) |
1.818 |
1.610 |
1.419 |
|
One-sample median test p-value: c(2,2)=2 |
0.257 |
0.033 |
0.000 |
|
Mean of c(4,4) |
3.394 |
3.024 |
2.387 |
|
One-sample median test p-value: c(4,4)=4 |
0.002 |
0.000 |
0.000 |
|
Mean of c(6,6) |
5.273 |
4.829 |
3.323 |
|
One-sample median test p-value: c(6,6)=6 |
0.001 |
0.000 |
0.000 |
|
Mean of c(0,4) |
1.091 |
1.024 |
0.935 |
|
Mean of c(2,2) |
1.818 |
1.610 |
1.419 |
|
Signed-rank p-value: c(0,4)=c(2,2) |
0.005 |
0.005 |
0.003 |
|
Mean of c(0,6) |
1.515 |
1.415 |
1.484 |
|
Mean of c(2,4) |
2.485 |
2.195 |
1.935 |
|
Signed-rank p-value: c(0,6)=c(2,4) |
0.001 |
0.002 |
0.011 |
|
Mean of c(2,6) |
2.727 |
2.488 |
2.032 |
|
Mean of c(4,4) |
3.394 |
3.024 |
2.387 |
|
Signed-rank p-value: c(2,6)=c(4,4) |
0.004 |
0.007 |
0.024 |
|
Number of subjects |
33 |
41 |
62 |
The bottom rows of Table 1 report p values for Wilcoxon signed-rank tests of the decrease in contribution as the two other group members contribute more unequally, holding constant the mean. This decrease is found to be significant (p≤0.024) for all three such comparisons, and in all three subject classifications. This confirms that previous designs overlook important information when they condition solely on the average; clearly differences in contribution matter a great deal as well—perhaps because they reflect the strength of a social norm or consensus over the appropriate level of contribution.Footnote 23 This second form of selfish bias is most severe in the narrower subject classification and mildest in the broader one. In other words, subjects who condition their own contributions more strongly upon the two other group members, in cases where the other players contribute equally, are also more discouraged when the others contribute unequally.
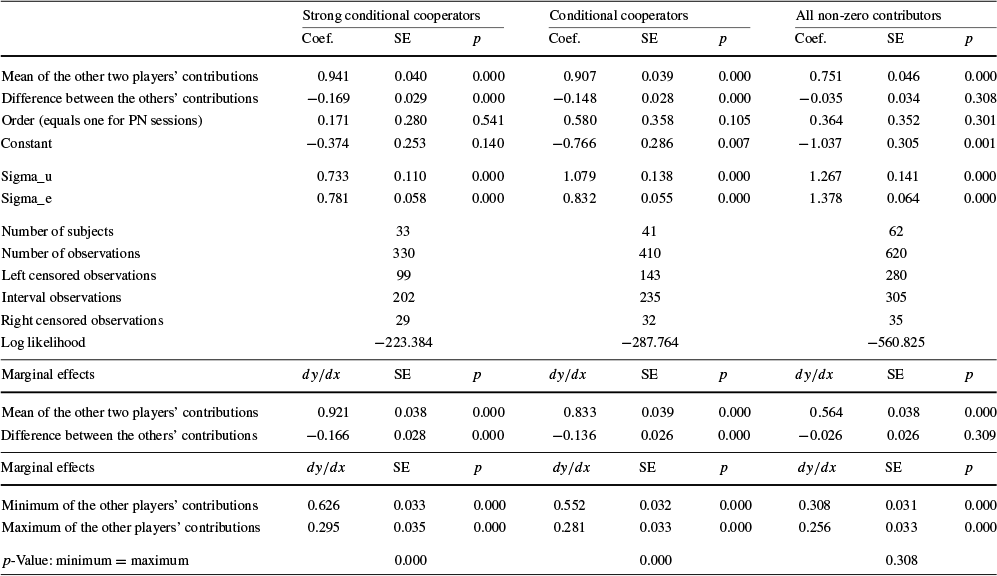
A limitation of the tests in Table 1 is that they do not exploit the full set of ten decisions by each subject, instead relying on pairwise comparisons. To provide a more complete account, Table 2 reports random effects interval regressions in which each contribution decision is regressed on the implied mean and difference in the contributions of the two other players in the case that generated it, a dummy for the treatment order, and a constant.Footnote 24 The regressions are reported for conditional cooperators (in the middle columns), as well as the two comparison groups. Each subject contributes ten observations to the regression, corresponding to the ten cases in the conditional contribution table. Table 2 also reports marginal effects for these regressions, conditional upon contributions lying in the interval between 0 and 6.
Table 2 Random effects interval regressions of conditional contributions
|
Strong conditional cooperators |
Conditional cooperators |
All non-zero contributors |
|||||||
|---|---|---|---|---|---|---|---|---|---|
|
Coef. |
SE |
p |
Coef. |
SE |
p |
Coef. |
SE |
p |
|
|
Mean of the other two players’ contributions |
0.941 |
0.040 |
0.000 |
0.907 |
0.039 |
0.000 |
0.751 |
0.046 |
0.000 |
|
Difference between the others’ contributions |
−0.169 |
0.029 |
0.000 |
−0.148 |
0.028 |
0.000 |
−0.035 |
0.034 |
0.308 |
|
Order (equals one for PN sessions) |
0.171 |
0.280 |
0.541 |
0.580 |
0.358 |
0.105 |
0.364 |
0.352 |
0.301 |
|
Constant |
−0.374 |
0.253 |
0.140 |
−0.766 |
0.286 |
0.007 |
−1.037 |
0.305 |
0.001 |
|
Sigma_u |
0.733 |
0.110 |
0.000 |
1.079 |
0.138 |
0.000 |
1.267 |
0.141 |
0.000 |
|
Sigma_e |
0.781 |
0.058 |
0.000 |
0.832 |
0.055 |
0.000 |
1.378 |
0.064 |
0.000 |
|
Number of subjects |
33 |
41 |
62 |
||||||
|
Number of observations |
330 |
410 |
620 |
||||||
|
Left censored observations |
99 |
143 |
280 |
||||||
|
Interval observations |
202 |
235 |
305 |
||||||
|
Right censored observations |
29 |
32 |
35 |
||||||
|
Log likelihood |
−223.384 |
−287.764 |
−560.825 |
||||||
|
Marginal effects |
dy/dx |
SE |
p |
dy/dx |
SE |
p |
dy/dx |
SE |
p |
|---|---|---|---|---|---|---|---|---|---|
|
Mean of the other two players’ contributions |
0.921 |
0.038 |
0.000 |
0.833 |
0.039 |
0.000 |
0.564 |
0.038 |
0.000 |
|
Difference between the others’ contributions |
−0.166 |
0.028 |
0.000 |
−0.136 |
0.026 |
0.000 |
−0.026 |
0.026 |
0.309 |
|
Marginal effects |
dy/dx |
SE |
p |
dy/dx |
SE |
p |
dy/dx |
SE |
p |
|---|---|---|---|---|---|---|---|---|---|
|
Minimum of the other players’ contributions |
0.626 |
0.033 |
0.000 |
0.552 |
0.032 |
0.000 |
0.308 |
0.031 |
0.000 |
|
Maximum of the other players’ contributions |
0.295 |
0.035 |
0.000 |
0.281 |
0.033 |
0.000 |
0.256 |
0.033 |
0.000 |
|
p-Value: minimum = maximum |
0.000 |
0.000 |
0.308 |
||||||
The results indicate that conditional cooperators respond to a one-point increase in the mean contribution—holding constant the spread—by increasing their desired contribution by 0.833 points. This response is significantly less than one (Z=−4.28, two-sided p<0.001). On the other hand, they respond to a one-point increase in the spread in contributions—holding constant the mean—by decreasing their desired contribution by 0.136 points. This differs significantly from zero (p<0.001). For strong conditional cooperators, the response to an increase in the mean is larger (0.921 points) but still significantly less than one (Z=−2.05, two-sided p=0.040), while the response to the spread (−0.166 points, p<0.001) is more negative than for conditional cooperators. For the broader comparison group, the response to the mean is only 0.564 points while it is not possible to reject the null hypothesis that contributions do not respond to the difference in the other players’ contributions (p=0.309).
The model in Table 2, in which the other players’ contributions enter as the mean and difference, is equivalent to one in which the minimum and maximum contributions enter directly—since there are only two other players, these variables are perfectly collinear. Marginal effects for this specification are shown at the bottom of Table 2; note that in this version, the FS benchmark would predict a coefficient of one on the minimum and zero on the maximum. The results show that conditional cooperators respond to a one-point increase in the minimum—holding the maximum constant—by increasing their desired contribution by 0.552 points. On the other hand, they respond to a one-point increase in the maximum—holding the minimum constant—by increasing their desired contribution by only 0.281 points. The null hypothesis of equality of these responses is soundly rejected with p<0.001 in a Wald test; however the difference is also clearly not as sharp as the FS prediction.
It is easy to see why conditional cooperators are more responsive to an increase in the minimum than they are to the maximum. While either increase has the same implied effect upon the mean, an increase in the minimum has the effect of decreasing the spread between the other players’ contributions, whereas an increase in the maximum has the opposite effect. Thus in the first case, the response to the decreased spread reinforces the response to the increased mean, whereas in the second case, the effect works in the opposite direction.Footnote 25
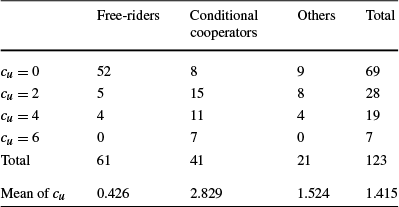
Finally, Table 3 summarises unconditional contributions in the game without punishment, by reporting the cross-tabulation of a subject’s unconditional contribution decision with the subject’s type as defined from the contribution table.Footnote 26 The modal unconditional contribution is 0, and three-quarters of those who unconditionally contribute 0 are also classified as free-riders. Among those classified as free-riders, the mean unconditional contribution is close to 0; among conditional cooperators it is close to the midpoint of the contribution space.
Table 3 Cross-tabulation of unconditional contributions (c u) by conditional contribution types in the game without punishment
|
Free-riders |
Conditional cooperators |
Others |
Total |
|
|---|---|---|---|---|
|
c u=0 |
52 |
8 |
9 |
69 |
|
c u=2 |
5 |
15 |
8 |
28 |
|
c u=4 |
4 |
11 |
4 |
19 |
|
c u=6 |
0 |
7 |
0 |
7 |
|
Total |
61 |
41 |
21 |
123 |
|
Mean of c u |
0.426 |
2.829 |
1.524 |
1.415 |
6 Results of the game with punishment
Analysis of the game with punishment is complicated by evidence of order effects in both the level of contributions and willingness to punish, both of which are attenuated when subjects have previous experience of the game without punishment. In the NP order the mean contribution in the game with punishment is 2.133 points, and 24 of 60 subjects (40 percent) assign nonzero punishment on at least one occasion. In the PN order, the corresponding figures are 3.111 points and 37 of 63 subjects (59 percent). The difference in contributions is significant at p=0.015 in a Wilcoxon rank-sum test, while the difference in willingness to punish is significant at p=0.048 in Fisher’s exact test. Since subjects do not receive feedback before the end of the session, these effects cannot be attributed to learning about the behaviour of others (although of course some learning may take place introspectively (Weber Reference Weber2003)).
Nevertheless, under both orders contributions are higher when punishment is available than when it is not.Footnote 27 Moreover, the fact that a substantial proportion of subjects are willing to punish may alleviate the concern that the strategy method might weaken the negative emotional response to defection that is thought to trigger acts of punishment (Brandts and Charness Reference Brandts and Charness2011). In these respects, the one-shot strategy method game with punishment replicates key findings obtained by Fehr and Gächter (Reference Fehr and Gächter2000) in repeated games played in the direct response mode.
Conditional upon willingness to punish, there little evidence of order effects in the severity of punishment. Among subjects who punish at least once, in all but one punishment decision, there is no significant order effect in the number of punishment points assigned (p≥0.106 in Wilcoxon rank-sum tests).Footnote 28 For this reason, the analysis of punishment behaviour will pool the two orders since it is the comparative statics of punishment that are of primary interest, and there is little evidence that these are affected by order effects. However, this is subject to the caveat that the expected severity of punishment will depend upon the proportion of subjects who are willing to punish, and this is clearly sensitive to the treatment order.
Recall that according to the FS model, a punisher should only punish to the point where the earnings of the target are equalised to those of the punisher. Further, the marginal utility of punishment is greater when the contribution of the third player exceeds that of the punisher. It follows that in the FS framework, there is greater scope for punishment the lower is the contribution of the target and the greater is that of the third player.
Figure 2 summarises punishment behaviour in the ten cases (twenty decisions) elicited by the strategy method. It shows the average punishment assigned, by all subjects who punish on at least one occasion, as a function of the contributions of the target and the third player.Footnote 29 This reveals two clear regularities. Firstly, holding constant the contribution of the third player, punishment increases as the contribution of the target falls. Secondly, holding constant the contribution of the target, punishment increases as the contribution of the third player rises. Thus both of these aggregate effects are directionally consistent with the FS predictions.
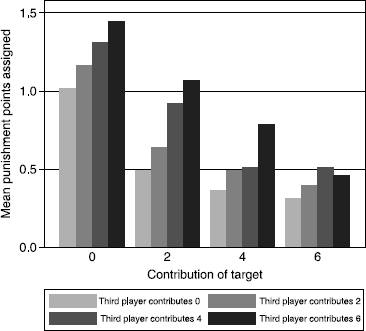
Fig. 2 Mean punishment behaviour of subjects who assign at least one non-zero punishment, as a function of the contributions of the target player and third player
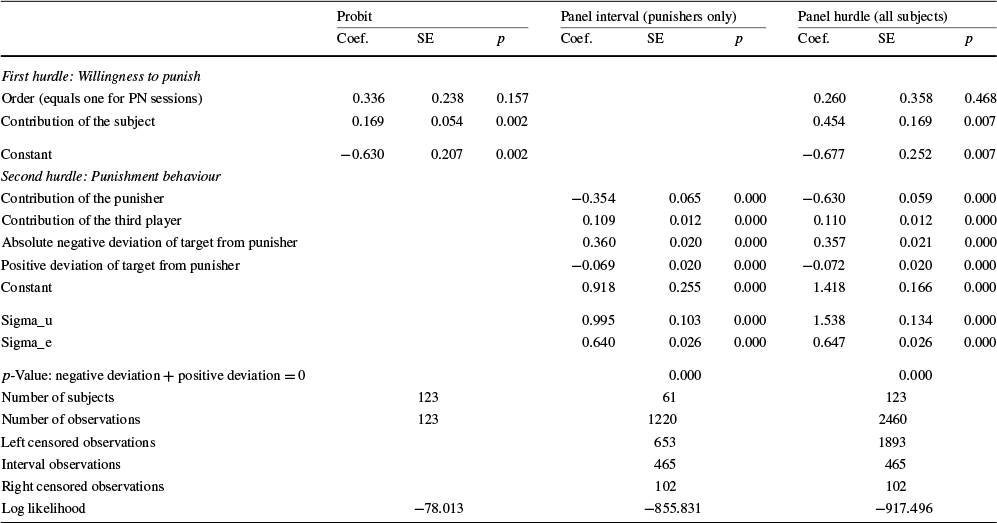
To model the punishment behaviour of those subjects who are willing to punish, while controlling for variables that influence the willingness to punish, Table 4 constructs a panel double-hurdle model of punishment. The development of this model follows that of Engel and Moffatt (Reference Engel and Moffatt2012), who reanalyse the effect of “house money” upon willingness to contribute in the public good experiment of Clark (Reference Clark2002).Footnote 30 In this framework, the “first hurdle” determines whether or not a subject is of the punishing “type”, as applied to all of that subject’s decisions in the game with punishment.Footnote 31 On the other hand, the “second hurdle” models the amount of punishment assigned, if any, as a function of the circumstances of each individual punishment decision, conditional upon the subject being a punisher.
Table 4 Regression analyses of punishment behaviour
|
Probit |
Panel interval (punishers only) |
Panel hurdle (all subjects) |
|||||||
|---|---|---|---|---|---|---|---|---|---|
|
Coef. |
SE |
p |
Coef. |
SE |
p |
Coef. |
SE |
p |
|
|
First hurdle: Willingness to punish |
|||||||||
|
Order (equals one for PN sessions) |
0.336 |
0.238 |
0.157 |
0.260 |
0.358 |
0.468 |
|||
|
Contribution of the subject |
0.169 |
0.054 |
0.002 |
0.454 |
0.169 |
0.007 |
|||
|
Constant |
−0.630 |
0.207 |
0.002 |
−0.677 |
0.252 |
0.007 |
|||
|
Second hurdle: Punishment behaviour |
|||||||||
|
Contribution of the punisher |
−0.354 |
0.065 |
0.000 |
−0.630 |
0.059 |
0.000 |
|||
|
Contribution of the third player |
0.109 |
0.012 |
0.000 |
0.110 |
0.012 |
0.000 |
|||
|
Absolute negative deviation of target from punisher |
0.360 |
0.020 |
0.000 |
0.357 |
0.021 |
0.000 |
|||
|
Positive deviation of target from punisher |
−0.069 |
0.020 |
0.000 |
−0.072 |
0.020 |
0.000 |
|||
|
Constant |
0.918 |
0.255 |
0.000 |
1.418 |
0.166 |
0.000 |
|||
|
Sigma_u |
0.995 |
0.103 |
0.000 |
1.538 |
0.134 |
0.000 |
|||
|
Sigma_e |
0.640 |
0.026 |
0.000 |
0.647 |
0.026 |
0.000 |
|||
|
p-Value: negative deviation + positive deviation =0 |
0.000 |
0.000 |
|||||||
|
Number of subjects |
123 |
61 |
123 |
||||||
|
Number of observations |
123 |
1220 |
2460 |
||||||
|
Left censored observations |
653 |
1893 |
|||||||
|
Interval observations |
465 |
465 |
|||||||
|
Right censored observations |
102 |
102 |
|||||||
|
Log likelihood |
−78.013 |
−855.831 |
−917.496 |
||||||
The first model in Table 4 is a binary probit regression in which a dummy for whether a subject ever punishes is modelled as a function of a dummy for the PN order, the subject’s own contribution and a constant, with each subject contributing a single observation. The second model is a random effects interval regression, restricted to the subsample of punishers, in which each punishment is regressed upon the contribution of the punisher, the contribution of the third player, the absolute negative deviation in the contribution of the target below that of the punisher, the positive deviation of the target above the punisher, and a constant.Footnote 32 Each punisher contributes twenty observations to this regression, corresponding to the punishment they assign to each of two other players in each of ten cases. These two models provide starting values for estimation of the corresponding portions of the full double-hurdle specification, which is the final model reported in Table 4. In the full model, every subject contributes a full set of twenty observations, regardless of whether or not they ever punish.
The results of the first hurdle indicate that the order effect in willingness to punish operates through the level of contributions, which are higher under the PN order. The contribution of the subject has a significant positive effect upon whether that subject ever punishes; however once this is controlled for there is no significant effect of the order per se.
The results of the second hurdle indicate firstly that, conditional upon willingness to punish, the contribution of the punisher has a significant negative effect upon the level of punishment. While this may perhaps appear counterintuitive, it is accounted for by the fact that it holds the deviation in the contribution of the target from the punisher constant. Thus for example, it implies that the punishment assigned to a target who contributes at the same level as the punisher diminishes as the contributions of both increase.
Negative deviations in the contribution of the target below that of the punisher have a significant positive effect upon punishment, while positive deviations in the contribution of the target above that of the punisher have a significant negative effect—albeit one that is substantially smaller in magnitude than the response to negative deviations. This asymmetry in the response to positive and negative deviations is confirmed by a Wald test, in which the null hypothesis that the coefficients on absolute negative and positive deviations are equal (but opposite in sign) is soundly rejected, with p<0.001.
Finally, for a given contribution of the punisher and deviation in the contribution of the target from that of the punisher, the results confirm a significant positive effect of increasing contributions by the third player upon the severity of punishment assigned to the target.
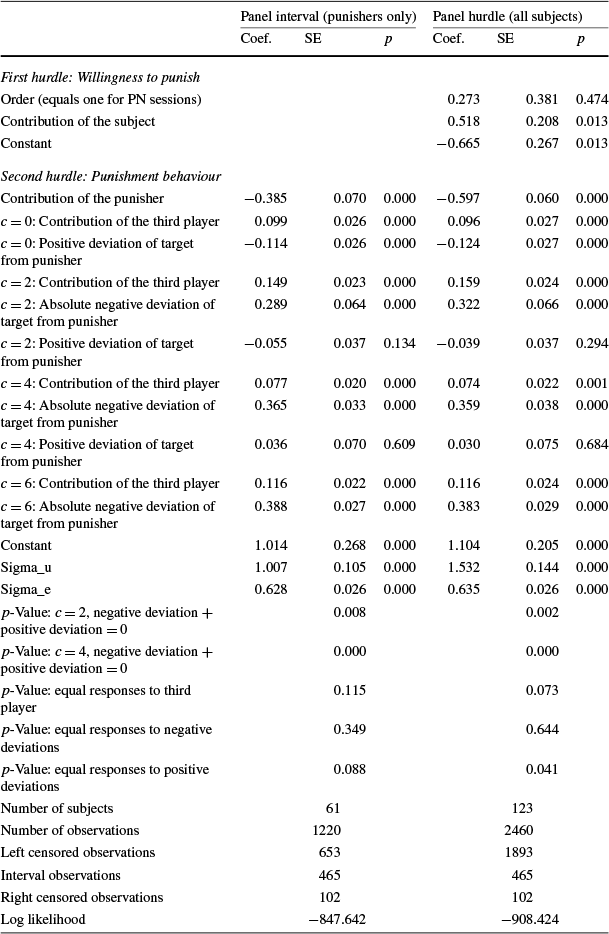
Because Fig. 2 pools the decisions of all punishers, it masks any differences associated with the contribution of the punisher. Figure 3 displays the average punishment functions separately for punishers who contribute 0, 2, 4, and 6. To allow for possible differences in the slopes of these functions, Table 5 reports an enlarged version of the model in Table 4 in which the contribution of the third player and the absolute negative and positive deviations of the target are interacted with dummies for each level of contribution of the punisher.
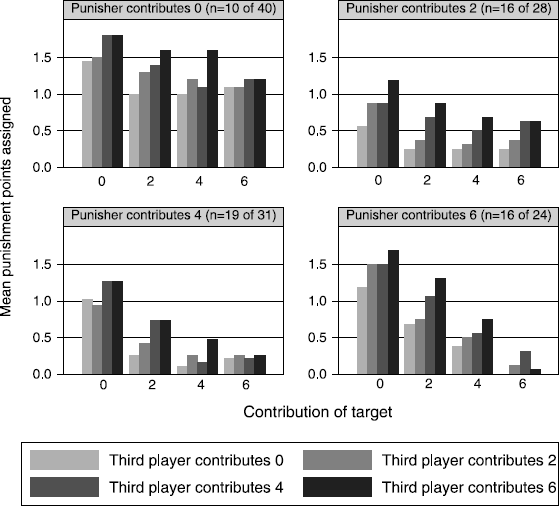
Fig. 3 Mean punishment behaviour of subjects who assign at least one non-zero punishment, as a function of the contributions of the punisher, target player, and third player. The contribution of the punisher is the actual amount contributed by a subject; the contributions of the target and third player are systematically varied over the ten cases in the experiment
Table 5 Regression analyses of punishment behaviour, where coefficients may vary with the contribution of the punisher
|
Panel interval (punishers only) |
Panel hurdle (all subjects) |
|||||
|---|---|---|---|---|---|---|
|
Coef. |
SE |
p |
Coef. |
SE |
p |
|
|
First hurdle: Willingness to punish |
||||||
|
Order (equals one for PN sessions) |
0.273 |
0.381 |
0.474 |
|||
|
Contribution of the subject |
0.518 |
0.208 |
0.013 |
|||
|
Constant |
−0.665 |
0.267 |
0.013 |
|||
|
Second hurdle: Punishment behaviour |
||||||
|
Contribution of the punisher |
−0.385 |
0.070 |
0.000 |
−0.597 |
0.060 |
0.000 |
|
c=0: Contribution of the third player |
0.099 |
0.026 |
0.000 |
0.096 |
0.027 |
0.000 |
|
c=0: Positive deviation of target from punisher |
−0.114 |
0.026 |
0.000 |
−0.124 |
0.027 |
0.000 |
|
c=2: Contribution of the third player |
0.149 |
0.023 |
0.000 |
0.159 |
0.024 |
0.000 |
|
c=2: Absolute negative deviation of target from punisher |
0.289 |
0.064 |
0.000 |
0.322 |
0.066 |
0.000 |
|
c=2: Positive deviation of target from punisher |
−0.055 |
0.037 |
0.134 |
−0.039 |
0.037 |
0.294 |
|
c=4: Contribution of the third player |
0.077 |
0.020 |
0.000 |
0.074 |
0.022 |
0.001 |
|
c=4: Absolute negative deviation of target from punisher |
0.365 |
0.033 |
0.000 |
0.359 |
0.038 |
0.000 |
|
c=4: Positive deviation of target from punisher |
0.036 |
0.070 |
0.609 |
0.030 |
0.075 |
0.684 |
|
c=6: Contribution of the third player |
0.116 |
0.022 |
0.000 |
0.116 |
0.024 |
0.000 |
|
c=6: Absolute negative deviation of target from punisher |
0.388 |
0.027 |
0.000 |
0.383 |
0.029 |
0.000 |
|
Constant |
1.014 |
0.268 |
0.000 |
1.104 |
0.205 |
0.000 |
|
Sigma_u |
1.007 |
0.105 |
0.000 |
1.532 |
0.144 |
0.000 |
|
Sigma_e |
0.628 |
0.026 |
0.000 |
0.635 |
0.026 |
0.000 |
|
p-Value: c=2, negative deviation + positive deviation =0 |
0.008 |
0.002 |
||||
|
p-Value: c=4, negative deviation + positive deviation =0 |
0.000 |
0.000 |
||||
|
p-Value: equal responses to third player |
0.115 |
0.073 |
||||
|
p-Value: equal responses to negative deviations |
0.349 |
0.644 |
||||
|
p-Value: equal responses to positive deviations |
0.088 |
0.041 |
||||
|
Number of subjects |
61 |
123 |
||||
|
Number of observations |
1220 |
2460 |
||||
|
Left censored observations |
653 |
1893 |
||||
|
Interval observations |
465 |
465 |
||||
|
Right censored observations |
102 |
102 |
||||
|
Log likelihood |
−847.642 |
−908.424 |
||||
The results in Table 5 largely confirm those of Table 4, with some qualifications. Firstly, the response to the contribution of the third player is positive and significant at every contribution level of the punisher. However, the null hypothesis that these coefficients are equal is rejected with marginal significance (p=0.073). The absolute negative deviation of the target below the punisher always has a sizable and significant positive effect on punishment; moreover the null hypothesis that this effect does not differ with the contribution of the punisher cannot be rejected (p=0.644). These two directional predictions of the FS model are thus confirmed at all levels of contribution by the punisher. Among those who contribute 0, is there is a significant negative response to positive deviations of the target above the punisher.Footnote 33 However for punishers who contribute 2 or 4, the responses to positive deviations are not significant. Accordingly, for this effect the null hypothesis of equal slopes is rejected (p=0.041).
7 Antisocial punishment
The preceding analysis highlights several related observations. Firstly, subjects who behave selfishly by contributing 0 do not necessarily refrain from punishing others. Conversely, those who make the maximum contribution do not necessarily escape punishment. Thus the strategy method detects “antisocial punishment”. Following HTG, define antisocial punishment as any nonzero punishment of a target who contributes at least as much as the punisher,Footnote 34 with the effect of increasing the advantageous earnings differential of the punisher over a target whose earnings before punishment were already weakly lower. Any nonzero punishment by a subject who contributes 0 is thus by definition antisocial, and conversely, the greater a subject’s own contribution, the fewer of that subject’s punishment decisions are potentially antisocial.
Since HTG find that antisocial punishment varies considerably across cultures, the motivation behind it may also vary and therefore the findings from any single subject pool can never be definitive. Nonetheless, the results of the present study generally do not support the conjecture that antisocial punishment is targeted specifically toward high contributors, as implied by the hypothesis of “do-gooder derogation” (Cinyabuguma et al. Reference Cinyabuguma, Page and Putterman2006, p. 268; HTG, p. 1366; Monin Reference Monin2007). If anything, the results indicate that antisocial punishment decreases as the contribution of the target rises.Footnote 35
More definitive evidence can be found through direct examination of the data. In total, there are 567 nonzero punishments assigned in 375 decision cases by 61 subjects (out of 123). However, there are only 7 decision cases (involving 3 punishers) in which a target who contributes strictly more than the third player is assigned strictly greater punishment than the third player. Likewise, there are only 5 cases (involving 2 punishers) in which the strictly highest contributor is the sole target of punishment. These findings indicate that the singling out of high contributors for antisocial punishment is a relatively rare occurrence.
Thöni (Reference Thöni2011) identifies theoretical conditions in which antisocial punishment may be motivated by inequality aversion. These relate to cases where a punisher wishes to target a low contributor, but fears that a high-contributing third player may be unwilling to join in punishing the low contributor. In this case, the punisher may elect to punish both other players. Here, the motive for punishing the high contributor is to avoid falling behind that player’s earnings on account of their unwillingness to share in the cost of punishment. However, Thöni examines data from several studies including Fehr and Gächter (Reference Fehr and Gächter2002) and HTG, and finds that most antisocial punishments are not compatible with this hypothesis.
The data in the present study can also be examined for evidence of Thöni’s inequality aversion hypothesis. In this context, an advantage of the strategy method is that it ensures that every subject is exposed to the full set of potentially antisocial punishment opportunities. As a precondition for the punishment envisaged by Thöni, it is necessary that there be both a strictly lower contributor who is the “true” target of punishment as well as a weakly higher-contributing “bystander” who is antisocially punished to avoid falling behind that player’s earnings. The data contain 280 decision cases involving 83 subjects (all those who do not contribute 0) in which a punisher is faced with both a strictly lower and a weakly higher contributing group member. In 154 cases neither player is punished, while in 102 cases only the lower contributor is punished. There are 3 cases (involving 1 punisher) in which only the weakly higher contributor is antisocially punished, inconsistent with Thöni’s hypothesis. Behaviour potentially compatible with Thöni’s hypothesis is found in 21 decision cases (involving 10 punishers) in which both a strictly lower and weakly higher contributor are punished. However, examining the other punishment decisions of these same 10 subjects casts doubt on this interpretation. In particular, there are 17 cases (involving 6 of these 10 punishers) in which these subjects assign nonzero punishment even when they are the weakly lowest contributor. Here, Thöni’s hypothesis does not provide any rationale for punishment.
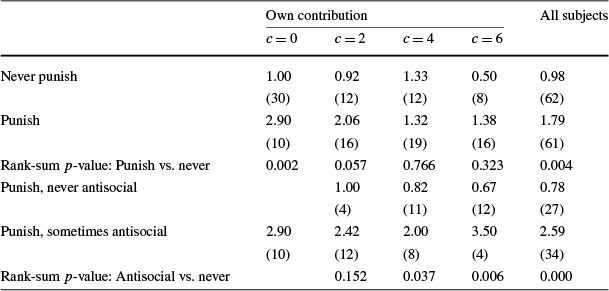
Recall that subjects’ beliefs were also elicited regarding the amount of punishment they expect to incur from others. These beliefs are summarised in Table 6. The results are broken down by the subject’s own contribution, whether or not the subject ever punishes, and whether or not the subject ever punishes antisocially. Two broad facts are evident from this analysis. Firstly, subjects who punish expect to incur more punishment from others than those who do not. Secondly, among subjects who punish, those who sometimes punish antisocially also expect to incur more punishment than those who do not. Both effects are highly significant in Wilcoxon rank-sum tests when the data are pooled over all levels of contribution of the punisher (p≤0.004).
Table 6 Mean beliefs regarding punishment incurred in the game with punishment (numbers in parentheses represent numbers of observations)
|
Own contribution |
All subjects |
||||
|---|---|---|---|---|---|
|
c=0 |
c=2 |
c=4 |
c=6 |
||
|
Never punish |
1.00 |
0.92 |
1.33 |
0.50 |
0.98 |
|
(30) |
(12) |
(12) |
(8) |
(62) |
|
|
Punish |
2.90 |
2.06 |
1.32 |
1.38 |
1.79 |
|
(10) |
(16) |
(19) |
(16) |
(61) |
|
|
Rank-sum p-value: Punish vs. never |
0.002 |
0.057 |
0.766 |
0.323 |
0.004 |
|
Punish, never antisocial |
1.00 |
0.82 |
0.67 |
0.78 |
|
|
(4) |
(11) |
(12) |
(27) |
||
|
Punish, sometimes antisocial |
2.90 |
2.42 |
2.00 |
3.50 |
2.59 |
|
(10) |
(12) |
(8) |
(4) |
(34) |
|
|
Rank-sum p-value: Antisocial vs. never |
0.152 |
0.037 |
0.006 |
0.000 |
|
Subjects who contribute 0 are of particular interest since for them all punishments are by definition antisocial. Subjects who contribute 0, but do not punish, expect on average to incur 1 punishment point. On the other hand, subjects who contribute 0 and who punish expect on average to incur 2.9 punishment points.Footnote 36 This difference is highly significant, with p=0.002 in a Wilcoxon rank-sum test. This result is compatible with pre-emptive retaliation against anticipated punishment from others as one explanation for antisocial punishment (although it could also be attributable to self-serving beliefs or a “false consensus” effect).
8 Conclusion
Through the systematic application of the strategy method, this paper makes several new contributions to understanding behaviour in voluntary contribution experiments both without and with punishment. A unifying theme is that both conditional cooperation and punishment respond not only to the average level of others’ contributions, as widely presumed in the past, but also to independent variation in the individual contributions that make up that average. Moreover, the directions of the observed effects are consistent with the predictions of the FS model of inequality aversion, at least at an aggregate level. These effects could not be observed in previous studies of conditional cooperation that employed restricted versions of the strategy method, or in previous studies of punishment in public good experiments that relied upon the direct-response mode of elicitation. Finally, the data also contribute to our understanding of the motives for antisocial punishment.
At the same time, it is appropriate to acknowledge some potential qualifications and open questions. Firstly, this paper has not pursued the possibility of differences in responses elicited under the strategy and direct-response methods (Brandts and Charness Reference Brandts and Charness2011), instead focusing on the comparative statics revealed within a strategy method design. However this leaves open the possibility that there may be a difference in levels, and this may matter importantly in certain applications (for example Fischbacher and Gächter Reference Fischbacher and Gächter2010) where data from the strategy method are used to shed light upon the dynamics of behaviour in repeated games played under direct response. Moreover, whereas the strategy method for contributions—in the restricted form conditional on averages as pioneered by FGF—has been thoroughly validated by a decade of subsequent research, this is not the case for the application to punishment. Indeed, Brandts and Charness identify punishment as one domain in which they suspect the strategy method to have an effect, with levels of punishment tending to be lower than under direct response. Finally, to permit a full application of the strategy method it was necessary to simplify the decision environment by reducing both the number of players and size of the action space, and this may inhibit the comparability of the results to those obtained under more familiar designs. Unfortunately, this would appear to be unavoidable, given that a full application of the strategy method in the standard environment (comprising four players and 21 actions) is clearly intractable.
Acknowledgements
I thank the Editor David Cooper, anonymous referees, Michele Bernasconi, Bram Cadsby, Gary Charness, Ananish Chaudhuri, Simon Gächter, Glenn Harrison, Danielle Merrett, Peter Moffatt, Nikos Nikiforakis, Charles Noussair, Stefan Palan, Robert Slonim, Christian Thöni, Marie Claire Villeval, and Tom Wilkening. I also thank seminar audiences at The University of Sydney and Tilburg University, and participants at the VII LabSi Workshop on Experimental and Behavioural Economics in Siena in April 2010, the International Conference of the Economic Science Association in Copenhagen in July 2010, the Fifth Australia and New Zealand Workshop on Experimental Economics in Sydney in November 2010, and the Asia-Pacific Meetings of the Economic Science Association in Xiamen in December 2011. Finally I thank Tim Capon and Min-Taec Kim for lab assistance, and The University of Sydney for financial support. An early draft of this paper circulated under the title “Conditional punishment and cooperation: A strategy method public good experiment”.


 Open access