


1. INTRODUCTION
According to many contemporary researchers and experts in marine navigation the International Regulations for Preventing Collisions at sea (COLREGS, 1972) are too often misinterpreted. The results are incorrect decisions made by students of nautical schools and experienced seafarers alike. Salinas (Reference Salinas2006) investigates this problem and analyses the case of Rule 19 – Conduct of Vessels in Restricted Visibility. Among others, he states that ‘this misinterpretation could be reinforced with the use of the ARPA’. The author further explains: ‘In both circumstances, good and poor visibility, the screen display is practically the same. So the OOW (Officer of the Watch) is again in front of a screen which shows echoes, sometimes crossing, overtaking, or heading-on, and he instinctively wonders why not use the head-on, crossing and overtaking rules that produce quite good results in conditions of good visibility and which are, moreover, quite accurate, to the contrary of what is stated in paragraph d of Rule 19, where instead of saying positively what must be done, it is stated what must be avoided.’ Similarly, Kemp (Reference Kemp2009) inspects behaviour patterns in crossing situations and observes that misinterpretation or even disregard of COLREGS occurs also in good visibility conditions: e.g. turning to port against Rule 17. Radar displays are not blamed this time, but Hadnett (Reference Hadnett2008) has no doubts whatsoever that their use contributes to the reduction in watch-keeping standards (among others, he mentions misunderstanding of Rule 19). He argues that ‘the equipment has engendered over-confidence in situational awareness, encouraging individuals to take far greater risks than was previously the case where a good look out and safe speed were an intrinsic part of watch-keeping’. This opinion, however, does not prevent researchers on the other side of the fence from coming up with new ideas on the development of navigational tools, including new displays. It certainly did not stop Holder and Pecota (Reference Holder and Pecota2011) from proposing a marine head-up display (HUD) in the form of a ‘pair of glasses connected wirelessly to the control unit’. And one can expect similar solutions to thrive following the development of Google Glass and similar technologies. A ‘good look out’, so favoured by Hadnett, is coming back into fashion, though somewhat redefined.
The proposal presented in this paper is rather conservative in comparison. Salinas’ (Reference Salinas2006) arguments lead the current authors to the conclusion that it is reasonable to propose a display which apart from visualising physical data also provides navigators with an on screen reminder of what COLREGS say about a particular encounter situation. A display which directly addresses Salinas' remarks: it is not the same for good and bad visibility and it does inform positively what should be done. The proposed display offers three types of information:
• targets' motion parameters (typical for target tracking),
• combinations of own course and speed which collide with those targets (typical for Collision Threat Parameters Areas (Lenart, Reference Lenart1983) and Collision Danger Sectors (Qiao and Pedersen Reference Qiao and Pedersen2004, Qiao et al., Reference Qiao, Pedersen, Okazaki, Fukuto and Tanaka2006)),
• combinations of own course and speed which are not compliant with COLREGS for this encounter (based on ships' motion parameters and visibility conditions).
A superposition of the last two types of data enables a navigator to quickly choose a collision avoidance manoeuvre which is both sufficient and COLREGS-compliant. Additionally, the displayed data may be filtered based on the time remaining to collision so that navigators could concentrate on direct threats. The rest of the paper is organised as follows. In Section 2 a summary of past and present approaches to radar displays is presented and Collision Threat Parameters Area technique is recalled. In Section 3 the proposed new display and its two working modes (for good and restricted visibility respectively) are described. Finally, a summary and conclusions are presented in Section 4.
2. A BRIEF HISTORY OF RADAR DISPLAYS WITH TARGET INFORMATION
Automatic Radar Plotting Aids (ARPA) and other radar displays with target information are now more than half a century old. An electronic plotting board was designed in 1962 and patented three years later (Birtley, Reference Birtley1965). Its functionality was however limited to displaying velocity vectors of target vessels. In the early 1970s it was extended and new displays developed by Sperry Ltd also featured Potential Points of Collision (PPC) and Predicted Areas of Danger (PADs) – areas that should be avoided by own ship so as not to collide with other ships or stationary targets. They were circular at first (Riggs, Reference Riggs1973), but were soon updated to be elliptical with the major axis of the ellipse aligned with the predicted track (Fleischer et al., Reference Fleischer, Lipsky and Tiblin1973). This was followed by introducing more precise but less regular shapes of PADs (O'Sullivan, Reference O'Sullivan1982). Suggestions to reshape PADs were made by Zhao-lin (Reference Zhao-lin1988). PAD-featured displays have been evolving since then: the PAD boundary was a polygon in Hakoyama et al. (Reference Hakoyama, Kato, Maeda and Yamaguchi1996) and a smooth curve in Wood and Yancey (Reference Wood and Yancey2002). PAD-related approaches include Predicted Capability Envelope (van Breda, Reference van Breda2000). The common feature of all PADs was that they marked danger areas and thus they provided data for determining a collision avoidance manoeuvre. What they did not tell directly was which of the possible own velocity vectors (combinations of course and speed values) are safe and which are not. A technique that offered precisely that was Collision Threat Parameters Area (CTPA). The CTPA displaying technique was introduced in 1983 (Lenart, Reference Lenart1983). Similarly to PAD, a collision threat is defined there as a target for which:
 $$DCPA \lt {D_s},$$
where DS = minimum safe distance.
However, unlike PAD, the CTPA method uses a double Cartesian coordinate system where the horizontal axis represents both the x coordinate of position and V X coordinate of speed and the vertical axis represents both the y coordinate of position and V Y coordinate of speed. The relation between the position and speed coordinates is:
 $$\eqalign{& x = {V_x}\ast \tau, \cr & y = {V_y}\ast \tau,} $$
where τ = a fixed time value, e.g. 12 minutes.
For a single target vessel CTPA is defined as an area in the abovementioned system of coordinates where the tip of the own velocity vector should not be placed, because it would result in violating the safe distance DS between the ships. The method is summarised by Figure 1, where CTPA is the area between the two lines of DCPA = Ds and the target's velocity is denoted by V.

Figure 1. The Collision Threat Parameters Areas method.
For a group of target ships CTPA is defined as a superposition of the CTPAs obtained for each of the targets separately. The formulae for the two straight lines (DCPA = Ds) determining the boundaries of the CTPA for a given single target are given in Lenart (Reference Lenart1999) and are recalled in Szlapczynski (Reference Szlapczynski2009) among others. In practice CTPA is only the part of the determined area where the condition TCPA > 0 holds, since only future collision threats are of interest. In case of encountering many targets, the manoeuvres violating the safe distance D S may be conditionally allowed, if TCPA is large enough and there is no possibility of avoiding all targets with just one economical manoeuvre. In such cases the tip of the own velocity vector may be temporarily placed within this part of the CTPA, for which TCPA is larger than a critical time T C (that is between the lines of DCPA = Ds and inside the circle of TCPA = TC). The main advantage of the method is that it enables the operator to manually choose a safe own velocity vector in a very easy way – it is enough to select a point outside the CTPA (outside the lines of DCPA = Ds) and read its velocity coordinates.
Contemporary displays based on CTPA, featuring cone-shaped Collision Danger Sectors (CDS) and Collision Danger Lines (CDL) have been presented in Qiao and Pedersen (Reference Qiao and Pedersen2004) and Qiao et al. (Reference Qiao, Pedersen, Okazaki, Fukuto and Tanaka2006). In Pedersen et al. (Reference Pedersen, Inoue and Tsugane2003) the authors have presented the results of an experiment comparing the efficiency of use of a classic display and a CTPA-based display referred to as Collision Danger Presentation (CDP). Unsurprisingly, the results have showed the superiority of the CTPA-based display. For uncomplicated traffic: ‘the majority of the subjects in the CDP groups maintained the required minimum safety distance of 0·5 Nm and also carried out slightly more homogeneous manoeuvres than the ARPA group’. For complicated traffic: ‘CDP groups made the initial evasive manoeuvre significantly more quickly and distinctly than the reference group’. The authors have also observed that ‘the CDP display's superiority increases with the excess speed of own ship and with traffic density’. It must be emphasised here that the ‘CDP groups’ (subjects using a CTPA-based display) had only a very short practical training (10–15 minutes) prior to carrying out the experiment and it is possible that their performance would be even better after longer training. The only serious drawback to the CTPA-based display was that occasionally the subjects made ‘evasive manoeuvres in relation to more distant targets, thus violating the required minimum passing distance (0·3 Nm) to the closest target(s)’. This problem can be easily solved by filtering the displayed data, based on the remaining Time To Collision (TTC). It will be demonstrated in sections to follow, where the proposed new display method, based on CTPA, will be presented.
3. THE PROPOSED DISPLAY
The main idea of the proposed display is combining the CTPA-display technique described in Section 2 with COLREGS rules. As for the CTPA part, it is generalised in the presented approach. That is, instead of a safe distance DS, a ship domain is used and instead of DCPA – a domain-based approach factor is applied (Szlapczynski, Reference Szlapczynski2006). It has the benefit of reflecting the fact that collision risk is not the same for the same distance but various bearings. Also, by using a target domain with a larger starboard sector than port sector and larger bow sector than astern sector we naturally favour manoeuvring to starboard and crossing astern instead of ahead. As for the COLREGS part of the proposed display method, there are two working modes: good visibility mode and restricted visibility mode. The first one is dedicated to vessels in sight of one another, whose conduct is governed by Rules 11 to 18. Of these, Rules 13 to 17 (‘Overtaking’, ‘Head-on situations’, ‘Crossing situations’, ‘The give-way vessel’, ‘The stand-on vessel’) are directly reflected in the method and exemplified in Sub-section 3.1. The restricted visibility mode is based on Rule 19 of COLREGS. For this paper two extracts from Rule 19 are of major importance:
• “avoid any turn to port for a vessel detected forward of the beam, except for a vessel being overtaken” and
• “avoid any change of course toward a vessel abeam or abaft the beam”.
The proposed displaying method takes the following input parameters:
• a time value τ, which combines coordinates of target relative position and own velocity vector (one hour by default),
• time for accepting a manoeuvre by the navigator (three minutes by default),
• the own ship dynamic parameters used to determine the time necessary to change course or speed (angular turning speed and acceleration/deceleration),
• domain violation time range (only domain violations that would occur within this time are displayed so the navigator could focus on direct threats),
• COLREGS threshold time/distance – if the time to collision or distance between ships is smaller than the threshold value, manoeuvres not compliant with COLREGS are marked on the display (separate values of thresholds may be set for various visibility conditions and encounter types),
• course change, speed change and “look ahead” time in case of a manoeuvre simulation mode.
For the assumed functional scope (ship domains, manoeuvre's dynamics etc.) it is impossible to determine CTPAs analytically the way it was done in the original method by Lenart (Reference Lenart1983). Therefore, they are determined numerically. The proposed method works as follows.
1. For a given time value τ each pixel on the display is associated with a combination of course and speed values. Based on these values and the method's input parameters, the time that it would take to change own course and speed from the current values to these new values is determined.
2. For these time, course and speed values it is determined for all targets whether the own ship would not violate their domains. If it would, a degree of domain violation is registered. In case of multiple domain violations, the largest of the determined degrees of domain violation is registered. In case of time filtering being turned on (domain violation time range parameter), only domain violations that would occur in a predefined time are taken into account.
3. If the current course and speed collide with one or more targets, violations that would occur within threshold time are taken into account and COLREGS-forbidden sectors are determined for them based on visibility conditions and encounter type (head-on, crossing or overtaking in case of good visibility; target's relative position in case of restricted visibility).
4. All danger sectors are displayed, including CTPA-based domain violation sectors and COLREGS-forbidden sectors. Critical domain violations (potentially leading to a crash) are marked in red, other domain violations (probably leading to close-quarter situations) are marked in pink. COLREGS-forbidden sectors are marked as light blue. The remaining white area (safe combinations of own course and speed) may be interpreted as possible collision avoidance manoeuvres. It is assumed that course alterations should not be smaller than some minimum value (15° by default).
The method has been implemented as a computer demonstrative application and examples of encounter situations are presented and depicted in two subsections below. For all situations an elliptically-shaped domain, similar to that proposed in Coldwell (Reference Coldwell1983), is used. By default, the domain is larger than the one proposed by Coldwell to compensate for significant distance and speed errors in Target Tracking systems (Pedersen et al., Reference Pedersen, Arai and Sato1999; Lenart, Reference Lenart2005). In practice the proposed display would be a part of system including a radar/Automatic Identification System (AIS) data fusion unit and the input data for the method would be a result of data fusion operations (Stateczny and Kazimierski, Reference Stateczny and Kazimierski2011; Zhao et al., Reference Zhao, Ji, Xing, Zou and Zhou2014a; Zhao et al., Reference Zhao, Ji, Xing, Zou and Zhou2014b). In case of a strong correlation between the radar and AIS data, the assumed accuracy would be higher and consequently a smaller ship domain then would be used.
The time value τ is set to one hour (to make the sectors and vectors larger in all figures). If the target's relative velocity vector crosses own ship domain, it means that own domain would be violated within τ time. The own ship is always in the centre of the display, surrounded by solid grey circles, which mark 8, 16 and 24 Nm distances from the own ship in good visibility mode or 4, 8 and 12 Nm distances in restricted visibility mode (when smaller speeds and smaller distances are expected). A dashed black circle marks own speed to make it easier to find a course alteration manoeuvre without a change in speed. The current or potential future course and speed are safe and COLREGS-compliant if the tip of own velocity vector is in the white area.
3.1. Good visibility mode
In Figures 2 to 4 examples of ship encounters in good visibility are presented. For this generalisation of CTPA, outer borders of the pink area (domain violations) are an equivalent of lines DCPA = Ds from Figure 1.

Figure 2. A crossing encounter with a target on starboard.

Figure 3. An encounter with four targets (time filtering turned off).

Figure 4. An encounter with four targets (time filtering set to 1 hour).
In Figure 2 a crossing encounter with a single target is presented. The target is approaching from starboard and the own ship is a give-way vessel. The blue area eliminates manoeuvres to port and course alterations of less than 15°. In Figures 3 and 4 the same encounter of four targets is shown. The own ship must avoid a head-on collision, but the targets to starboard make it difficult to manoeuvre to starboard without increasing own speed – the necessary course alteration would be nearly 75° (Figure 3). However, after turning the time filtering on (domain violation time range set to one hour in Figure 4) it occurs that targets to starboard are not direct threats. It is possible to turn to starboard by only 15° (a part of the dotted circle of the own speed is on the white area), because a potential collision with the first of the starboard targets will not happen within an hour (Figure 4).
3.2. Manoeuvre simulation in good visibility mode
In both good visibility and restricted visibility modes the method makes it possible to visualise the effects of a planned manoeuvre. For a specified combination of course change and speed change it will be shown how the situation will develop after a specified time. In the case of the encounter presented in Figures 3 and 4 two possible manoeuvres are visualised. The results of turning to starboard by 15° and keeping this course for 30 minutes are shown in Figure 5. The effect of turning to starboard by 75° and keeping that course for 30 minutes is depicted in Figure 6.

Figure 5. An encounter with four targets after 30 minutes from manoeuvring to starboard by 15°.

Figure 6. An encounter with four targets after 30 minutes from manoeuvring to starboard by 75°.
In the first case (Figure 5) the own ship is safely passing the closest target (neither of the ships violates the other ship's domain). However, the current course of the own ship collides with one of the targets on starboard and has to be changed to starboard by either 60° (placing the tip of the own speed vector in the white area between the targets on starboard) or by 105°. In comparison, in Figure 6 one can see that after the initial turning to starboard by 75°, the own course is now safe and no further alterations are necessary.
3.3. Restricted visibility mode
Examples of encounter situations are presented in Figures 7 to 10, with the target's courses being multiples of 45°. The domain used here is the same as the one used for good visibility mode. Its dimensions are compliant with the 2 to 3 Nm safe distance in restricted visibility suggested in Cockcroft and Lameijer (Reference Cockcroft and Lameijer2011), where it is stated that a smaller distance may be considered as a close quarters situation. A threshold distance of 8 Nm is used for displaying COLREGS-forbidden sectors. By default the time filtering (domain violation time range) is turned off, that is, all future domain violations are shown.

Figure 7. An encounter in restricted visibility (target's course = 90°).

Figure 8. An encounter in restricted visibility (target's course = 135°).

Figure 9. An encounter in restricted visibility (target's course = 315°).

Figure 10. An encounter in restricted visibility (target's course = 45°).
In Figures 7 and 8 encounters with targets to port are shown. Since the targets are forward of the beam, only manoeuvres to starboard are possible. The approximated values of safe course alterations are: about 70° to starboard for both Figure 7 and Figure 8. A reduction of speed (from 5 to about 2·5 knots) is also possible for Figure 7.
In Figures 9 and 10 the own ship has a target abaft her beam, so manoeuvres towards the target should be avoided. Thus possible course alterations are about 30° to port for Figure 9 and 40° to starboard for Figure 10. A reduction of speed to about 2·5 knots or a combination of course alteration and speed reduction are also possible for Figure 9 (e.g. course: 15° to port, speed: down to 3 knots).
In Figures 11 and 12 the last of the examples is shown. This time the own ship is encountering three targets, with one of them approaching head-on. In Figure 11 there is almost no white area except the bottom right quarter, which suggests that a course alteration of about 105° to starboard is necessary. However, after turning the time filter on (showing only domain violations to happen within one hour), it becomes clear that only the head-on target is a direct threat. The course may be changed to about 45° to starboard (as shown by white part of the own speed circle in Figure 12) and kept for some time before it will have to be changed again.
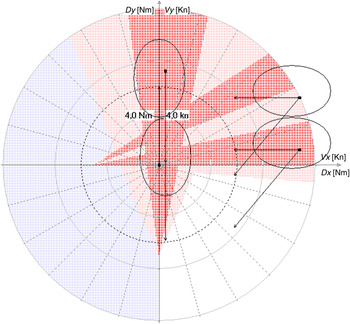
Figure 11. An encounter with three targets in restricted visibility (time filtering turned off).

Figure 12. An encounter with three targets in restricted visibility (time filtering set to one hour).
3.4. Manoeuvre simulation in a restricted visibility mode
Two possible manoeuvres are visualised for the encounter shown in Figure 12. The results of turning to starboard by 45° and keeping this course for 30 minutes are shown in Figure 13. The effect of turning to starboard by 105° and keeping that course for 30 minutes is depicted in Figure 14.

Figure 13. An encounter with three targets after 30 minutes from turning to starboard by 45°.
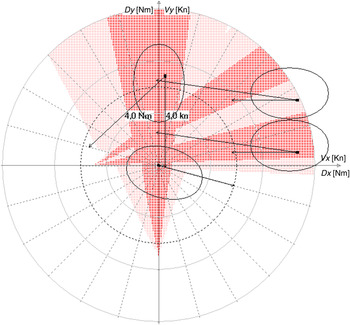
Figure 14. An encounter with three targets after 30 minutes from turning to starboard by 105°.
In the first case (Figure 13) the own ship may find herself in a deadlock situation if neither of the targets to her starboard manoeuvres. In the second case (Figure 14) the new course will be a safe one even if none of the targets manoeuvres.
4. SUMMARY AND CONCLUSIONS
The paper introduces the authors' approach to displaying information in encounter situations: offering direct physical data (motion parameters), interpreted data (dangerous combinations of own course and speed) and conditional data (manoeuvres compliant with COLREGS in either good or restricted visibility). Additionally, the method features a manoeuvre simulation mode, in which the navigator is able to see the results of a planned manoeuvre in advance: ship motion parameters and dangerous combinations of own course and speed after a specified time. The proposed displaying method is described and a set of examples covering typical encounter situations is used to illustrate the authors' thesis: by visualising all three types of information simultaneously the proposed display should enable navigators to make safe decisions faster.


