To increase the adsorption capacity and reduce the treatment time of contaminated water, nano-sized adsorbents have been designed. Clay minerals, especially those belonging to the smectite group, are suitable materials for the design of nanoadsorbents. The use of smectites was justified by their nanostructure and relatively large specific surface area and cation exchange capacity (CEC), as well as their ability to accept chemical species in the interlayer space. Stevensite is a trioctahedral smectite that might interact spontaneously with cationic chemical pollutants (heavy metals, basic dyes) and some polarized organic molecules. However, because of its negative charge, due to vacancies in the octahedral sheet, the adsorption of anionic chemical species such as chromate is very limited (Ren et al., Reference Ren, Zhang, Luoa, Huc, Dang, Yanga and Li2014; Shokri et al., Reference Shokri, Yegani and Akbarzadeh2017). To overcome such limitations and enhance the uptake of various chemical pollutants, smectite (e.g. montmorillonite) has been the subject of various modifications (acid or alkaline etching, intercalation, etc.) (Heinz, Reference Heinz2012; Lee & Tiwari, Reference Lee and Tiwari2012; Mache et al. Reference Mache, Signing, Mbey, Razafitianamaharavo, Njopwouo and Fagel2015; Chang et al., Reference Chang, Ma, Ma, Zhang, Qiao, Hu and Ma2016; Krupskaya et al., Reference Krupskaya, Zakusin, Tyupina, Dorzhieva, Zhukhlistov, Belousov and Timofeeva2017).
Hexavalent chromium (CrVI) is a powerful oxidant and is highly toxic to human beings (Saha et al., Reference Saha, Nandi and Saha2011; Zhitkovich, Reference Zhitkovich2011). CrVI is encountered in effluents of leather tanning, dyeing and electroplating, among others. It is mostly present in the form of anions (CrO42–, Cr2O72–, HCrO4–), which are highly mobile species in aqueous solutions and might easily enter groundwater (Zhitkovich, Reference Zhitkovich2011). To comply with the international recommendations (WHO, 2003), CrVI-containing effluents must be remediated. The permissible amount of total chromium in drinking water is <0.05 mg/L (WHO, 2003).
Removal of CrVI might be achieved by adsorption, which has proven to be an efficient and popular remediation process (e.g. Fu & Wang, Reference Fu and Wang2011). Activated carbon is a versatile adsorbent, but in order to find suitable local alternatives, many adsorption studies have been undertaken on natural or modified geomaterials including clays (Akar et al., Reference Akar, Yetimoglu and Gedikbey2009; Ajouyed et al., Reference Ajouyed, Hurel, Ammari, BenAllal and Marmier2010; Santhana et al., Reference Santhana, Kumar, Ramachandran, Kalidhasan, Rajesh and Rajesh2012; Setshedi et al., Reference Setshedi, Bhaumik, Songwane, Onyango and Maity2013; Zhao et al., Reference Zhao, Yang, Ding, Chen, Yang, Lei, Feng and Zhang2013; Hajjaji & Beraa, Reference Hajjaji and Beraa2015; Rathnayake et al., Reference Rathnayake, Martens, Xi, Frost and Ayoko2017). However, little attention has been paid to the use of nanocomposites of clays and dendrimers.
Methylene blue is an organic cationic colorant used in the dyeing of textiles. MB-rich effluents have adverse effects on fauna and flora (Sarkar et al., Reference Sarkar, Xi, Megharaj, Krishnamurti, Rajarathnam and Naidu2010). The harmful effects of MB on human beings manifest themselves as the dose exceeds 2 mg/kg. The removal of MB from aqueous solutions by clay minerals, particularly those belonging to the smectite group, has been studied extensively (Cottet et al., Reference Cottet, Almeida, Naidek, Viante, Lopes and Debacher2014; Ranđelović et al., Reference Ranđelović, Purenović, Matović, Zarubica, Momčilović and Purenović2014; Chang et al., Reference Chang, Ma, Ma, Zhang, Qiao, Hu and Ma2016; Chakraborty et al., Reference Chakraborty, Singha, Chianelli, Hansda and Paul2017). However, few investigations have been carried out on the adsorption of MB by stevensite (Bouna et al., Reference Bouna, Rhouta, Amjoud, Jada, Maury, Daoudi and Senocq2010).
Phosphorus-based dendrimers are synthesized macromolecules with a spherical shape and branches emanating radially from a central core (Caminade & Majoral, Reference Caminade and Majoral2016). They are nano-sized materials and can have peripheral cationic groups such as ammonium groups (Padié et al., Reference Padié, Maszewska, Majchrzak, Nawrot, Caminade and Majoral2009) that may be attached spontaneously to clay mineral particles. Hence, new hybrid materials with specific adsorptive properties can be formed.
This work is complementary to our studies related to the adsorption abilities of phosphorus dendrimers-containing organoclays (Beraa et al., Reference Beraa, Hajjaji, Laurent, Delavaux-Nicot and Caminade2016, Reference Beraa, Hajjaji, Laurent, Delavaux-Nicot and Caminade2017). In this study, the kinetics and the equilibrium processes of the adsorption of chromate and MB on organoclays of stevensite-rich clays and phosphorus dendrimers and on Na+-saturated clays are investigated at varying temperature gradients. In addition, the adsorption mechanisms are discussed in relation to the results of the structural characterization of stevensite.
MATERIALS
Dendrimers
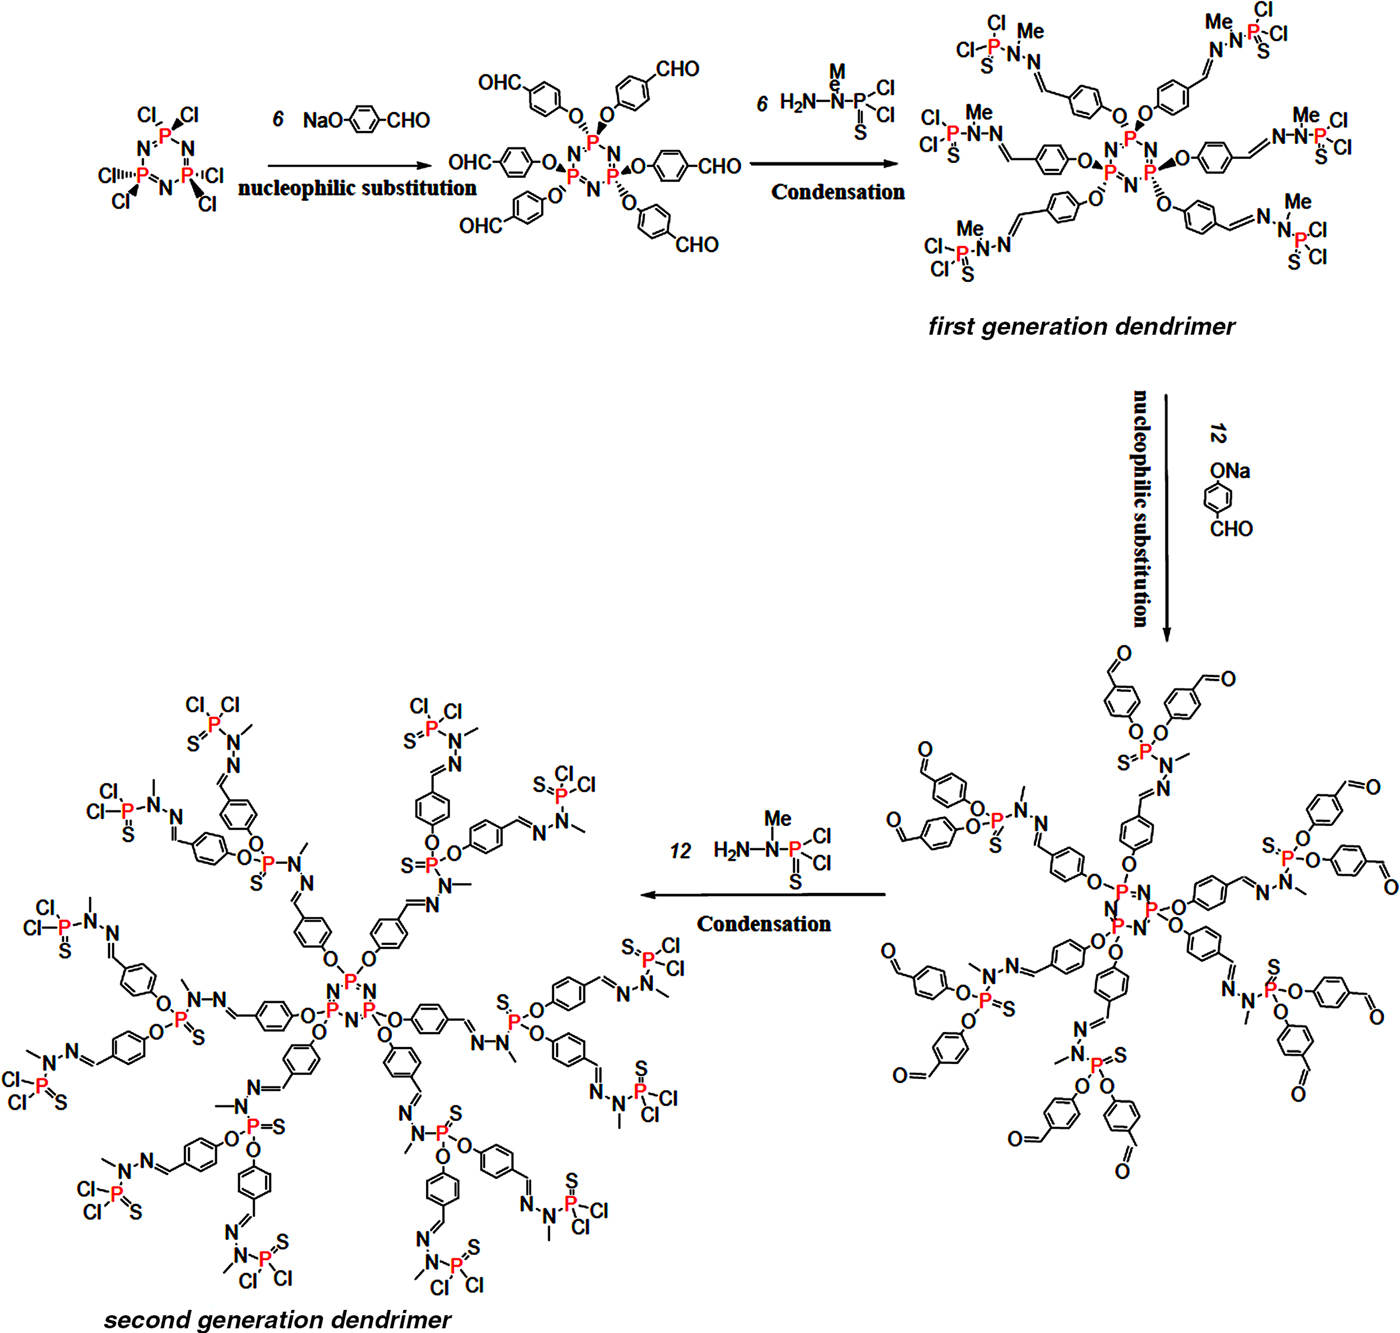
The first and second generations (GC1 and GC2, respectively) of phosphorus-based dendrimers were synthesized by a divergent method following the reaction paths illustrated in Fig. 1. Details of the experimental protocol were given by Caminade & Majoral (Reference Caminade and Majoral2016). To obtain water-soluble and positively charged dendrimers, the terminal groups of the dendrimers were substituted with ammonium groups using N,N-diethylethylenediamine as a reactant. The cationic dendrimers obtained were freeze-dried and stored in a drying oven at 80°C.

Fig. 1. Schematic representation of the reaction paths of the synthesis of the first- and second-generation dendrimers (GC1 and GC2).
The hydrodynamic radii (RH) of GC1 and GC2 were 1.1 and 1.5 nm, respectively. Details of the determination of RH are given below.
Clay characterization
The clay, referred to hereafter as R, was a commercial Fuller's earth used in traditional cosmetics preparations. It originates from Jbel Rhassoul (Morocco).
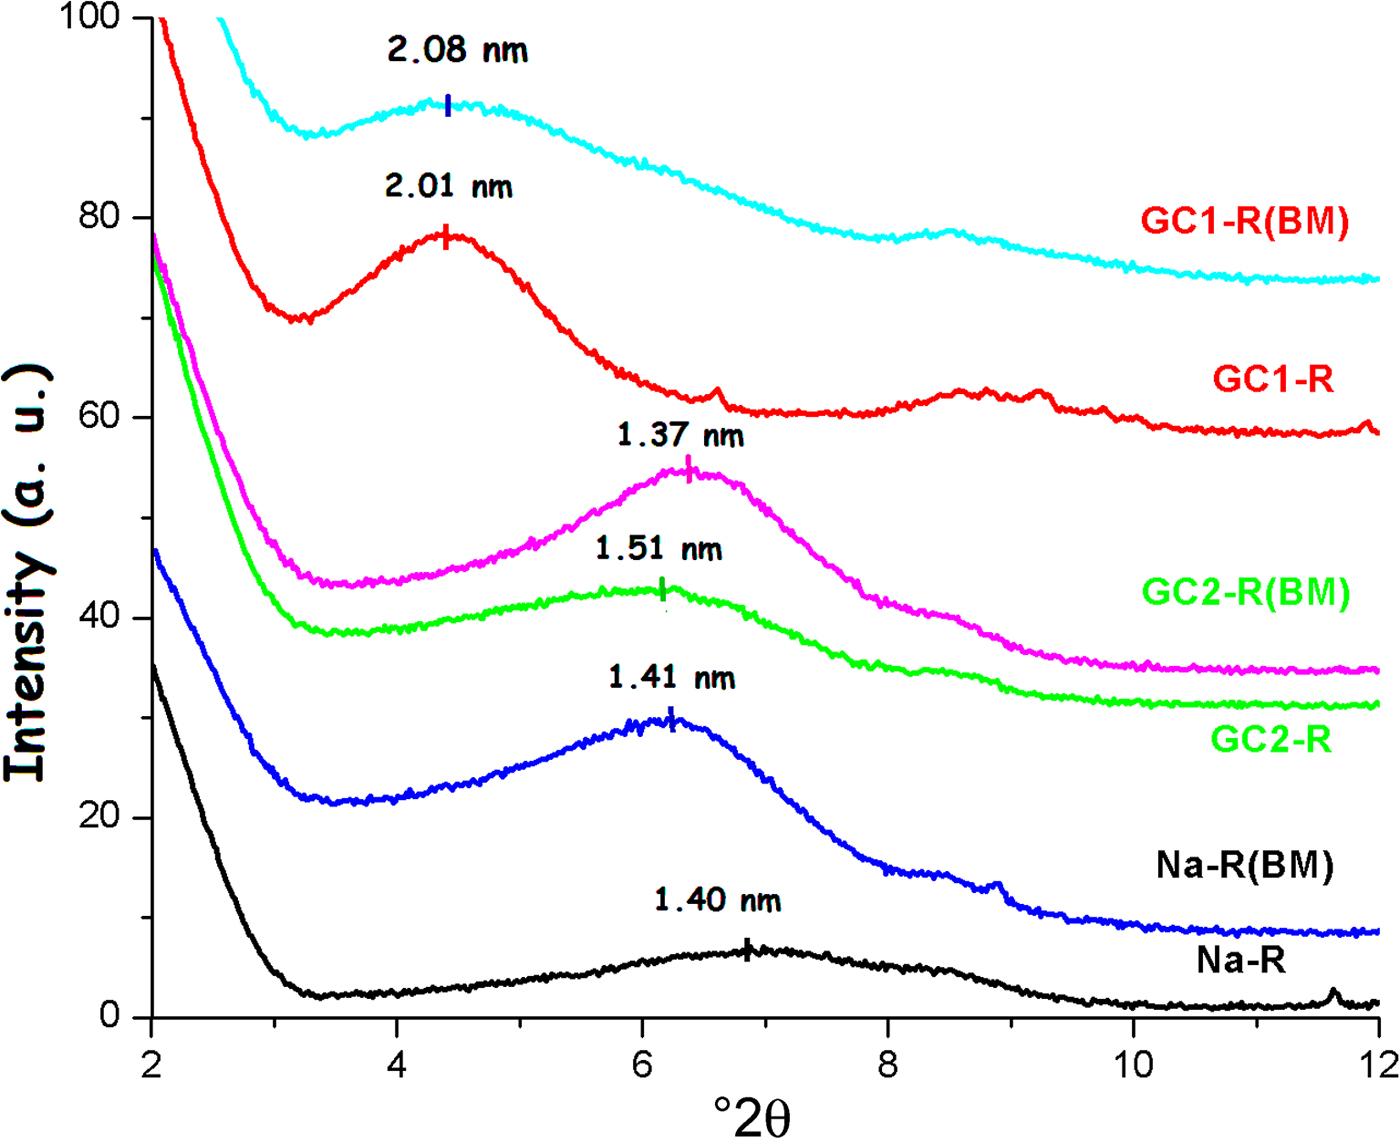
According to the clay characterization results reported by Christidis & Koutsopoulou (Reference Christidis and Koutsopoulou2013) and based on the X-ray diffraction (XRD) trace (Fig. 2), the clay is composed of stevensite and non-clay minerals, mainly dolomite. The amount of stevensite estimated by the reference intensity ratio (RIR) method using the X'Pert HighScore software (e.g. Degen et al., Reference Degen, Sadki, Bron, König and Nénert2014) is 72%.

Fig. 2. XRD trace of the clay used (R). St = stevensite; G = gypsum; Q = quartz; C = calcite; F = K-feldspar; D = dolomite.
The presence of the main minerals identified was confirmed by the Fourier-transfrom infrared (FTIR) spectrum (Fig. 3).

Fig. 3. FTIR spectrum of the R clay. St = stevensite; W = water; C = carbonates (dolomite/calcite); S = silicate; Q = quartz.
The chemical composition of the clay given in Table 1 confirmed the magnesian character of the clay mineral identified, the presence of carbonate and possible substitution of Mg2+ by Al3+ in the octahedral sheet.
Table 1. Chemical composition and some physical properties of the clay used.
BET = Brunauer–Emmett–Teller specific surface area; CEC = cation exchange capacity.
The BET specific surface area and the CEC (Table 1) corresponded well with those of smectite clay materials, and they were in line with those reported for stevensite-rich clay (e.g. Elass et al., Reference Elass, Laachach, Alaoui and Azzi2011).
Referring to the International Union of Pure and Applied Chemistry (IUPAC) classification of adsorption isotherms (Al Othman, Reference Al Othman2012), the N2 adsorption/desorption isotherm of the clay (Fig. 4a) is type H4. Accordingly, the clay is considered a mesoporous material (Al Othman, Reference Al Othman2012).

Fig. 4. N2 adsorption/desorption isotherms of the clay (a) and plot of 1/(W[P/P o] – 1) vs. relative pressure (b).
Adsorbates
The MB used (C16H18N3SCl; MW: 319.86 g/mol, Merck) was of 95% purity. Potassium chromate (K2CrO4, Fisher Scientific) with >99% purity was the source of CrVI.
METHODS
Preparation of nanocomposites
A total of 0.5 g of dried cationic dendrimers (GC1 or GC2) was dissolved in 20 mL of warm water (353 K). The solution of the dendrimers obtained was mixed with 10 mL of a dispersion of Na+-saturated clay (3.5 g). The mixture with pH = 6.3 (natural pH) was stirred for 24 h at room temperature, and the solid fraction was separated by centrifugation and freeze-dried.
Referring to our previous study related to the characterization of the nanocomposites prepared (Beraa et al., Reference Beraa, Hajjaji, Laurent, Delavaux-Nicot and Caminade2017), these organoclays were composed of intercalated and exfoliated nanocomposites. The relative abundance of these nanocomposites depended on the size of the dendrimers.
Preparation of sodium-saturated clay
Portions (40 g) of the <80 µm fraction of R were added to NaCl aqueous solutions (0.5 M) and shaken for 24 h. The Na+-saturated clay was isolated by centrifugation (4000 rpm) and washed with distilled water until the rinse water was free of Cl– ions (AgNO3 test).
Kinetic experiments
The kinetic experiments of the adsorption of chromate on Na+-R, GC1-R or GC2-R were carried out on mixtures composed of 40 mL of a solution of K2CrO4 (0.04 mmol/L) and 16 mL of the dispersion (0.5 g/L) of the tested adsorbent. For the experiments involving MB, 40 mL of a solution of MB (0.04 mmol/L) were mixed with 16 mL of the dispersion of the enumerated adsorbents. The temperature of the mixture was kept constant at 298, 308 or 318 K. The pH of the mixture was adjusted to 4 by adding a few droplets of 0.1 M solution of HCl or NaOH. At this pH, the amounts of chromate and MB retained were relatively significant. The mixtures prepared were stirred with a laboratory magnetic stirrer at 250 rpm. Samples of the mixtures were taken out at regular times and were centrifuged immediately (4000 rpm) for <3 min. The amount of chromate in the isolated supernatant (C t; mmol/L) was determined with UV-visible spectrometry according to the experimental method described by Soares et al. (Reference Soares, Carneiro, Monteiro, Henrique, Pontes, Silva, Neto and Santelli2009). The quantity of chromate retained (q t; mmol/g) was deduced from equation 1:
 $$q_{t\;} = \displaystyle{{\lpar {C_{\rm o} - C_{\rm t}} \rpar V} \over m}$$
where C o (mmol/L) is the initial concentration of chromate, V is the volume of solution (L) and m is the weight of adsorbent (g).
The amount of MB retained was also determined according to equation 1. For this purpose, the amount of MB in the supernatant (C t) was measured at 664 nm with a UV-visible spectrophotometer, JP Selecta. For both studies, the experiments were run in duplicate.
Because of the shortcoming of using the linearized forms of the kinetic equations (e.g. Hossain et al., Reference Hossain, Ngo and Guo2013), the experimental kinetic data were analysed with the non-linear forms of the pseudo-first-order (equation 2) and the pseudo-second-order (equation 3) kinetic equations:
 $$q_{\rm t\;} = q_{\rm e\;} \; (1 - e^{ - {\rm k}_1t})$$
 $$q_{\rm t\;} = \; \displaystyle{{{\rm k}_2q_{\rm e}^2 t} \over {1 + {\rm k}_2q_{\rm e}t}}\; $$
where k1 and k2 are the pseudo-first-order and the pseudo-second-order rate constants, respectively, and q e is the uptake quantity of the adsorbate at equilibrium.
The non-linear regression analysis was performed using the solver add-in of Microsoft Excel™ (Hossain et al., Reference Hossain, Ngo and Guo2013). The best fit of the experimental and theoretical curves was reached with a trial-and-error procedure and was supported by the coefficient of determination (R2) according to equation 4:
 $$R^2 = 1 - \displaystyle{{\mathop \sum \nolimits {\lpar {q_{\rm t} - q_{\rm t}^c} \rpar }^2} \over {\mathop \sum \nolimits {\lpar {q_{\rm t} - q_{\rm t}^a} \rpar }^2}}$$
where q t and q tc are the experimental and calculated instantaneously retained quantities of adsorbate and q ta is the average of the values of q t.
The experimental values were also compared to the calculated ones by using the normalized standard deviation (NSD) (Hossain et al., Reference Hossain, Ngo and Guo2013):
 $$NSD = 100\sqrt {\; \displaystyle{1 \over {n - 1}}\; \mathop \sum \limits_1^n {\left[ {\displaystyle{{q_{\rm t} - q_{\rm t}^c} \over {q_{\rm t}}}} \right]}^2\;} $$
where n is the number of experimental runs. The best fit is indicated by the smaller value of NSD.
Batch adsorption equilibrium
For the plot of the equilibrium isotherms, aqueous mixtures composed of 40 mL of a solution of chromate or MB (10–3–8 × 10⁻² mmol/L), 16 mL of a solution (0.5 g/L) of Na+-R, GC1-R or GC2-R and 24 mL of distilled water were maintained at constant temperatures (298, 308 or 318 K) for 4 h. The mixtures were stirred (250 rpm) at constant pH 4. The amounts of chromate and MB retained at equilibrium (q e; mmol/g) were measured as reported previously.
Because of the limitations of using the linear forms of the equations of the adsorption isotherms (Hossain et al., Reference Hossain, Ngo and Guo2013), the isotherms of the adsorption of chromate and MB on the studied sorbents were fitted to the non-linear forms of the Langmuir model (equation 6; Langmuir, Reference Langmuir1918), the Freundlich model (equation 7; Freundlich, Reference Freundlich1907) and the Harkins–Jura model (equation 8; Harkins & Jura, Reference Harkins and Jura1943).
 $${\rm \;} q_{\rm e\;} = \; \displaystyle{{{\rm K}_{\rm L}q_{\rm e}^{\rm max} C_{\rm e}} \over {1 + {\rm K}_{\rm L}C_{\rm e}}}\; \; $$
 $$q_{\rm e\;} = {\rm K}_{\rm F}C_{\rm e}^{1/{\rm n}} $$
 $$q_{\rm e} = \left( {\displaystyle{{{B}^{\prime}} \over A} - \displaystyle{{logC_{\rm e}} \over A}} \right)^{ - 1/2}\; $$
where q e is the uptake amount at equilibrium, KL is the Langmuir constant, q emax is the adsorption capacity, KF is the Freundlich constant and n, A and B’ are constants.
These models were selected because of the different hypotheses about the adsorption mechanisms that are discussed below. The fitting of the models to the experimental isotherms was accomplished by the solver add-in of Microsoft Excel™. The degree of closeness of the experimental data to the predicted outcomes was also evaluated by calculating the residual root mean square error (RMSE) (Hossain et al., Reference Hossain, Ngo and Guo2013) (equation 9):
 $$RMSE = \; \sqrt {\; \displaystyle{1 \over {n - 1}}\; \mathop \sum \nolimits_1^n {(q_{\rm e}^{\rm exp} - q_{\rm e}^{\rm cal} )}^2\;} $$
where q eexp and q ecal are the experimental and the predicted uptake amounts at equilibrium. The best fit corresponds to the smaller value of RMSE.
Methods and investigation techniques
The hydronamic radius, RH, was calculated from the formula in equation 10 (e.g. Hameau et al., Reference Hameau, Fruchon, Bijani, Badrucci, Blanzat, Poupot, Pavan, Caminade and Turin2015):
 $$R_H = \displaystyle{{{\rm k}_{\rm B}T} \over {6\pi \, {\rm \eta}_{\rm s}D}}$$
where kB is Boltzmann's constant (1.38064852 × 10⁻²³ J K–1), T is the operating temperature (298 K), ηs is viscosity of the medium (tetrahydrofuran; ηs = 4.8 × 10⁻⁴ Pa s–1) and D is the diffusion coefficient (m2 s–1). For measurement of D, a NanoDLS particle size analyser (Brookhaven Instruments, Holtsville, NY, USA) was used. The apparatus was calibrated using 92 ± 4 nm NanoLatex, and the laser beam intensity was optimized automatically. The scattering angle was 90°, and the results were analysed with the method of cumulant (Mailer et al., Reference Mailer, Clegg and Pusey2015).
The CEC of the clay was measured using cobaltihexamine as an index cation (Aran et al., Reference Aran, Maul and Masfaraud2008). The uptake amount of cobaltihexamine was evaluated from the Beer–Lambert law using a UV-visible spectrophotometer, JP Selecta (λ = 476 nm) .
The BET specific surface area (A s) was calculated according to the equations 11 and 12:
 $$A_{\rm s} = \; \displaystyle{{W.N.A_{\rm c}} \over M}$$
 $$W = \; \displaystyle{1 \over {\lpar {S + I} \rpar }}$$
where S and I were determined from the plot of Fig. 4b by means of a Quantachrome Autosorb-iQ apparatus, using nitrogen as the adsorbate. N is Avogadro's number (6.022 × 10²³/mol), A c is the cross-section area of N2 (16.2 × 10⁻² nm2/molecule) and M = 28.013 g/mol.
The X-ray diffraction (XRD) analysis of the adsorbents before and after contact with chromate and MB was performed with an X'Pert-PRO diffractometer operating with a copper anode (Kα = 1.5418 Å) under the following conditions: 40 mA, 45 kV; step scanning: 0.017°; scan step time: 400.05 s. The chemical composition of the clay was determined with an S4 Pioneer X-ray fluorescence (XRF) spectrometer (excitation: end window Rh X-ray tube, 75 µm Be window, 2.7 kW, 60 kV maximum, 100 mA maximum) on pressed powder samples in argon (90%) and methane (10%) atmosphere. The Fourier-transform infrared spectrum of the clay was recorded in the range of 4000 to 400 cm–1 with a Perkin Elmer 1725 spectrophotometer at 4 cm–1 resolution, on KBr disks (1:100 clay:KBr ratio). Solid-state nuclear magnetic resonance (NMR) spectra were recorded at ambient temperature on a Bruker Avance III 400WB apparatus. The frequencies used were 8 kHz for 1H, 23Na and 29Si and 9 kHz for 27Al. The recycle delays were 5, 2, 3 and 30 s for 1H, 23Na, 27Al and 29Si, respectively. For 23Na analysis, a solution of NaCl (1 M) was used as the reference. The tetramethylsilane was used as the reference for 1H and 29Si. The reference for 27Al analysis was a diluted aqueous solution of NaCl containing Al(H2O)63+.
RESULTS AND DISCUSSION
Kinetic study
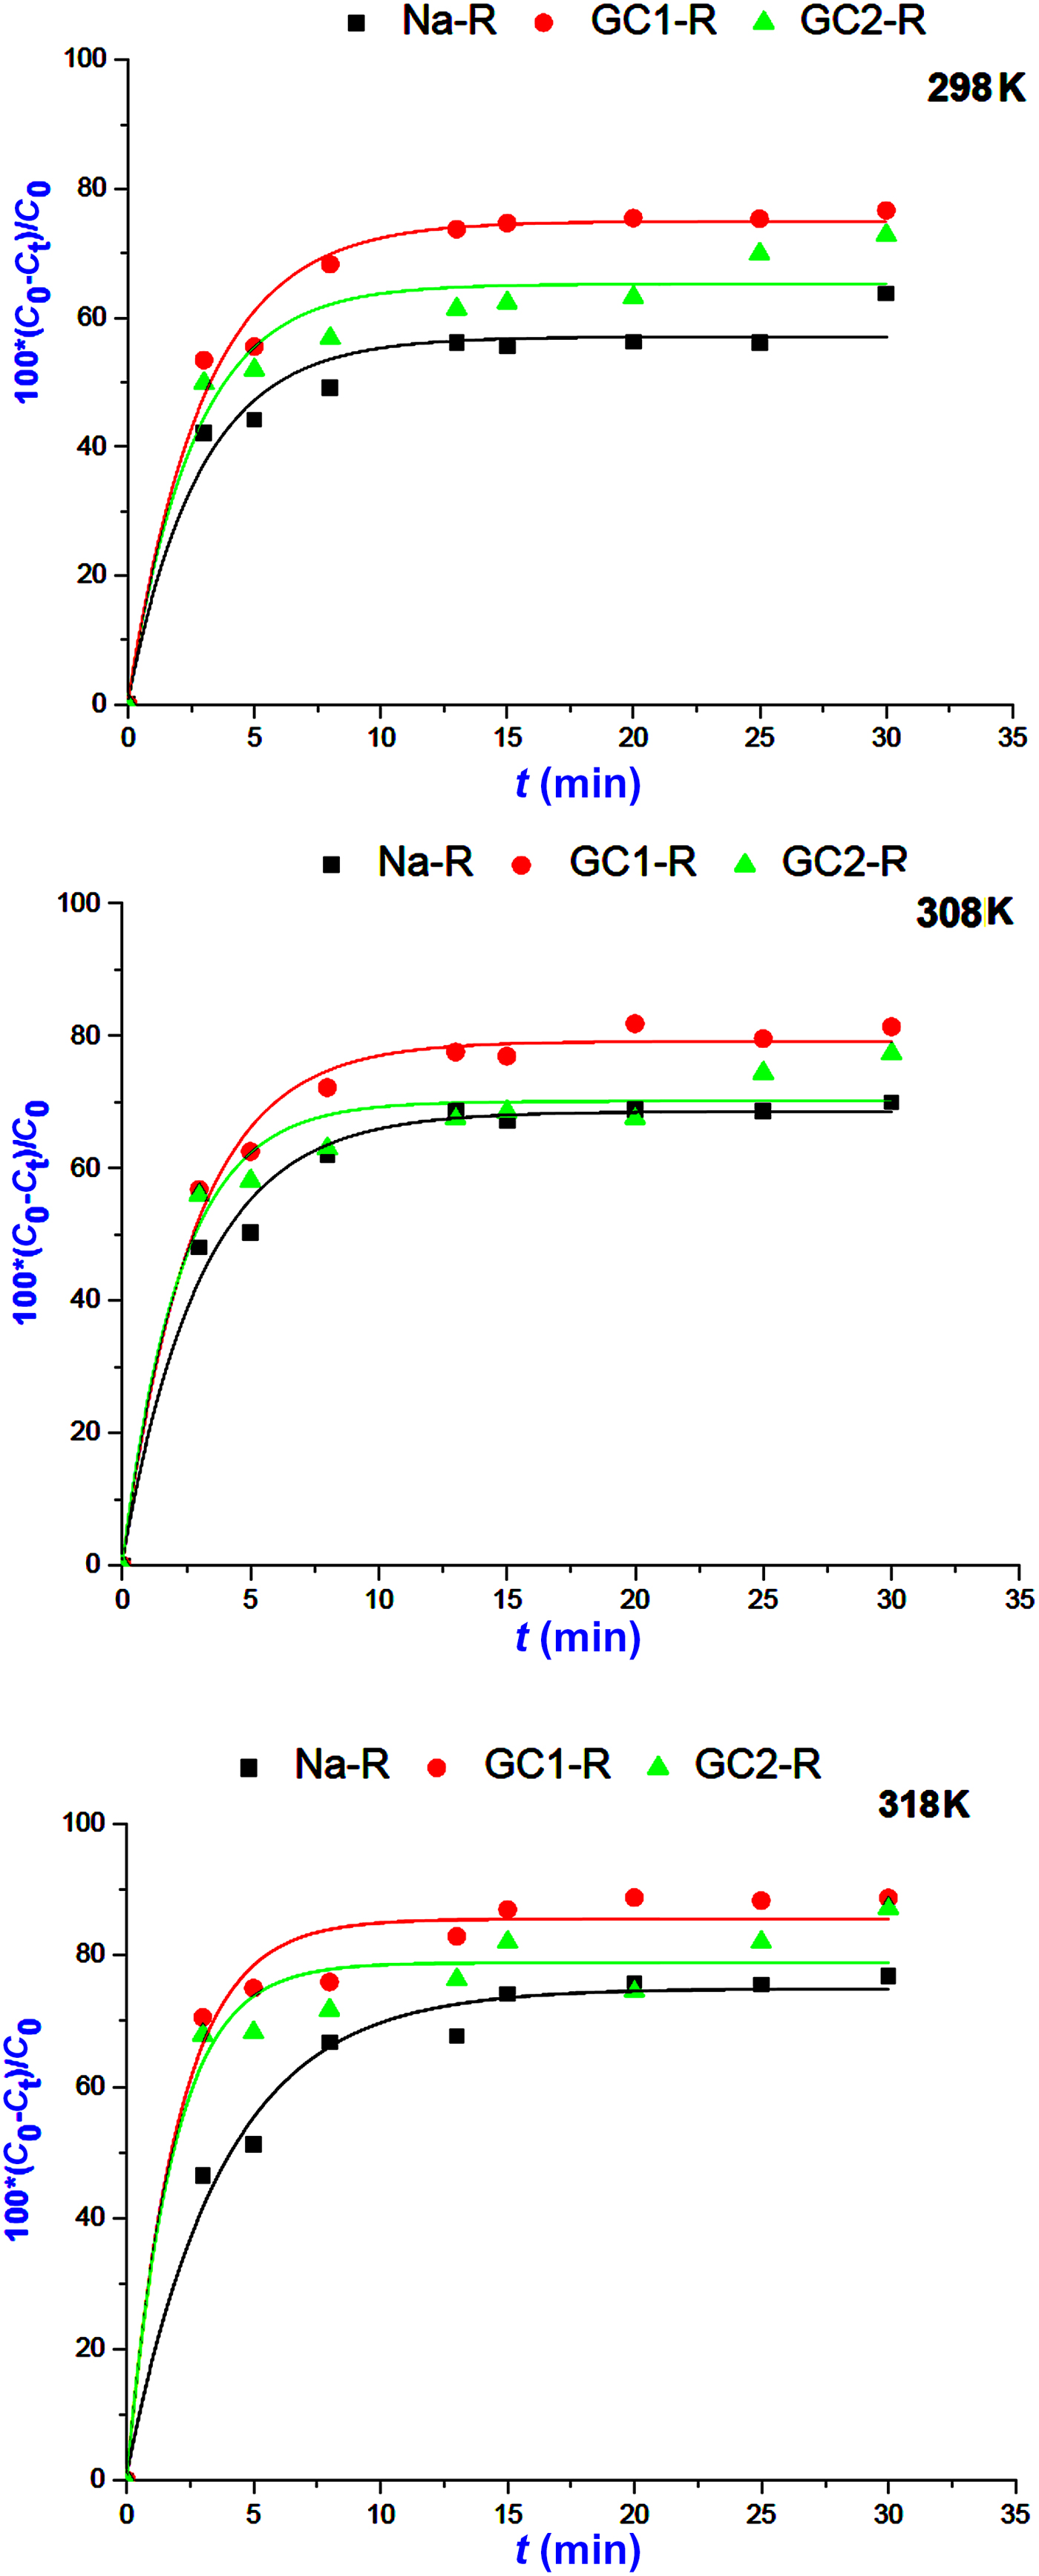
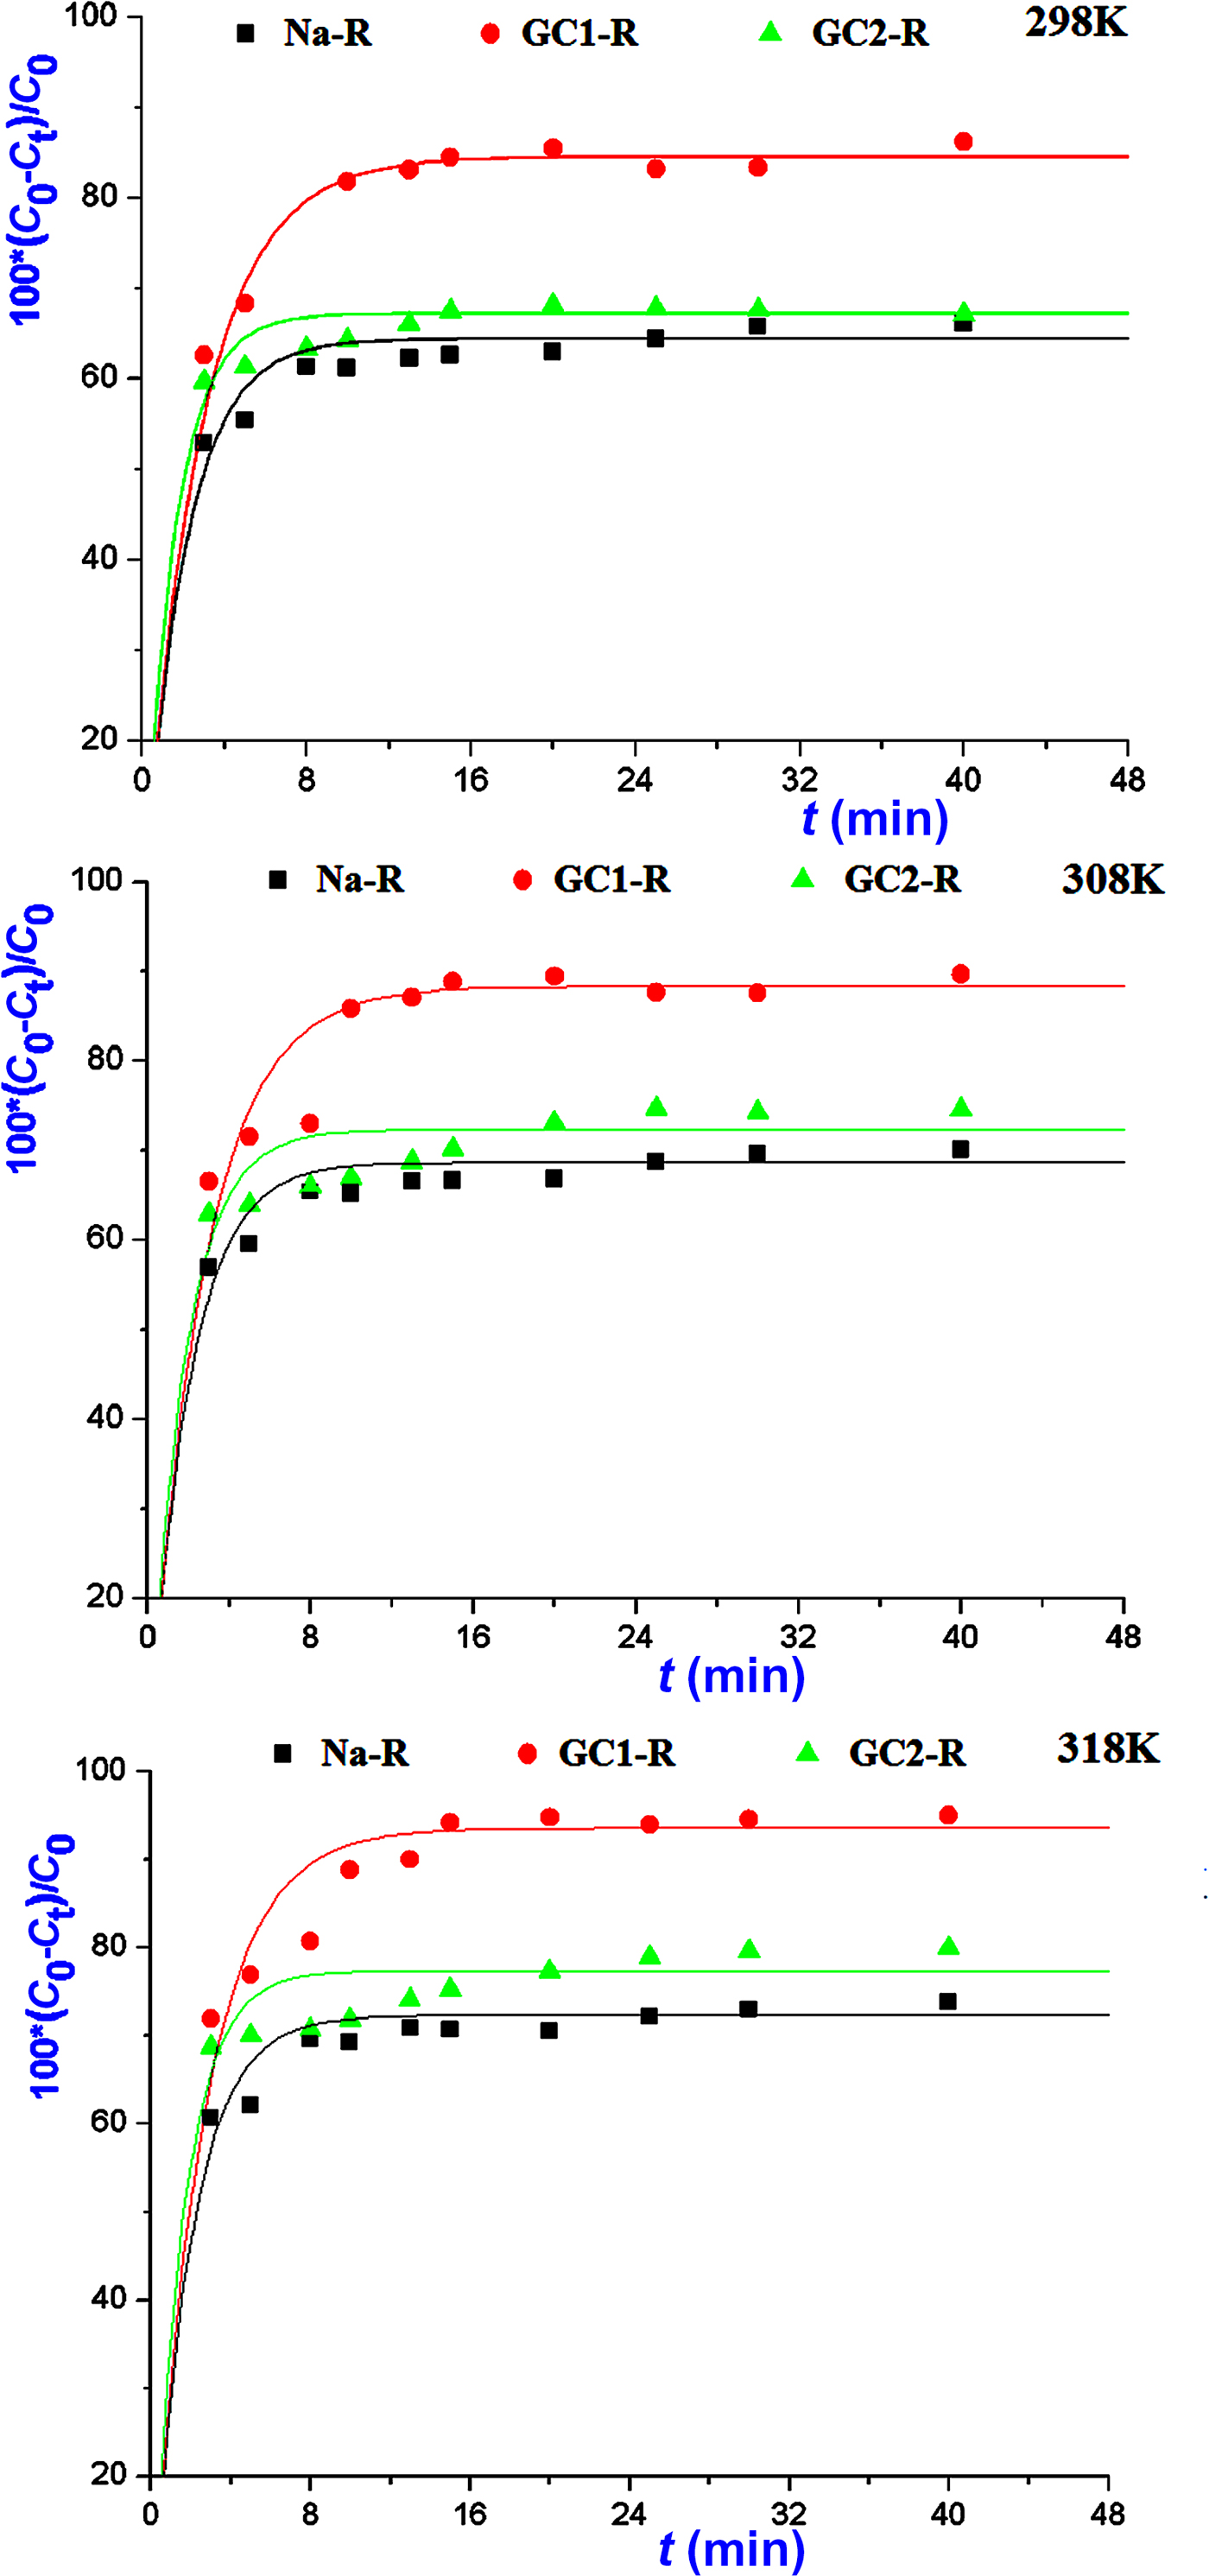
The kinetics of the adsorption of MB and chromate species on both organoclays (GC1-R, GC2-R) and Na+-saturated clays was fast in the investigated range of temperatures, and saturation was reached in <30 min (Figs 5, 6).

Fig. 5. Kinetics curves of the adsorption of methylene blue on Na+-R, GC1-R and GC2-R.

Fig. 6. Variations in the amounts of chromate retained instantaneously by the absorbents studied.
The non-linear regression analysis of the kinetic data indicated that the experimental curves followed the pseudo-second-order kinetics equation (Table 2). This result suggested that the adsorption rates of both chemical species were mainly controlled by the interaction between the active sites of adsorbent and adsorbate species. The rate constants of the adsorption of chromate on GC2-R were relatively high (Table 2), probably due to its specific structural characteristics and/or its particular interactions with chromate species discussed below.
Table 2. Parameters and non-linear regression coefficients (coefficient of determination [R2], normalized standard deviation [NSD]) related to the pseudo-first-order (PFKE) and pseudo-second-order (PSKE) kinetics equations.
MB = methylene blue.
The variation of the rate constant (k 2) vs. the reciprocal temperature indicated that the Arrhenius equation:
 $$\; k_2 = Ae^{ - \displaystyle{{E_{\rm a}} \over {{\rm R}T}}}$$
where A is the frequency factor, E a is the activation energy (J/mol) and R is the gas constant (8.314 J K–1 mol–1) was followed only for the adsorption of MB and chromate on GC1-R. The calculated values of E a were 6.070 and 1.171 kJ/mol for MB and chromate, respectively.
The rate-limiting steps were evaluated using the intraparticle diffusion model (Ismadji et al., Reference Ismadji, Edi Soetaredjo and Aning Ayucitra2015):
 $$q_{\rm t} = k_{\rm i}t^{0.5}$$
where k i is the intraparticle diffusion coefficient (mmol/g min0.5), and the liquid film diffusion model (Qiu et al., Reference Qiu, Lv, Pan, Zhang, Zhang and Zhang2009):
 $${\rm Ln}\displaystyle{{C_{\rm t}} \over {C_{o\;}}} = - k_{\rm ld}t$$
where k ld = k f (S/V), k f is the external diffusion coefficient (cm/min), S is the external surface area of the adsorbent and V is the volume of the solution.
The values of k i and k ld and the constants C and C’ (Table 3) were deduced from the slopes and the intercepts of the plots of q t = f(t 0.5) and Ln(C t/C o) = f(t) (not shown). C and C’ are indicative of the thickness of the boundary layer of the adsorbates built up around adsorbent particles. The absence of such a boundary is expressed by C (or C’) = 0. Based on the fact that C and C’ were different from zero, and taking into consideration the values of the fitting coefficient (Table 3), the adsorption processes of chromate and MB were not controlled by diffusion within particles or by diffusion through the liquid film around adsorbent particles. These results supported the above hypothesis, namely that the rates of the adsorption processes were mainly controlled by chemisorption.
Table 3. Parameters of the intraparticle diffusion and the liquid film diffusion models calculated for different temperatures, and the fitting coefficients of the models.

MB = methylene blue.
Equilibrium studies
The analysis of the experimental adsorption isotherms of MB (Fig. 7) using the non-linear forms of the above models (equations 6 and 7) indicated that the isotherms of Na-R and GC2-R and that of GC1-R plotted at 298 K were fitted better by the Langmuir model (Table 4). Hence, MB adsorption probably occurred on identical active sites, and no more than a monolayer of MB species was built around adsorbent particles at saturation. Probably because of this fact, the maximum uptake amounts of MB (Table 4) were less than or close to the CEC of the clay (0.73 meq/g).
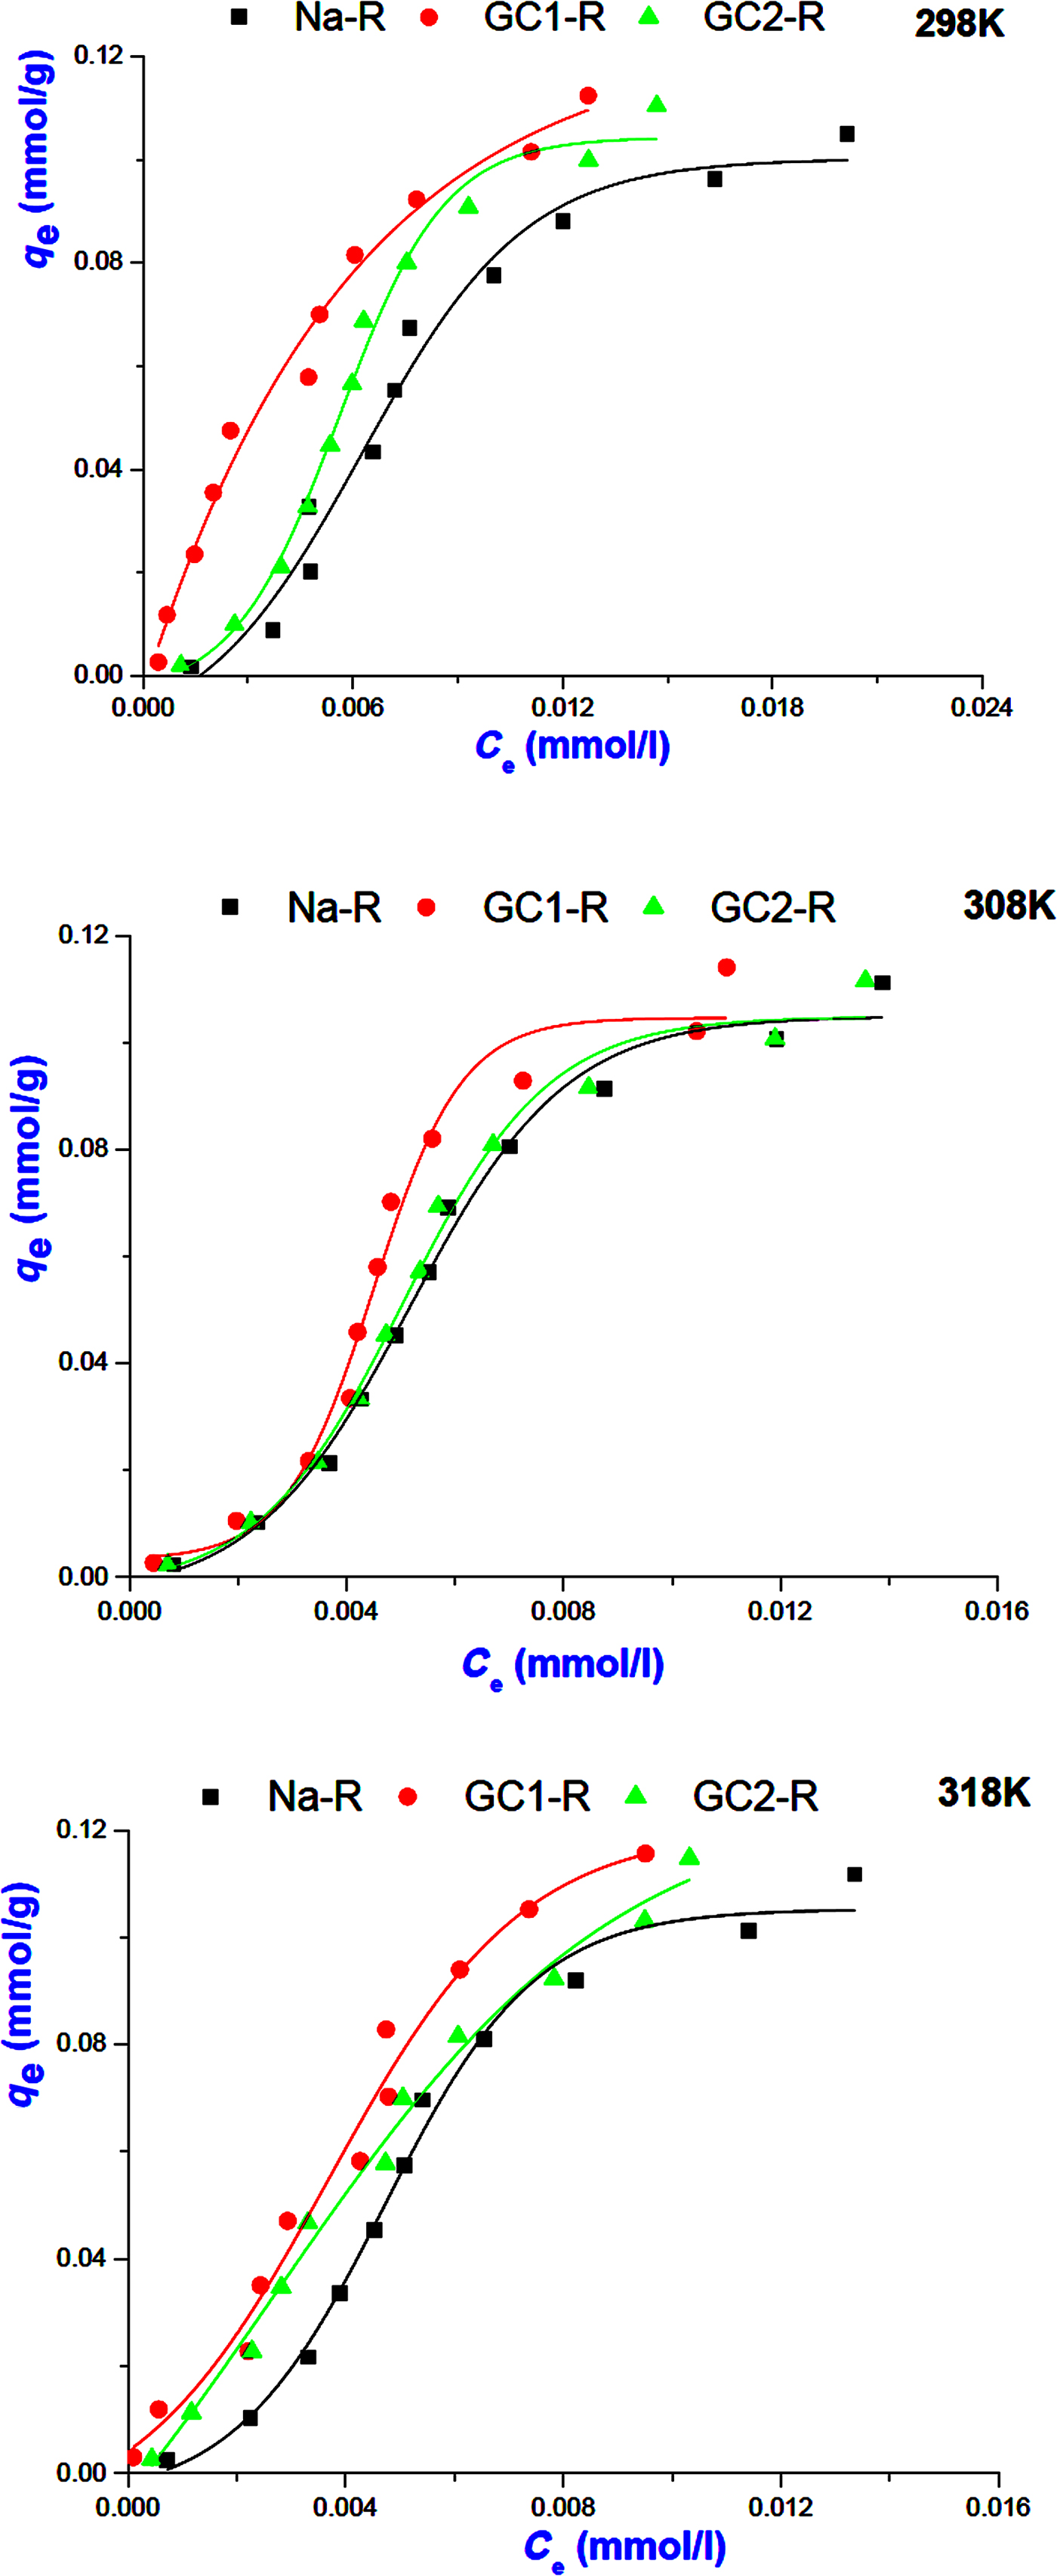
Fig. 7. Isotherms of MB adsorption on Na+-R, GC1-R and GC2-R.
Table 4. Values of the parameters and non-linear regression coefficients (coefficient of determination [R2], root mean square error [RMSE]) related to the adsorption isotherms adopted.
MB = methylene blue.
Considering the calculated values of the Gibbs free energy (ΔG° T = –RTLnK, where R is the gas constant and K is the equilibrium constant taken here as the Langmuir constant KL) (Table 5), MB adsorption occurred spontaneously. Based on the algebraic values of heat (ΔH° T) and entropy (ΔS° T) (Table 5), the adsorption of MB on Na-R and GC2-R was exothermic and occurred because of an increase of the dispersal of energy, probably the energy of the bonds between MB species and the active sites of the adsorbents.
Table 5. Thermodynamic data related to the adsorption processes of chromate and methylene blue (MB) onto the adsorbents studied.
The isotherms of the adsorption of MB on GC1-R at 308 and 318 K were described better by the Freundlich model, and the parameter 1/n was slightly less than unity (Table 4). These results suggested that MB adsorption at these temperatures was less favoured and took place on heterogeneous sites. The analysis of the equilibrium data using the non-linear form of the model of Harkins–Jura (equation 8) did not lead to reasonable R2 values. Thus, the involvement of the eventual active pore sites of adsorbents in MB adsorption was rejected.
Regarding the adsorption isotherms of chromate (Fig. 8), the non-linear regression analysis of the equilibrium data showed that the isotherms were described reasonably well by the Freundlich model (Table 4) and adsorption was more favourable (1/n > 1). Similar to the MB isotherms, the model of Harkins–Jura was not successful, and consequently the contribution of the sites of pores to the adsorption of chromate was discarded.
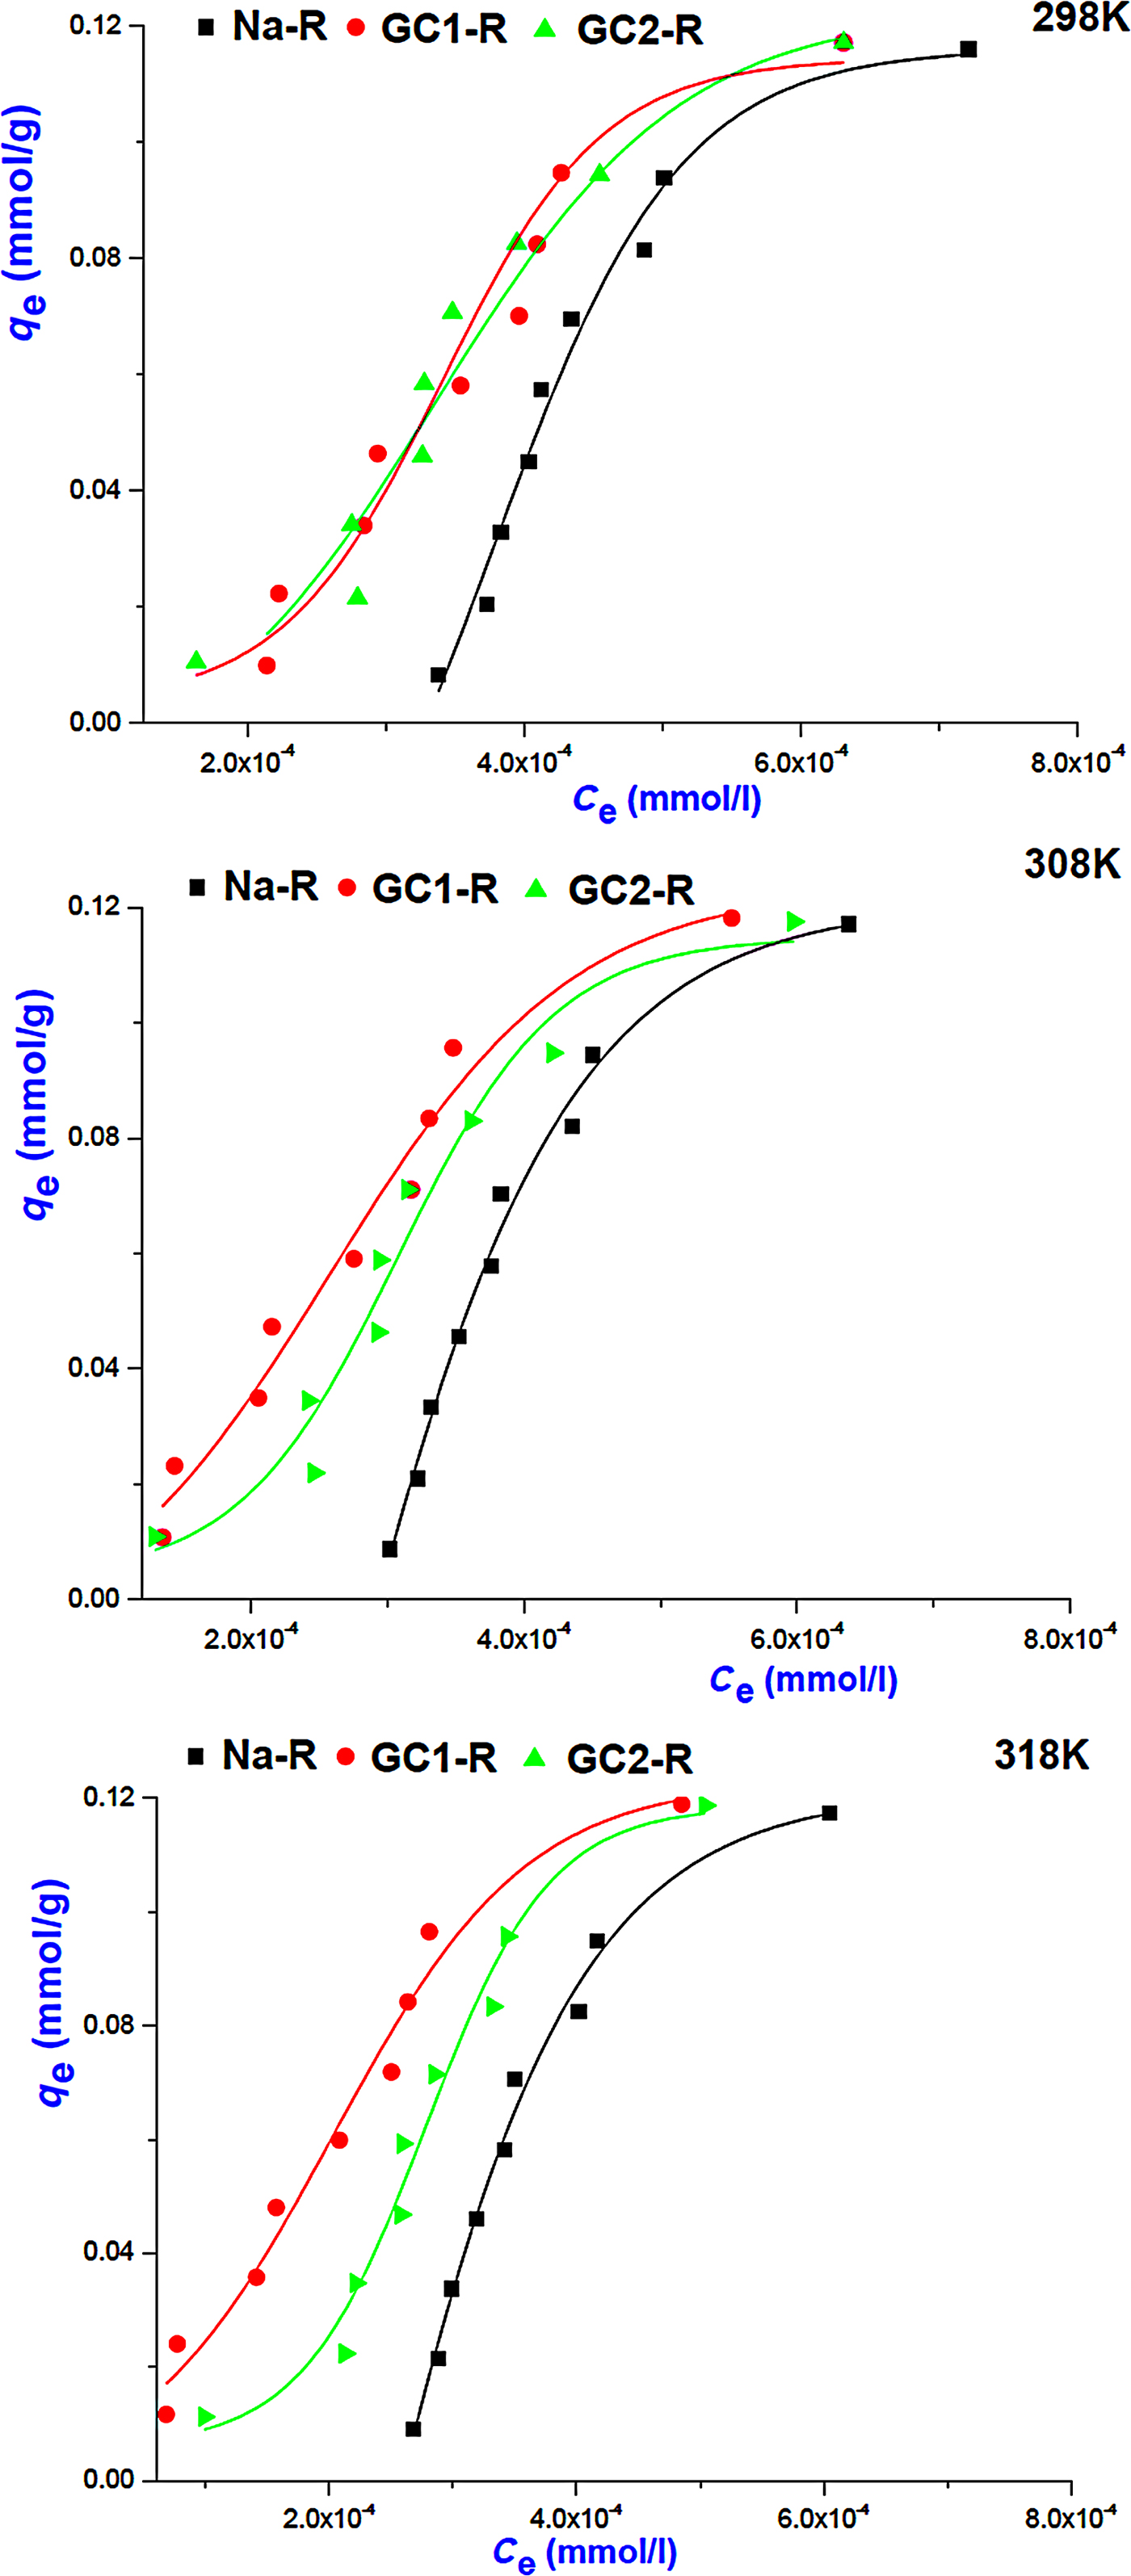
Fig. 8. Adsorption isotherms of chromate on Na+-R and organoclays.
The equilibrium constant, K e, of the adsorption of chromate on the absorbents studied was identified as the intercept of the linear curve of q e/C e = f(q e) (q e → 0 for very dilute solution) and was used for the calculation of the Gibbs free energy (Table 5).
Adsorption of chromate on the absorbents studied took place spontaneously, and the adsorption was endothermic for Na-R and GC1-R. Moreover, ΔH° and ΔS° associated with the adsorption of chromate on GC2-R were not constant over the temperature range investigated.
Structural characterization and mechanisms of adsorption
Chromate adsorbents
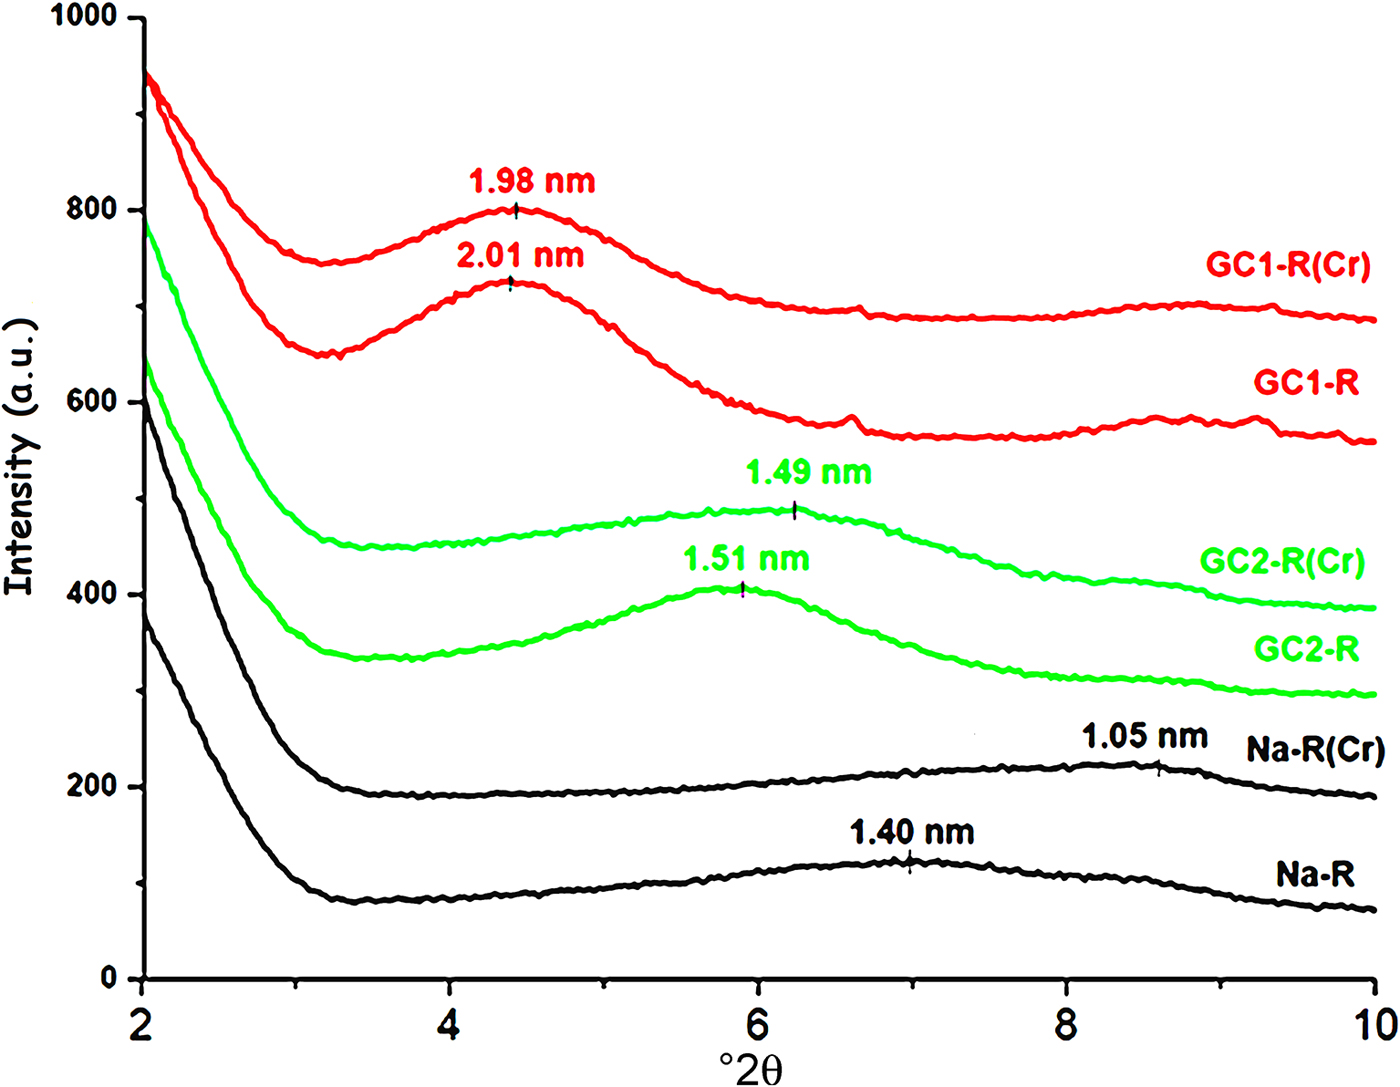
The shape of the basal 001 reflection of stevensite was altered as a result of the interaction between chromate and the absorbents studied (Fig. 9). Taking into consideration Scherrer's formula (Ingham & Toney, Reference Ingham, Toney, Barmak and Coffey2014), the size of the crystallites of Na+-R and GC2-R increased by ~32% and 11%, respectively, whereas no appreciable change was recorded for GC1-R.

Fig. 9. X-ray diffraction patterns of the adsorbents before and after chromate retention.
The 23Na solid-state NMR spectra of Fig. 10 indicate that the chemical environments of the exchangeable Na+ ions (δ = 8.0 ppm) and the tightly bonded ones (δ = –5.5 ppm) placed within the interlayer were not disturbed by chromate adsorption.
Fig. 10. 23Na solid-state nuclear magnetic resonance spectra of the adsorbents. (a) Before adsorption of chromate; (b) after adsorption of chromate. *Spinning side bands.
The solid-state NMR analysis also showed that the electronic environment of the structural proton (δ = 0.4 ppm) of stevensite and that of the proton of the solvation shell (δ = 4.1 ppm) of Na+ ions were almost unaffected by chromate adsorption (Fig. 11).

Fig. 11. 1H solid-state nuclear magnetic resonance spectra of the studied adsorbents. The bands are related to the proton of the clay mineral structure (0.43, 0.6 ppm) and the proton of the solvation shell (4.16, 4.10 ppm) of Na+.
Hence, the chromate was fixed to the surface and the edges of the layers of stevensite. As anionic species, hydrogen chromate (the most abundant species) seemed to develop bonds with the protonated silanols of the tetrahedral sheets (Fig. 12).
Fig. 12. Schematic representation of the interaction between hydrogen chromate and protonated silanol of the tetrahedral sheets of stevensite.
The same interaction seemed to have taken place with the protonated aluminols of the octahedral sheet. However, because the amount of AlIV experienced a decrease of ~85% (Fig. 13), the HCrO4– ions behaved differently from the protonated aluminol groups (≡Al-OH2)+. The Al3+ ions probably reacted with HCrO4–, forming complexes. In this connection, the Si4+ ions might not have migrated from the tetrahedral sites because of their high ionic potential (Z/R; Z and R are the charge and the radius of the cation), which was ~100 nm–1.

Fig. 13. 27Al solid-state nuclear magnetic resonance spectra of Na+-R, GC1-R and GC2-R. (a) Before adsorption of chromate; (b) after adsorption of chromate. *Spinning side bands.
Considering the maximum uptake amount of chromate (~0.19 mmol/g) and the specific surface area of Na+-R (132 m2/g), each ion was placed in an area of 1 nm2. This represented the two basal surfaces of the unit cell of stevensite.
GC1-R was an intercalated nanocomposite. The intercalation of the dendrimers was performed by expelling all of the exchangeable Na+ ions. On the other hand, considering the 27Al NMR chemical shift before and after interaction of chromate ions with the adsorbents studied (Fig. 13), the amount of AlIV of GC1-R was reduced drastically (90%) as a result of chromate adsorption, whereas that of AlVI remained unchanged. The reduction in the amount of AlIV was presumably due to the complexation of Al3+ by hydrogen chromate, as was previously mentioned. The interaction of chromate with the aluminol groups did not affect the closest environment of Si, as could be deduced from the 29Si solid-state NMR spectra in Fig. 14.

Fig. 14. 29Si solid-state nuclear magnetic resonance spectra of the studied adsorbents. (a) Before contact with chromate; (b) after contact with chromate. The shoulder at –107.8 ppm is due to Si in quartz (Fernández et al., Reference Fernández, Ruiz and Cuevas2016).
The maximum quantity of chromate retained by GC1-R exceeded that of Na+-R by ~30%. The difference was attributed essentially to the Na+-R particle aggregation, and subsequently to the hiding of some active sites.
GC2-R consisted of exfoliated and intercalated nanocomposites, but the former structure seemed to be predominant. Therefore, the adsorptions and the maximum amounts of chromate retained by GC2-R and Na+-R were comparable.
As compared to the reported results dealing with the adsorption of chromate on modified stevensite (Table 6), the maximum uptake amount at 298 K (q emax), determined by using the linear form of the Langmuir isotherm, was slightly enhanced by dendrimer modification, particularly by GC1 intercalation. Benhammou et al. (Reference Benhammou, Yaacoubi, Nibou and Tanouti2005, Reference Benhammou, Yaacoubi, Nibou and Tanouti2007) postulated that chromate adsorption occurred on particle edges, but they did not explain the observed differences. The chromate adsorbed mainly on the protonated aluminols and the differences between the amounts of chromate absorbed were attributed to the differences in the clay mineral particle aggregation, which was influenced by the nature of the clay mineral-modifying chemical compound.
Table 6. Maximum uptake amounts of CrVI adsorbed by natural and modified stevensite and by the studied nanocomposites

MB adsorbents
Similar to the adsorption of chromate, the shape and position of the 001 basal reflection of stevensite was modified after adsorption (Fig. 15), and the size of particles changed as a result of the adsorption of MB. The estimated increases in the size of particles were 30% and 12% for Na-R and GC2-R, respectively. For GC1-R, the size decreased by ~19%.

Fig. 15. X-ray diffraction traces of the adsorbents studied before and after adsorption of MB.
Considering the UV-visible spectra (Fig. 16), MB adsorbed on Na-R and on both organoclays as MBH2+ and MB+. The latter species were located at the external surface of aggregates (660–675 nm) and also at the planar surface of stevensite (~653 nm). The supernatants comprised MB+, (MB+)2 and (MB+)3, but their relative abundances varied following the adsorbent used: the trimer was abundant in the MB–Na-R contact, while the monomer and the dimer forms were formed extensively in the presence of GC1-R and GC2-R, respectively. The absence of MBH2+ in the supernatants allowed the deduction that MB protonation occurred at the surface of the particles of stevensite.
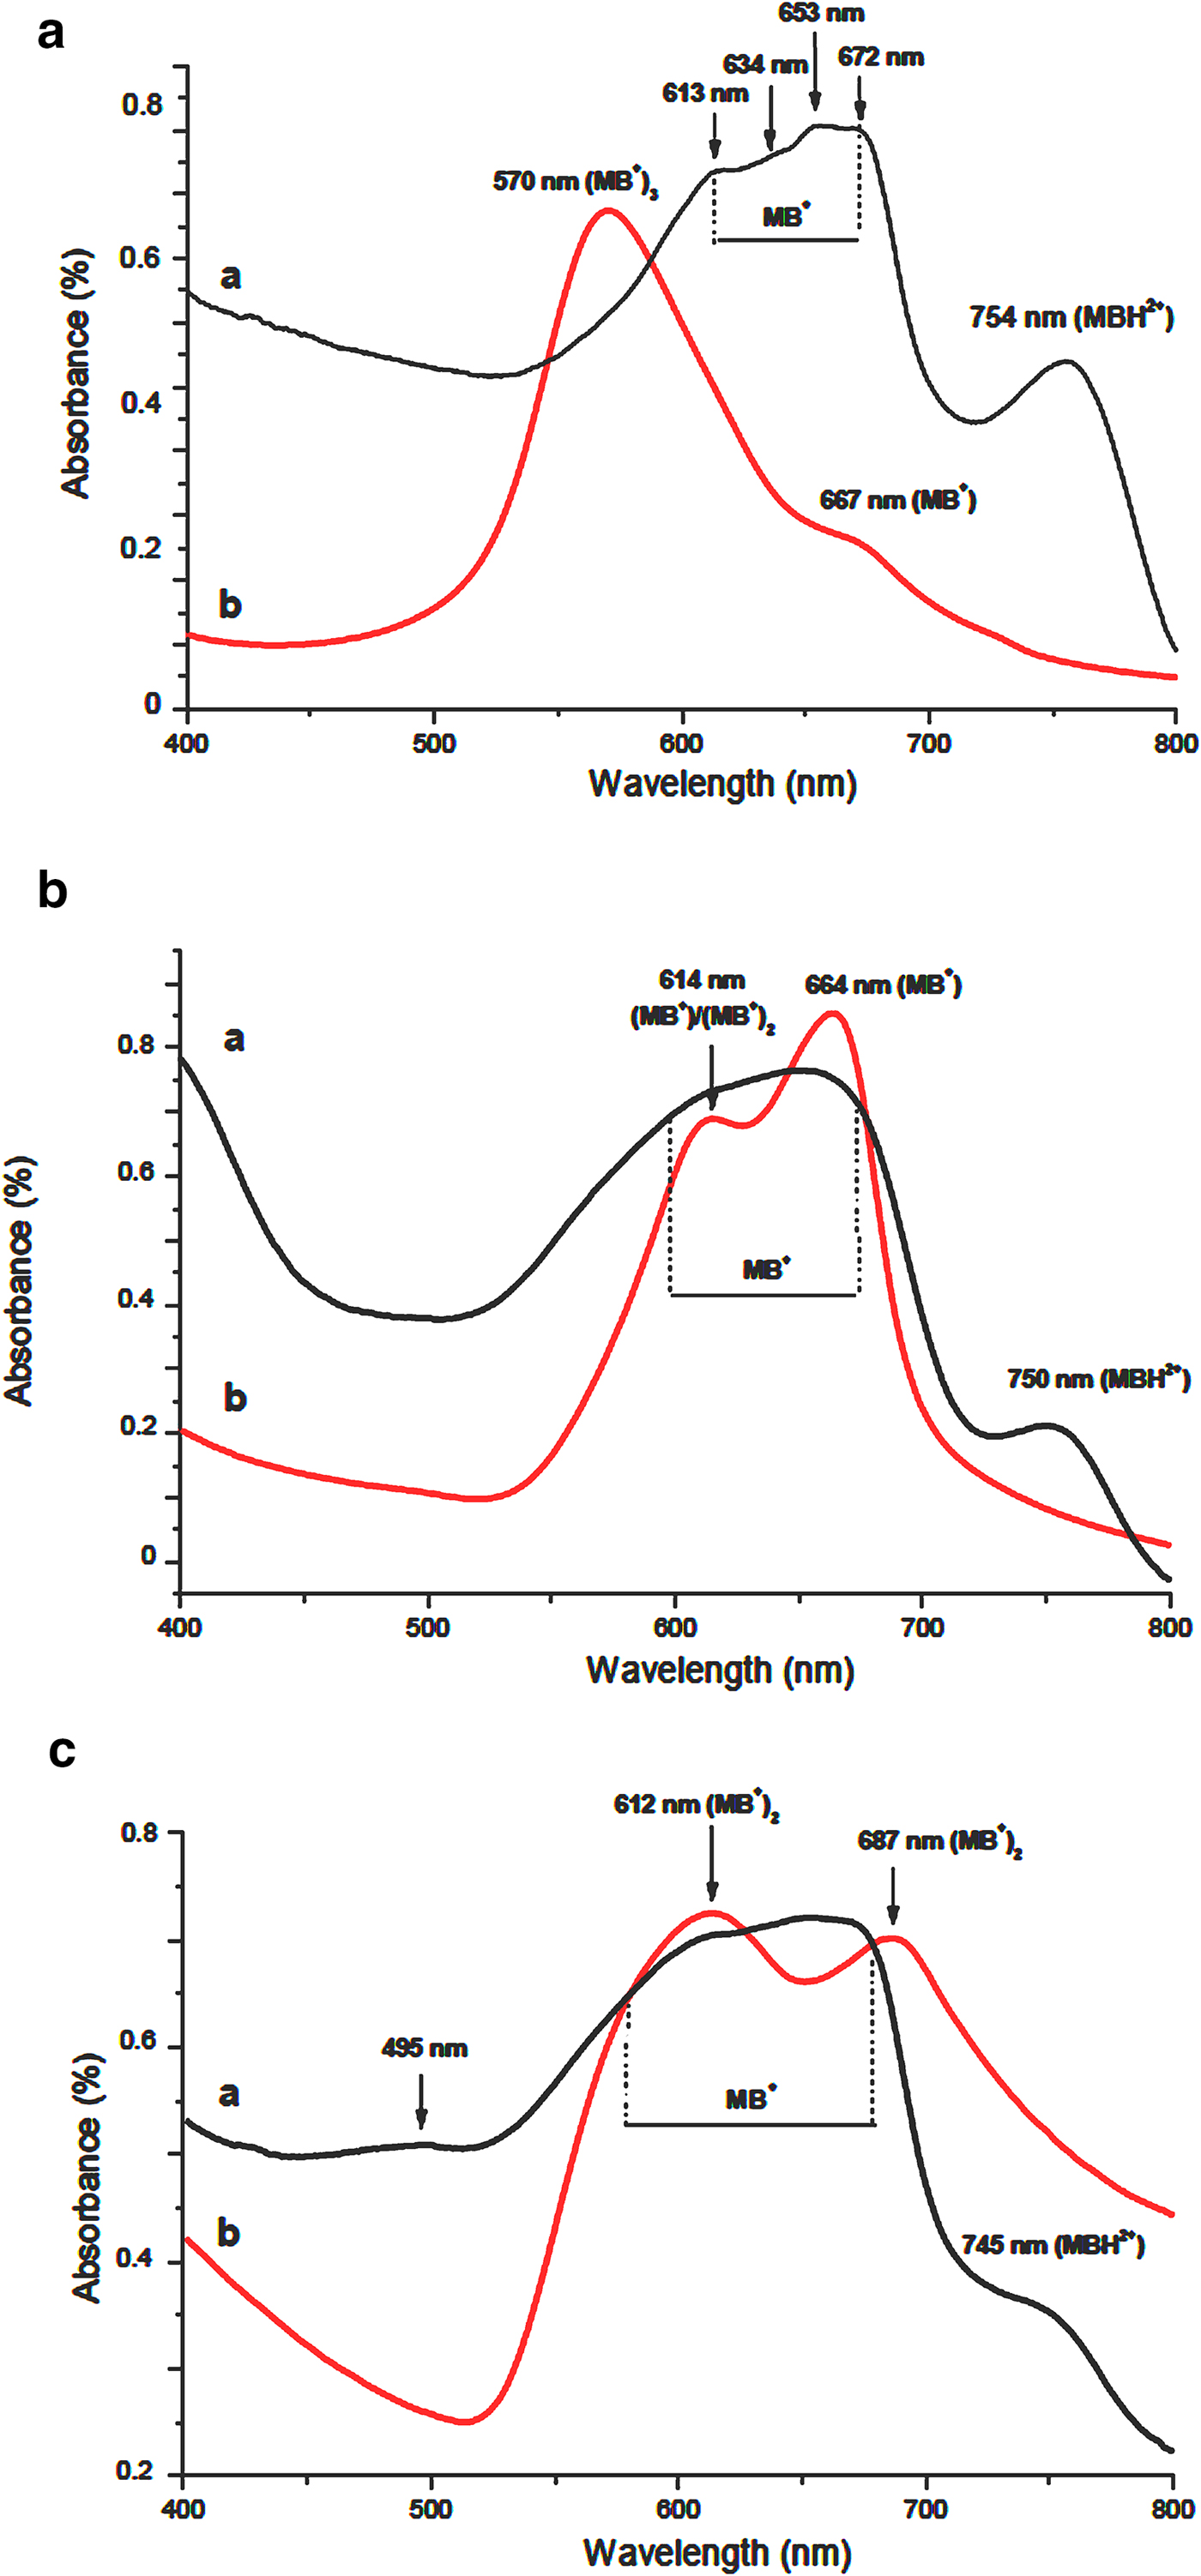
Fig. 16. UV-visible absorption spectra of the adsorbents and their corresponding supernatants after adsorption of MB. (a) Na-R; (b) GC-R; (c) GC2-R.
As a result of the interaction of GC1-R with MB, the structural unit Q4 (0Al), characterized by the 29Si solid NMR peak at –111.1 ppm (Fig. 17), appeared (Koller & Weiß, Reference Koller, Weiß and Chan2012). Moreover, the 29Al solid NMR spectrum showed, in addition to the bands of AlVI and AlIV of stevensite, a shoulder at 55.6 ppm (Fig. 18). This was attributed to the shielded nucleus of AlVI, which was probably located at the border of the structure of stevensite (He et al., Reference He, Guo, Xie, Lin and Li2002). Such a shielding might be due to the interaction of the structural Al3+ at edges with MB+ and/or MBH2+. These results might be due to the aforementioned reduction in size of particles of GC1-R.
Fig. 17. 29Si solid-state nuclear magnetic resonance spectra of Na+-R, GC1-R and GC2-R. (a) Before contact with methylene blue; (b) after contact with methylene blue.
Fig. 18. 27Al solid-state nuclear magnetic resonance spectra of the adsorbents. (a) Before adsorption of chromate; (b) after adsorption of chromate.
SUMMARY AND CONCLUSION
The present study yielded the following conclusions: (1) the adsorption of chromate or MB on the synthesized organoclays and Na+ clays took place rapidly, and the kinetics followed the pseudo-second-order equation. The rate constants were in the range of 0.04–0.16 mmol−1 g s–1 and 0.02–0.06 mmol−1 g s–1 for chromate and MB, respectively. (2) The rates of adsorption of both chemical species were not ruled by the intraparticle diffusion or by the liquid film diffusion. (3) The adsorption isotherms of chromate correlated better with the Freundlich model, whereas those of MB were best fitted with the Langmuir model. The Gibbs free energy involved varied between –31 and –10 kJ/mol, and the adsorbent affinity for MB was relatively high (∆G°[MB] ≈ 2∆G°[chromate]). (4) The maximum uptake amounts of MB and CrVI were in the ranges of 0.15–0.90 mmol/g and 10–14 mg/g, respectively. GC2-R and GC1-R were the best adsorbents for MB and chromate, respectively. (5) Chromate ions, which were present extensively as HCrO4–, were fixed to the protonated silanols and aluminols of the edges and the free surfaces of the stevensite layers. (6) Due to the adsorption of chromate, most of the tetrahedral aluminium was removed from the structure of stevensite, and probably formed complexes with chromate ions. (7) MB was retained as MB+ and MBH2+. The cations of the former species were placed at the planar surfaces of stevensite and the external surfaces of aggregates. The latter species formed at the clay surfaces. (8) As a result of MB adsorption on GC1-R, the structural unit Q4(0Al) was formed. In this case, AlVI at the edges of the stevensite layers seemed to be abundant and contributed to the adsorption of MB.
ACKNOWLEDGMENTS
The authors are grateful to CNRS (France), CNRST (Morocco), Campus-France (France) and the LIA LCMMF for their financial support.