


Introduction
Angiostrongylus cantonensis (Nematoda: Metastrongylidae), or the rat lungworm, is the primary aetiologic agent of eosinophilic meningitis in humans worldwide, with recent reports of increased human infection, geographic spread and host expansion (Wang et al., Reference Wang, Lai, Zhu, Chen and Lun2008; Graeff-Teixeira et al., Reference Graeff-Teixeira, Da Silva and Yoshimura2009; York et al., Reference York, Creecy, Lord and Caire2015; Niebuhr et al., Reference Niebuhr, Jarvi, Kaluna, Fischer, Deane, Leinbach and Siers2020). These recent increases in human cases, as well as high A. cantonensis infection rates observed in wildlife, have identified Hawaii as a global hotspot of infection, while simultaneously highlighting gaps in knowledge surrounding local pathways for transmission (Cowie, Reference Cowie2013; Jarvi et al., Reference Jarvi, Howe and Macomber2018; Johnston et al., Reference Johnston, Dixon, Elm, Calimlim, Sciulli and Park2019; Niebuhr et al., Reference Niebuhr, Jarvi and Siers2019). Perhaps surprisingly, as it was early research conducted in the 1960s in Hawaii that led to the first link between A. cantonensis and human disease (angiostrongyliasis, or rat lungworm disease) (Alicata, Reference Alicata1991), our current understanding of host–parasite transmission dynamics remains limited in Hawaii and elsewhere (Prociv et al., Reference Prociv, Spratt and Carlisle2000; Qvarnstrom et al., Reference Qvarnstrom, Bishop and da Silva2013; Jarvi et al., Reference Jarvi, Quarta, Jacquier, Howe, Bicakci, Dasalla, Lovesy, Snook, McHugh and Niebuhr2017; Kim et al., Reference Kim, Wong, Curry, Yeung, Hayes and Cowie2019).
The life cycle of the parasite is complex, requiring both rats definitive and gastropod intermediate hosts to reproduce. Infected gastropods, a common source of human and other animal infection, allow for early larval development, while the rat host is required for the sexual reproduction of the parasite (Spratt, Reference Spratt2015; Barratt et al., Reference Barratt, Chan, Sandaradura, Malik, Spielman, Lee, Marriott, Harkness, Ellis and Stark2016). Infections of A. cantonensis in wild host populations are highly variable (Wang et al., Reference Wang, Lai, Zhu, Chen and Lun2008; Barratt et al., Reference Barratt, Chan, Sandaradura, Malik, Spielman, Lee, Marriott, Harkness, Ellis and Stark2016) and are influenced by a variety of factors, both intrinsic (e.g. host species, size, diet) and extrinsic (e.g. location, climate, seasonality) (Ibrahim, Reference Ibrahim2007; Kim et al., Reference Kim, Hayes, Yeung and Cowie2014, Reference Kim, Wong, Curry, Yeung, Hayes and Cowie2019; Simões et al., Reference Simões, Maldonado Júnior, Olifiers, Garcia, Bertolino and Luque2014; Jarvi et al., Reference Jarvi, Quarta, Jacquier, Howe, Bicakci, Dasalla, Lovesy, Snook, McHugh and Niebuhr2017).
In Hawaii, all three species of introduced rats (Rattus exulans, R. rattus and R. norvegicus) and a variety of native and non-native snails are known to harbour A. cantonensis infections (Kim et al., Reference Kim, Hayes, Yeung and Cowie2014; Niebuhr et al., Reference Niebuhr, Jarvi and Siers2019). One gastropod species, in particular, Parmarion martensi, often carries higher A. cantonensis infection levels (prevalence and intensity) than other gastropods (Hollingsworth et al., Reference Hollingsworth, Kaneta, Sullivan, Bishop, Qvarnstrom, DaSilva and Robinson2007; Qvarnstrom et al., Reference Qvarnstrom, Bishop and da Silva2013; Kim et al., Reference Kim, Hayes, Yeung and Cowie2014) and may be more easily infected (Asato et al., Reference Asato, Taira, Nakamura, Kudaka, Itokazu and Kawanaka2004). The recent spread of this introduced terrestrial snail sometimes referred to as a semi-slug, may help explain the increased incidence of human cases seen in both Hawaii and Japan (Asato et al., Reference Asato, Taira, Nakamura, Kudaka, Itokazu and Kawanaka2004; Howe and Jarvi, Reference Howe and Jarvi2017). While infection levels of A. cantonensis in wild host populations have been previously investigated in Hawaii, often interpretations or comparisons of findings are based on limited representation in terms of locality, seasonality, or various host characteristics. The aim of this study was to investigate intrinsic and extrinsic factors associated with variation in A. cantonensis infections in two definitive and one intermediate host species from shared habitats in eastern Hawaii Island.
Materials and methods
Study area and host collection
In 2018–2019, wild rats (R. exulans and R. rattus) and snails (P. martensi) were sampled for A. cantonensis infection. Specimens were collected from two sites in Hilo, on the eastern side of Hawaii Island, Hawaii, USA, an area previously reported to have high infection levels in all three species studied here (Qvarnstrom et al., Reference Qvarnstrom, Bishop and da Silva2013; Jarvi et al., Reference Jarvi, Quarta, Jacquier, Howe, Bicakci, Dasalla, Lovesy, Snook, McHugh and Niebuhr2017). The two sites, Site 1 (19°42′47″ N 155°03′11″W) and Site 2 (19°39′12″N 155°04′25″W) are less than 500 m from the airport and the local zoo, respectively. The two sites are approximately 7 km apart and situated at 25 and 120 m elevation a.s.l. Site 1 is less than 500 m from the airport and Site 2 is less than 300 m from the local zoo. This overall region has a tropical rainforest climate with considerable rainfall occurring throughout the year (annual mean of 3219 and 3982 mm for each site) and a mean annual temperature at each site of 23.3 and 21.4°C, respectively (NNDC CDO, 2020). Host collection took place over 12 months, which we divided into four sampling periods: Period A (early May for Site 1 and mid-May for Site 2, 2018), Period B (mid-August for Site 1 and early September for Site 2, 2018), Period C (late November for Site 1 and early December for Site 2, 2018), and Period D (mid-February for Site 1 and late February for Site 2, 2019); exact dates are included in Supplementary Table S1. Each collection event occurred over a period of 2–10 days.
Rats were collected using wire cage live traps (Haguruma, Osaka, Japan) baited with coconut and placed along transects at 10 m intervals. Each trapping site consisted of two transects, approximately 500 m apart. Transects were typically along forest or other vegetation edges, with traps, placed a few metres into the vegetation. Following capture, rats were euthanased via CO2 immersion and either immediately sampled for A. cantonensis or frozen (−20°C) and sampled at a later date. Snails were collected opportunistically within vegetation, or from underneath plastic tarps previously placed on the ground, and subsequently frozen (−80°C) for later analysis.
Angiostrongylus in wild rats
Sex and body mass of each rat was recorded, along with species, which is easily distinguishable using morphological characteristics (Innes, Reference Innes and King1990). The heart and lungs of each rat were then removed and inspected using fine-tipped forceps under a stereomicroscope (Leica or Olympus 10–40X). The lung texture of each rat was inspected for a granulated appearance, as discussed by Jarvi et al. (Reference Jarvi, Quarta, Jacquier, Howe, Bicakci, Dasalla, Lovesy, Snook, McHugh and Niebuhr2017). Adult stage worms were collected and counted from the right ventricle, pulmonary artery and lungs of each rat. Lungworm species identification was confirmed by Červená et al. (Reference Červená, Modrý, Fecková, Hrazdilová, Foronda, Alonso, Lee, Walker, Niebuhr, Malik and Šlapeta2019) and voucher specimens were deposited in the Australian National Wildlife Collection (CSIRO, Canberra, Australian Capital Territory, Australia) under accession number W/L HC# N5703–N5711. The complete mtDNA genome sequence of a voucher specimen was submitted to GenBank under accession number MK570630.
Angiostrongylus in P. martensi
Prior to molecular analysis, each snail was thawed, weighed and measured for length. The length was measured by positioning each snail on their ventral side as straight as possible, without forcibly extending the body outwards; due to this species having an underdeveloped shell, the entire body was accessible. Tissue samples (ranging from 10 to 307 mg; mean of 110.3 ± 3.8 s.e.), were dissected from the tail region, as this region is known to harbour consistently high larval burdens of A. cantonensis in P. martensi (Jarvi et al., Reference Jarvi, Farias, Howe, Jacquier, Hollingsworth and Pitt2012). Tissue samples were stored in 500 μL of DNA lysis buffer and homogenised using a Bead Ruptor Elite (Omni International, Kennesaw, Georgia, USA) as described in Niebuhr et al. (Reference Niebuhr, Jarvi, Kaluna, Fischer, Deane, Leinbach and Siers2020). DNA was extracted from 50 μL of homogenised tissue using the DNeasy® Blood & Tissue Kit (QIAGEN, Valencia, California, USA) per the manufacturer's Animal Tissue protocol with a final elution volume of 400 μL.
Quantification of A. cantonensis (number of larvae per reaction tube) from tail tissues of snails was estimated by quantitative PCR (qPCR) using the assay described by Jarvi et al. (Reference Jarvi, Farias, Howe, Jacquier, Hollingsworth and Pitt2012), the 50-cycle cycling conditions outlined by Niebuhr et al. (Reference Niebuhr, Jarvi, Kaluna, Fischer, Deane, Leinbach and Siers2020), 9 μL of extracted template and the plasmid standards developed by Howe et al. (Reference Howe, Kaluna, Fisher, Tagami and Mchugh2019). While only tail tissue was analysed here, to allow for more consistency when making comparisons, the quantification of parasites found should not necessarily be extrapolated to the rest of the body, as A. cantonensis may not be evenly distributed throughout the entire snail (Jarvi et al., Reference Jarvi, Farias, Howe, Jacquier, Hollingsworth and Pitt2012). Confidence in the quantification estimates of each qPCR run was established by high qPCR efficiencies (Bustin et al., Reference Bustin, Benes, Garson, Hellemans, Huggett, Kubista, Mueller, Nolan, Pfaffl, Shipley, Vandesompele and Wittwer2009) and that the standard curves of reference samples encompassed the cycle threshold (Ct) range observed in all snail samples. Confidence in the quantification estimates of individual snail samples was established by a low cycle threshold standard deviation (Ct s.d.) (<0.5) among replicates within a qPCR run. Samples were classified as positive or negative using the criteria outlined in Niebuhr et al. (Reference Niebuhr, Jarvi, Kaluna, Fischer, Deane, Leinbach and Siers2020). For positive samples, the amount of tissue used in each DNA extraction (tissue amount assayed) and the intensity of infection (estimated quantity of larvae per mg of tissue) was determined by the two following equations:
Tissue amount assayed (mg) = (tissue amount dissected (mg)/500 μL DNA lysis buffer) × 50 μL homogenised tissue used for DNA extraction
Estimated quantity of larvae per mg of tissue = ((# of larvae per reaction tube/9 μL extracted template) × 400 μL final elution)/tissue amount assayed (mg)
Data analysis
We investigated the effects of intrinsic factors (rat body mass and sex; snail body length or mass) and extrinsic factors (site and sampling period) on A. cantonensis infection. For rats, infection prevalence (infection status: positive/negative) was assessed by multiple logistic regression, i.e. generalized linear models (GLMs) with a binomial distribution and logit link function. Infection intensity (total number of adult worms observed from each rat) was evaluated with GLMs with a negative binomial distribution. For snails, prevalence (infection status: positive/negative) was assessed with logistic regression. Infection intensity in snails was modelled as the estimated quantity of larvae per mg of tissue; because these values were not true counts, they were log-transformed (natural log) to improve normality and intensity was evaluated by linear regression.
Potential intrinsic predictor terms included mass, sex and a sex × mass interaction for rats, and mass or length as alternative predictors for snails. Extrinsic predictors of site (1 and 2), sampling period (A–D) and a site × period interaction term were evaluated for both rats and snails. For mass and length terms, we also considered a quadratic term (mass2 or length2); quadratic regression allows for a better fit to data resulting from a non-linear response, for example, a curvilinear relationship between mass and prevalence or intensity (e.g. a ‘humped’ or ‘U-shaped’ response where prevalence or intensity is higher for mid-sized individuals than for smaller and larger ones). Models were constrained to always include the lower-order terms (main effects) when including interactions or quadratic terms, e.g. all models with a mass2 term were constrained to also include the mass term (mass + mass2), and all models with interactions, e.g. sex × mass, were constrained to also include both of the main effects (sex + mass + sex × mass). For rats, exploratory modelling showed no meaningful sex × site or sex × period effects, so these interaction terms were not included in the model selection process. Because snail length and mass are highly autocorrelated (adjusted R 2 = 0.449, P << 0.001), model sets were constrained to include only length or mass, never both.
Combinations of potential predictor variables were evaluated for fit to the data using Akaike's Information Criteria corrected for small sample size (AICC), with weights assigned to all candidate models as per Burnham and Anderson (Reference Burnham and Anderson2002). The model selection included all combinations of potential predictors within the constraints described above. Models within 2 AICC units of the top model were considered plausible alternative models. Our tables of model selection results include only: all models within 2 AICC units of the top model (plausible top models, in bold); models including each of the main effects alone; and the intercept-only (null) model – for the sake of brevity, models containing other potential combinations of terms were considered but not listed. When the mass + mass2 model outperformed the mass-only model, the superior model was reported because mass and mass2 are in fact a single effect. For each effect term, the relative variable importance (RVI; Anderson, Reference Anderson2008) or the summed weights of all models containing that term, was calculated; e.g. an RVI of 1.0 indicates that the respective term was included in models carrying 100% of model weights and lower values indicate relatively less combined weight in the model set (lower importance of the variable). All statistical analyses were run in R version 3.5.3 (R Core Team, 2019) and multi-model inference was performed with functions in the ‘MuMIn’ package.
Results
Infection in rats
A total of 417 rats (226 R. exulans and 191 R. rattus) were caught from two sites in Hilo, Hawaii. No R. norvegicus were caught during this study. For each species, approximately 55% of rats caught were male. The mean body mass of R. exulans individuals caught was 48.8 g (± 1.0 s.e.), with a minimum and maximum of 16.2 and 99.5 g. For R. rattus, the mean body mass was 103.0 g (± 2.7 s.e.), with a minimum and maximum of 21.7 and 186.0 g. In total, 2,507 adult A. cantonensis were collected from 266 rats (63.8% of 417 rats sampled). More R. exulans (77.4% of 226 rats) were infected with adult A. cantonensis than R. rattus (47.6% of 191 rats; P < 0.01, Fisher's exact test) and those infected harboured more worms (mean of 11.1 ± 0.7 s.e.), than R. rattus (mean of 6.2 ± 0.7 s.e.; P < 0.0001, unpaired, two-tailed t-test). Infection values by species, site and sampling period are included in Supplementary Tables S2–S3. The highest worm burden observed was 57 (32 males and 25 females) from a 63.6 g male R. exulans. The most worms observed in a R. rattus individual were 36 (13 males and 20 females) from an 80.0 g male rat. Additionally, 76.7% (204 of 266) of infected rats were observed to have granulation on at least one lung lobe (often the upper right).
Infection prevalence in R. rattus
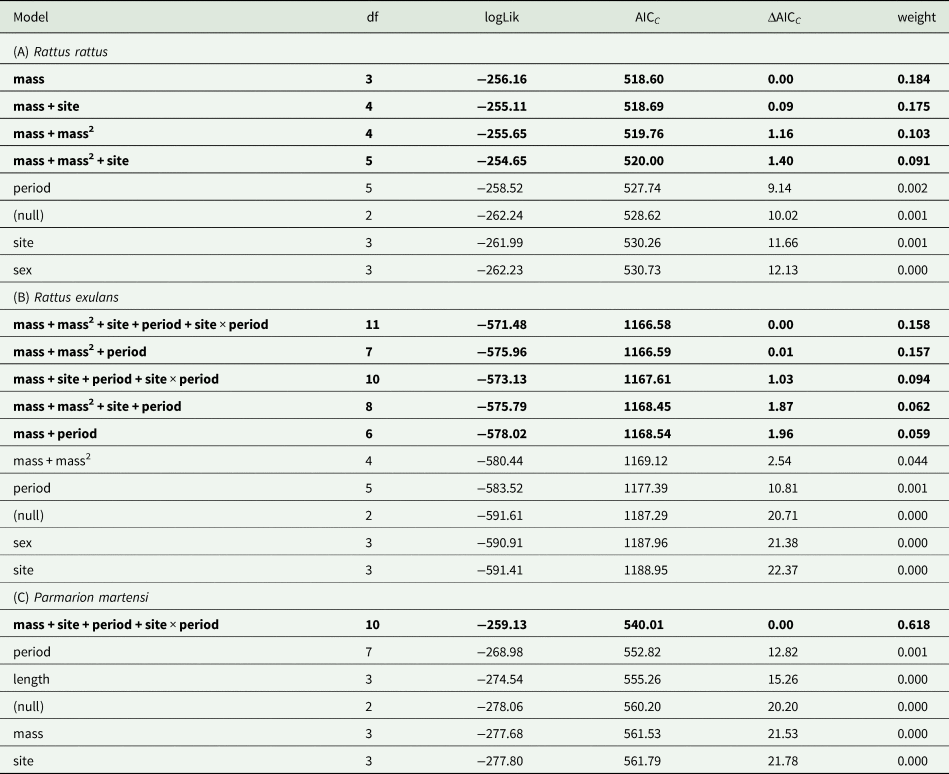
Mass and sex were the most important predictors of the presence of adult worms in R. rattus (RVI 0.99 and 0.93, respectively) (Tables 1A and 2). The quadratic term for mass was also included in models carrying 71% of summed model weights. Sex × mass and sex × mass2 interactions were only moderately important on their own (0.58 and 0.43) though at least one of these interactions was included in all 10 models within 3.359 AICC units of the top model, comprising 78% of the summed model weights (includes models not shown in our reduced tables). There was little support for a strong influence of site, sampling period, or a site × period interaction (0.44, 0.20 and 0.03). In general, there was little ability to distinguish among models, with all model weights being relatively low. For heuristic value, we plot the second model to examine the influences of sex and mass (sex + mass + mass2 + sex × mass2; included in both top models) and site (the most important extrinsic predictor of prevalence) (Fig. 1A). This figure depicts a general trend of high prevalence in smaller males with a much lower prevalence in the largest males and a slightly increasing trend of infection with an increased mass in females. Smaller males were more likely to be infected than smaller females and larger females were more likely to be infected than larger males. Infection prevalence was only slightly higher at Site 2.
Table 1. Model selection tables for the prevalence of Angiostrongylus cantonensis infection in rats (Rattus rattus and R. exulans) and snails (Parmarion martensi) from two sites over four sampling periods in Hilo, Hawaii.

The best models (ΔAICC ⩽ 2) are highlighted in bold.
Tables include models that are within 2 AICC units of the top model (plausible alternative top models, in bold), models including each of the predictor terms alone, and the intercept-only (null) model with no predictor variables; additional combinations of terms were considered, but were unimportant and are not included here for the sake of brevity. Weight = the weight of the respective model in proportion to the sum of all model weights (1.0; Burnham and Anderson, Reference Burnham and Anderson2002).
Table 2. Summary of relative variable importance (RVI, sum of model weights including the respective term; Anderson, Reference Anderson2008) for infection prevalence and intensity model sets.


Fig. 1. Model predictions for relationships among sex, mass and site for prevalence and intensity of Angiostrongylus cantonensis infection in Rattus rattus (A & C) and R. exulans (B & D) sampled at two sites in Hilo, Hawaii. Shaded areas represent ± 1 standard error for the estimate; where error intervals broadly overlap, there is little effect size.
Infection prevalence in R. exulans
Mass and mass2 were highly significant predictors of infection prevalence for R. exulans (RVI 1.0 for both), while sex was of relatively less importance (0.45) (Tables 1B and 2). Interactions of sex with mass or mass2 were unimportant (0.13 for both), meaning the relationship between mass and prevalence was generally very similar for both sexes. In contrast to R. rattus, extrinsic factors (site and sampling period) were important predictors of prevalence in R. exulans (0.98 and 1.0), with a moderately important site by sampling period interaction (0.57). Compared to R. rattus, there was a greater ability to differentiate among models, with only two models within 2 AICC units of the top model and the top three model weights summing to 66.5% of all model weights.
For comparison to R. rattus results, we also plotted prevalence predictions by sex, mass, mass2 and site (Fig. 1B). In this figure, we see the strong quadratic effects of mass + mass2 on prevalence, with a significantly lower prevalence in very small and very large individuals, and very high prevalence for R. exulans from approximately 40 to 85 g. Standard error intervals beyond 85 g are very broad due to the low number of rats (n = 3) in this size range. The effect of sex was relatively minor and we did not plot sex by mass or mass2 interaction because the first model containing such an interaction (not reported in our reduced model table) was 3.514 AICC units greater than the top model. The site, sampling period and site × period carried RVI values of 0.98, 1.0 and 0.57; however, because of some categorical values equalling 1 (100% prevalence), regression models could not estimate standard errors for sampling period effects. Rather, we plot the 95% binomial confidence intervals (exact method) for the prevalence of infection for all males and females (irrespective of mass) by site and sampling period (Fig. 2). This figure represents the proportion of R. exulans collected at the respective site and sampling period that were positive for rat lungworm infection; however, this site and sampling period plot does not control for body masses of the rats sampled. In other words, in regards to Fig. 2, we acknowledge that infection prevalence is also influenced by the size of the rat (as seen in Fig. 1B) and that the average size of rats captured at any time and place can vary.

Fig. 2. Variation in Angiostrongylus cantonensis infection prevalence among sexes, sites and sampling periods for Rattus rattus (A) and R. exulans (B) sampled in Hilo, Hawaii. The solid line at the centre of each column depicts the proportion of rats infected in each subsample, irrespective of mass, and the shaded boxes represent the 95% binomial confidence intervals for the estimate. The number above each sample is the sample size (N). Periods A–D represent host sampling periods (A: May 2018; B: August–September 2018; C: November–December 2018; D: February 2019; with exact dates included in Supplementary Table S1.).
Infection intensity in R. rattus
Mass was the most important predictor of infection intensity in R. rattus (RVI 0.99), with mass2 having relatively little influence (0.37) (Tables 2 and 3A). Sex was relatively unimportant (0.33), with the sex-only model ranking more poorly than the intercept-only (null model) and interactions of sex with mass or mass2 were unimportant (0.08 and 0.03). There was a moderate effect of the site (0.46), only when taking mass into account (i.e. the site-only model ranked more poorly than the null model). Neither sampling period nor site × period was influential (0.17 and <0.01). The plausible top models (within 2 AICC units of the top model) all contained mass in combination with mass2 and/or site. For comparison to infection prevalence plots, Fig. 1C shows the predicted worm intensity in R. rattus from the best-fit model that included sex, mass and site effects (sex + mass + mass2 + site, not reported in our reduced table). From this figure we see that mean predicted infection intensity in R. rattus is primarily influenced by mass, with only a very slight curvature of the response curve due to the mass2 term and no difference by sex. Infection intensity at Site 2 was slightly lower (though with very broadly overlapping confidence intervals), in contrast to prevalence which was higher at Site 2.
Table 3. Model selection tables for the intensity of Angiostrongylus cantonensis infection in rats (Rattus rattus and R. exulans) and snails (Parmarion martensi) from two sites over four sampling periods in Hilo, Hawaii.
The best models (ΔAICC ⩽ 2) are highlighted in bold.
Tables include models that are within 2 AICC units of the top model (plausible alternative top models, in bold), models including each of the predictor terms alone, and the intercept-only (null) model with no predictor variables; additional combinations of terms were considered, but were unimportant and are not included here for the sake of brevity. Weight = the weight of the respective model in proportion to the sum of all model weights (1.0; Burnham and Anderson, Reference Burnham and Anderson2002).
Infection intensity in R. exulans
The most influential predictor of infection intensity in R. exulans was mass, with a moderately-important curvilinear relationship based on mass2 (RVI 1.0 and 0.73) (Tables 2 and 3B). Sex had a relatively low predictive influence (0.38) and only in combination with other terms, as the sex-only model ranked more poorly than the null model; no model including any form of the sex term was included in any of the plausible top models. Interactions of sex with mass and mass2 were unimportant (0.11 and 0.09). As with prevalence in R. exulans, there was also a strong influence of sampling period on infection intensity (0.88). The site was moderately influential (0.55), but only in models that also included an additive or interactive effect of the sampling period (the site-only model ranked more poorly than the null model) and the top model containing site without a sampling period effect (mass + mass2 + site) performed more poorly than the top model by 4.64 AICC units. There was only modest support for an interaction between site and sampling period (0.38), though the interaction does appear in two of the top five plausible models.
Plotting effects of sex, mass and site, for comparison to previous plots (Fig. 1D), we see there is clearly very little influence of sex and almost no influence of site, on infection intensity in R. exulans. Here infection is clearly dominated by a mostly positive relationship with mass, though a mass2 influence results in a slight reduction in intensity for the largest rats (but with very broad confidence intervals). We also plot the sampling period effect from the top model, including mass and mass2 (Fig. 3). Controlling for mass, we see that infection intensity was highest in Periods A and D, with intensity lower in Periods B and C.

Fig. 3. Model-predicted variation in Angiostrongylus cantonensis infection intensity for Rattus exulans among sampling periods. Shaded areas represent ± 1 standard error for the estimate; where error intervals broadly overlap, there is little effect size. Periods A–D represent host sampling periods (A: May 2018; B: August–September 2018; C: November–December 2018; D: February 2019; with exact dates included in Supplementary Table S1.).
Infections in snails
In total, 159 P. martensi snails were sampled, ranging in body mass from 0.05 to 2.36 g (mean of 1.08 ± 0.04 s.e.) and 1.20–5.40 cm length (mean of 3.40 ± 0.07 s.e.). Overall, 86.2% (137 of 159) of snails were positive for A. cantonensis infection. The estimated quantity of larvae ranged from 0.02 to 724.27 per mg of tissue (mean of 82.6 ± 9.2 s.e.). Infection values by site and sampling period are included in Supplementary Tables S2–S3. Cycle threshold values of all snail samples fell between the highest and lowest Ct values of the plasmid standards (13.7 and 34.3 respectively). Ct values of snail samples ranged from 16.3 to 30.7 (mean of 20.1 ± 0.1 s.e.). Across qPCR runs, standard curve equations were very consistent with an average slope of −3.421, y-intercept of 23.129, R 2 of 0.999 and a reaction efficiency of 95.976%.
Infection prevalence in P. martensi
The top model for infection prevalence in P. martensi was clearly identified, with no other candidate models within 2 AICC units of the top model (Table 1C) (though the same model with a mass2 effect had ΔAICC of 2.006 and accounted for 26.2% of the model weights – the third-highest model was 7.91 AICC units greater than the top model). Mass was a far better predictor of infection status than length (RVI 1.0 vs <0.01), with relatively little support for the quadratic term on either (0.27 vs <0.01) (Table 2). The site and sampling period were highly influential on infection status, though only when an interaction term was included, indicating high variability among sites and sampling periods.
Given the high rate of infection observed in P. martensi, with some site/sampling period categories exhibiting 100% infection (prevalence = 1.00), regression models could not reliably estimate standard errors for the categorical covariates. Therefore, rather than plot effect sizes from model predictions, we plotted infection prevalence values and 95% binomial confidence intervals for prevalence by site and sampling period and overlaid the mean ± the 95% confidence interval for snail mass (Fig. 4). This plot reflects that a site × period effect is primarily driven by atypically low prevalence at Site 2 during the February 2019 sampling effort (Period D) and that this low prevalence corresponds to the lowest mean size of snails sampled. Given the problems with predicting confidence intervals from logistic regression including the extrinsic effects, we used regression only to evaluate the influence of snail mass on infection prevalence. Because model selection showed relatively little influence of a quadratic effect of mass (mass2), we simply plot the effect of snail mass on the probability of infection (Fig. 5). From this figure we see a roughly 25% infection rate in the smallest snails sampled and nearly 100% by 1.00–1.50 g or greater in mass.

Fig. 4. Prevalence of Angiostrongylus cantonensis infection in Parmarion martensi snails sampled at two sites over four sampling periods in the vicinity of Hilo, Hawaii. Horizontal lines are the prevalence estimates by grouping, with grey bars indicating the 95% binomial confidence intervals, with values listed on the left y-axis. White circles represent the mean mass of snails in the sample, with vertical lines representing the 95% confidence intervals for the means and values listed on the right y-axis. Values above each boxplot indicated the sample size (N). Periods A–D represent host sampling periods (A: May 2018; B: August–September. 2018; C: November–December 2018; D: February 2019; with exact dates included in Supplementary Table S1.).

Fig. 5. Model-predicted prevalence of Angiostrongylus cantonensis infection in Parmarion martensi snails sampled over four sampling periods at two sites in Hilo, Hawaii. The shaded area represents ± 1 standard error of the estimate.
Infection intensity in P. martensi
For P. martensi, the top model for infection intensity was the same as for prevalence (Table 3C). As with prevalence, the mass was a far more important predictor of infection intensity than length (RVI 0.83 vs 0.11) with little influence of their quadratic terms (0.20 and 0.04) (Table 2). The most influential effects were environmental, including site, sampling period and the site × period interaction effect (0.99, 1.00, 0.97), indicating high variability among sites and sampling periods. We plotted predicted larval counts from the top model (Fig. 6).

Fig. 6. Intensity of Angiostrongylus martensi infection in Parmarion martensi snails sampled over four sampling periods at two sites in the vicinity of Hilo, Hawaii, as predicted by the top model (mass + site + period + site × period). Shaded areas represent ± 1 standard error for the estimate; where error intervals broadly overlap, there is little effect size. Periods A–D represent host sampling periods (A: May 2018; B: August–September 2018; C: November–December 2018; D: February 2019; with exact dates included in Supplementary Table S1.).
Discussion
In this study, we report on A. cantonensis infection in wild rats (R. exulans and R. rattus) and the terrestrial snail, P. martensi, in eastern Hawaii Island. An overall infection prevalence of 86.2% was observed in P. martensi and 63.8% in rats, with R. exulans (77.4%) greater than R. rattus (47.6%). Previous reports from eastern Hawaii Island have also shown high infection levels in both rats and snails (Qvarnstrom et al., Reference Qvarnstrom, Bishop and da Silva2013; Jarvi et al., Reference Jarvi, Quarta, Jacquier, Howe, Bicakci, Dasalla, Lovesy, Snook, McHugh and Niebuhr2017), as well as a high incidence of human infection transmission (Cowie, Reference Cowie2013; Jarvi et al., Reference Jarvi, Howe and Macomber2018; Johnston et al., Reference Johnston, Dixon, Elm, Calimlim, Sciulli and Park2019). Additionally, eastern Hawaii Island is reported to have the greatest area of highly suitable habitat for A. cantonensis in Hawaii, based on current climate conditions (Kim et al., Reference Kim, Wong, Curry, Yeung, Hayes and Cowie2019).
We observed high variability in A. cantonensis infection prevalence and intensity for P. martensi and R. exulans, among the four sampling periods within this study. Interestingly, this effect was not seen for R. rattus. Infection levels in R. exulans were very high in May 2018 (Period A) and February 2019 (Period D), but generally lower and more variable from the sampling periods in between. For P. martensi, we observed a general decreasing trend in infection intensity throughout our sampling period, but only at Site 2, with a less apparent pattern at Site 1 and with moderate variability overall. Variability in infection between sites was also seen for R. exulans, again strongly influenced by sampling period and with no apparent trend. Interestingly, as a result of Hurricane Lane, which occurred from 15 to 29 August 2018 (with heavy rains between dates 22 and 26), over 1000 mm of rainfall occurred between sampling events for Period B (NNDC CDO, 2020); it is unclear how this influenced our sampling or observations on infection levels.
Although it is difficult to determine information in regards to an annual cycle of infection, since our data only comes from a single year, we do see the prevalence of infection in R. exulans return to very high levels in February 2019, similar to that observed in the previous May. These high levels are also consistent with those observed, from the same sites, 2 years prior in February 2017 (Jarvi et al., Reference Jarvi, Quarta, Jacquier, Howe, Bicakci, Dasalla, Lovesy, Snook, McHugh and Niebuhr2017). One explanation for the temporal differences in infection seen in R. exulans could be related to changes in rat–snail interactions due to fluctuations in snail population numbers. If populations of snail species important to A. cantonensis transmission are lower at certain times of the year, a reduction in infections in their rat predators may be occurring as a result, albeit slightly delayed due to the lifecycle of the parasite. Snails are known to go dormant as a response to extremes of heat and drought (Boss, Reference Boss1974), and in Japan, P. martensi is reported to be more active in the winter (Asato et al., Reference Asato, Taira, Nakamura, Kudaka, Itokazu and Kawanaka2004). Anecdotally, we found it much easier to find P. martensi during Periods C and D (autumn and winter months). Additionally, findings from a 2005 survey in eastern Hawaii Island, revealed local residents reporting a population crash of P. martensi occurring in the spring with numbers returning to higher levels in the following autumn months (Hollingsworth et al., Reference Hollingsworth, Kaneta, Sullivan, Bishop, Qvarnstrom, DaSilva and Robinson2007). More information on temporal changes of abundance and density of host populations, including other intermediate host species, is necessary to accurately describe current predator-prey dynamics and their influence on A. cantonensis transmission in the wild. Furthermore, if an annual cycle of infection is occurring in eastern Hawaii, this could have important management or surveillance implications for particular host species in the region.
Here we also report intrinsic factors as strong correlates of A. cantonensis infection in all three species investigated. For P. martensi, a positive correlation was observed between body mass and both infection prevalence and intensity, which is likely a result of larger and longer-lived individuals encountering and consuming more food infected with first-stage larvae. While a positive association with A. cantonensis infection and P. martensi body size, specifically body length, has been previously been shown (Hollingsworth et al., Reference Hollingsworth, Kaneta, Sullivan, Bishop, Qvarnstrom, DaSilva and Robinson2007), we found that body mass was a far greater explanatory predictor of infection prevalence and intensity than length. This finding could be related to potential variability in measuring the length of soft-bodied animals and larvae inhabiting the volume of a snail (primarily muscle tissue in P. martensi; Asato et al., Reference Asato, Taira, Nakamura, Kudaka, Itokazu and Kawanaka2004), which is likely to be more tightly associated with mass, as opposed to any single linear measurement of the body.
Results from our infection analyses in rats were more complex, with different infection trends observed between and within species associated with host body mass and sex. One explanation for these trends could be related to host diet, with higher consumption of infected prey resulting in greater infection (as hypothesized with the intermediate snail hosts). Overall, we observed greater infections in R. exulans than in R. rattus. Sugihara (Reference Sugihara1997) found R. exulans to have a more restricted diet than R. rattus, with a greater relative abundance of invertebrates in the stomachs of R. exulans. We also observed intraspecific differences in infections in rats, associated with both host sex and body mass. Infections in R. exulans showed a positive correlation with body mass. In R. rattus, a negative correlation between infection and body mass was observed, except for infection prevalence in female rats. Previous studies on Rattus spp. have also shown that protein-based food, including invertebrates, was more prominent in the diets of juveniles of both sexes and adult females, as compared to adult males, indicating different diet requirements for growth (age-related) and reproduction (sex-related) (Clark, Reference Clark1980; Gales, Reference Gales1982; Sugihara, Reference Sugihara1997). While body mass of rodents can fluctuate, in general, body mass in wild rats is positively correlated with age, and is often used as a proxy for age when comparing groups of individuals (Hirata and Nass, Reference Hirata and Nass1974; Iskjaer et al., Reference Iskjaer, Slade, Childs, Glass and Korch1989; Webster and Macdonald, Reference Webster and Macdonald1995; Simões et al., Reference Simões, Maldonado Júnior, Olifiers, Garcia, Bertolino and Luque2014). These differences in feeding patterns could help explain the opposite correlations observed between male and female R. rattus for infection prevalence and body mass (i.e. age). However, feeding patterns would not explain the opposite correlations between body mass (i.e. age) and measure of infection (i.e. prevalence and intensity) in female R. rattus.
Why might the probability of infection increase with age, while the average worm burden decreases? Furthermore, why would these host sex-specific infection trends not be observed in both rat species sampled here, since they are essentially sharing the same habitat and both were found to be infected? One possibility is that these infection patterns may be related to varying degrees of host immunity to the worms. For rats that are feeding on gastropods in the wild, older individuals are more likely to experience repeated infections over their lifetime than younger individuals. The development of acquired immunity to A. cantonensis has been documented in naturally and experimentally infected Rattus spp., showing lower worm burdens after just a single infection and again in each subsequent infection (Liat et al., Reference Liat, Kong and Joe1965; Au and Ko, Reference Au and Ko1979; Yong and Dobson, Reference Yong and Dobson1982). Jarvi et al. (Reference Jarvi, Quarta, Jacquier, Howe, Bicakci, Dasalla, Lovesy, Snook, McHugh and Niebuhr2017) recently hypothesized that in Hawaii, R. rattus, more than R. exulans, are likely developing acquired immunity following primary infections with A. cantonensis. They observed a higher prevalence of adult worm infections in R. exulans compared to R. rattus, but the opposite for third-stage larvae (the stage acquired from the environment), which could be explained by differences in host susceptibility. They also observed opposite correlations between R. rattus body mass and prevalence of live adult worms (current infections) and encysted adult worms (previous infections) with the larger (older) rats showing more evidence of past infections and less evidence of current infections than smaller (younger) rats. However, they did not observe the same for R. exulans, reporting very high infections levels in older individuals.
Indeed, surveys from the multiple Hawaiian Islands, including this study, have often shown infection levels in R. rattus to be lower than R. exulans and R. norvegicus (Higa et al., Reference Higa, Brock and Palumbo1986; Niebuhr et al., Reference Niebuhr, Jarvi and Siers2019). Interestingly, in our study, we show slight negative trends, between infection and rat body mass, at the extreme upper end of body masses for R. exulans, although very few individuals in this body mass range were sampled. It is possible that R. exulans is capable of developing some immunity to A. cantonensis, but less so than R. rattus. It is also possible that a sampling bias occurred for the largest (and oldest) individuals, with more infected rats less successfully trapped due to a decrease in fitness or overall survival. Experimental studies in laboratory strains of Rattus norvegicus have shown that rat survival worsens and body mass decreases with an increase in parasite burden (Ji et al., Reference Ji, Yiyue, Xujin, Minghui, Mengying, Yue, Yanqi, Langui, Xin, Datao, Shuo, Huanqin, Zhongdao and Zhiyue2017). Experimental infections are needed to explore the immunity potential of wild rats in Hawaii, which could ultimately inform control operations that may intentionally or unintentionally target certain species, ages or body sizes of rats.
In summary, our results showed that A. cantonensis infections in definitive and intermediate hosts in Hawaii are very common overall, but do vary with both environmental and host-related factors. Infection in all species varied, to different degrees, by sampling period and site in ways that did not lend themselves to prediction with a single year of sampling. Host body mass was a strong predictor of infection in the three host species studied here, though the patterns varied between species and sexes in rats. This work also clearly confirms R. exulans and P. martensi as important reservoirs of A. cantonensis infection in Hawaii. Although these findings cannot clearly illuminate the precise dynamics of host–parasite transmission, they do give a sense of the variability in (1) spatial and temporal expression of A. cantonensis infection prevalence and intensity; and (2) patterns of expression throughout the development of individuals, within definitive and intermediate host populations. Accounting for both predictable and unpredictable sources of variability will be a crucial component in predicting the effectiveness of future disease surveillance or targeted management strategies. Recommendations for future work include multi-year investigations into seasonal and annual infection cycles, to determine any consistency or variation that may be occurring. Additionally, more in-depth spatial infection level data in definitive and intermediate hosts are also needed, including from different locations within and across islands, as well as from different habitat types (e.g. urban, agricultural). More data on variation in host abundance would also be helpful in both informing on transmission cycles among wild populations and designing control operations.
Supplementary material
The supplementary material for this article can be found at https://doi.org/10.1017/S003118202000164X
Acknowledgements
We thank the entire USDA WS NWRC Hawaii Field Station and the UH-Hilo Jarvi Lab for their help with data collection, especially R. Sugihara, T. McAuliffe, N. Preston, D. Sedgewick, A. Deane, K. Snook, J. Jacobs, A. Steel and B. Torres Fischer. Additional thanks to Craig Blaisdell of the State of Hawaii, Department of Defense Environmental Office and to Pana'ewa Rainforest Zoo & Gardens. Reference herein to any specific commercial products, process, or service by trade name, trademark, manufacturer, or otherwise, does not necessarily constitute or imply its endorsement, recommendation, or favouring by the US Government.
Financial support
This work was supported in part by the US Department of Agriculture, Animal and Plant Health Inspection Service, Wildlife Services, National Wildlife Research Center; the Daniel K. Inouye College of Pharmacy, University of Hawaii at Hilo; the Hawaii State Legislature; a grant from the Hawaii Department of Land and Natural Resources, Hawaii Invasive Species Council; and by Strategic Science Investment Funding from the New Zealand Ministry of Business, Innovation and Employment.
Conflict of interest
None.
Ethical standards
All animal use was reviewed and approved by the USDA WS NWRC Institutional Animal Care and Use Committee under protocol QA-2835.


