


INTRODUCTION
Infections by parasites can have considerable consequences for their free-living hosts, including alterations in habitat utilization, and foraging and antipredator behaviours (Barber et al. Reference Barber, Hoare and Krause2000; Lefevre et al. Reference Lefevre, Lebarbenchon, Gauthier-Clerc, Misse, Poulin and Thomas2009). There remains relatively limited knowledge regarding the mechanistic basis of these alterations (Clerc et al. Reference Clerc, Ebert and Hall2015), with this also reflected in aspects of their ecological consequences (Lefevre et al. Reference Lefevre, Lebarbenchon, Gauthier-Clerc, Misse, Poulin and Thomas2009). It is, however, well established that parasites can have considerable consequences for food web ecology (e.g. Lafferty et al. Reference Lafferty, Dobson and Kuris2006; Wood et al. Reference Wood, Byers, Cottingham, Altman, Donahue and Blakeslee2007), with the trophic consequences of infections resulting from both manipulative parasites affecting the strength of trophic links involved in transmission, and from non-manipulative parasites that impair the functional traits of hosts (Hernandez and Sukhdeo, Reference Hernandez and Sukhdeo2008; Britton and Andreou, Reference Britton and Andreou2016). For example, sticklebacks Gasterosteus aculeatus infected with Schistocephalus solidus preferentially ingest smaller prey items of lower quality compared with uninfected sticklebacks (Milinski, Reference Milinski1984; Jakobsen et al. Reference Jakobsen, Johnsen and Larsson1988; Cunningham et al. Reference Cunningham, Tierney and Huntingford1994). Thus, parasite infections can restrict the prey handling and ingestion abilities of hosts and/or reduce the ability of hosts to compete for larger prey items with uninfected individuals due to factors including energetic constraints that result in shifts in competition symmetry between the infected and uninfected individuals (Barber et al. Reference Barber, Hoare and Krause2000; Britton, Reference Britton2013).
Populations of generalist species are increasingly recognized as comprising smaller sub-sets of relatively specialized individuals whose niches are then small sub-sets of the overall population niche (Bolnick et al. Reference Bolnick, Svanback, Araujo and Persson2007, Reference Bolnick, Svanback, Fordyce, Yang, Davis, Hulsey and Forister2003; Quevedo et al. Reference Quevedo, Svanback and Eklov2009). Empirical studies and foraging models suggest intraspecific competition increases individual trophic specialization (Svanback and Persson, Reference Svanback and Persson2004; Huss et al. Reference Huss, Bystrom and Persson2008). Whilst other drivers of trophic specialization include increased interspecific competition, the exploitation of new ecological opportunities, and the direct and indirect consequences of predation, there has been little consideration of how natural enemies, such as parasites, affect the magnitude of individual trophic specialization (Araujo et al. Reference Araujo, Bolnick and Layman2011; Britton and Andreou, Reference Britton and Andreou2016). This is despite the evidence already outlined that infections can alter host foraging behaviours and diet composition. Correspondingly, should parasite infections increase levels of competition for infected individuals then the niche variation hypothesis predicts that their sub-set of the population would become more specialized in their diet (Van Valen, Reference Van Valen1965). Conversely, under increasing resource competition, a shift to a larger trophic niche by these infected individuals might maintain their energy requirements (Svanback and Bolnick, Reference Svanback and Bolnick2007).
Consequently, the aim of this study was to identify how the infection of a model parasite species affects host populations in relation to their trophic niche size and the magnitude of individual trophic specialization. The objectives were to: (1) quantify the parasite prevalence, abundance, histopathology and energetic consequences of the model parasite on two fish species over five populations; (2) assess the trophic niche size of each fish population, and those of the two sub-sets of each population: uninfected and infected with the parasite; and (3) assess these outcomes in relation to niche theory and individual trophic specialization. The model parasite was Ergasilus briani, a non-native copepod gill parasite that originates from Southeast Asia and was first recorded in Great Britain in 1982 (Alston and Lewis, Reference Alston, Lewis, Pike and Lewis1994). It has a direct lifecycle that involves fish as its only host, with typical hosts in its invasive range being roach Rutilus rutilus and common bream Abramis brama of <100 mm (Alston and Lewis, Reference Alston, Lewis, Pike and Lewis1994). The hypothesis tested is that infected individuals will have a reduced trophic niche size compared with uninfected conspecifics and have impaired growth rates and energetics.
MATERIALS AND METHODS
Sample collection and initial data collection
Three freshwater study sites were selected in Southern England where E. briani infections were known to be present in the fish community and infecting R. rutilus and A. brama. The Basingstoke Canal (site 1; 51·276414N, 0·820642W) was historically supplemented with cyprinid fish through stocking but now has a self-sustaining fish community; it is of 6–10 m in width and maximum depth 2·5 m. Henleaze Lake (site 2; 51·49763N, 2·603867W) is a narrow lake in former quarry of 450 m in length, up to 8 m in width and with depths to 6 m. It had been previously stocked with carp Cyprinus carpio, A. brama and R. rutilus, with the latter two species now self-sustaining. Darwell reservoir (site 3; 50·963617N, 0·440719E) is a water supply reservoir of approximately 63 hectares where the fish community is dominated by R. rutilus, perch Perca fluviatilis and pike Esox lucius. It was the stocking activities on each site in the 1980s and 1990s that resulted in E. briani introduction.
The sampling methodology used at each site varied according to the physical habitat. At site 1, samples of A. brama were collected in October 2012 and samples of R. rutilus in October 2014 using a combination of use of a 25 × 2·7 m2 micromesh seine net and electric fishing. Samples of R. Rutilus and A. brama were collected from site 2 in October 2013 using the micromesh seine net. At site 3, samples of R. rutilus were available from a fishery sampling programme that captured these fish using a gill net of 30 × 2·5 m2 and mesh size 33 mm (knot to knot). Following their capture at all sites, all fish were initially retained in water-filled containers and for R. rutilus and A. brama, a random sub-sample of a minimum of 30 individuals per species was taken and transported to the laboratory for processing.
In the laboratory, all fish were euthanized (anaesthetic overdose; MS-222), with weight (W; to 0·01 g), and fork length (L; nearest mm) recorded. A detailed post-mortem was then conducted on each individual R. rutilus and A. brama for detecting the presence of infections of native and non-native parasites using a standard protocol adapted from Hoole et al. (Reference Hoole, Bucke, Burgess and Wellby2001). Skin scrapes and internal organs were examined with aid of low- and high-power microscopy to enable parasite identification. Gill arches from both gill cavities were removed and examined under low power for parasites, including E. briani. Following detection of a parasite, identification was to species level where possible. When E. briani was detected as present in a fish then their intensity of infection was recorded (i.e. number of parasites present). Hereafter, where an individual R. rutilus or A. brama is referred to as either infected or non-infected, it refers to the presence/absence of E. briani in that individual during this process. Gill tissue from infected and uninfected individuals was retained and prepared for histopathology. On completion of the post-mortem, a sample of dorsal muscle was taken from a proportion of the fish samples (sample sizes 6–15 per sub-set of fish per population). These samples were then dried at 60 °C to constant weight.
The dried samples were then analysed at the Cornell Isotope Laboratory, New York, USA. They were ground to powder and weighed precisely to ≈1000 µg in tin capsules and analysed on a Thermo Delta V isotope ratio mass spectrometer (Thermo Scientific, MA, USA) interfaced to a NC2500 elemental analyser (CE Elantach Inc., New Jersey, USA). Verification for accuracy was against internationally known reference materials, whose values are determined by the IAEA (International Association of Atomic Energy; Vienna, Austria), and calibrated against the primary reference scales for δ 13C and δ 15N (Cornell University Stable Isotope Laboratory, 2015). The accuracy and precision of the sample runs were tested for every 10 samples using a standard animal sample (mink). The overall standard deviation was 0·11‰ for δ 15N and 0·09 for δ 13C. Linearity correction accounted for differences in peak amplitudes between sample and reference gases (N2 or CO2). Analytical precision associated with the δ 15N and δ 13C sample runs was estimated at 0·42 and 0·15‰, respectively. The initial data outputs were in the format of δ isotope ratios expressed per thousand (‰). There was no lipid correction applied to the data as C:N ratios indicated very low lipid content and thus lipid extraction or normalization would have little effect on δ 13C (Post et al. Reference Post, Layman, Arrington, Takimoto, Quattrochi and Montana2002).
Histopathology
Histopathology of gill tissues was completed to assess the pathological changes associated with E. briani infection. Sections of gill were fixed in Bouin's fixative for 24 h before transferring to 70% industrial methylated spirit. The tissues were trimmed, dehydrated in alcohol series, cleared and then embedded in paraffin wax. Transverse and longitudinal sections of 3 µm were dried at 50 °C, stained using Mayer's haematoxylin and eosin, and examined microscopically for pathological changes and described accordingly.
Data analyses
Infection levels of E. briani in R. rutilus and A. brama were described as their prevalence (number of infected individuals/total number of individuals × 100) and abundance (number of E. briani per host).
The stable isotope data of R. rutilus and A. brama were used to assess their trophic niche size. Trophic niche size was calculated using the metric standard ellipse area (SEA) and thus represented the isotopic niche. Whilst the isotopic niche is closely related to the trophic niche, it is also influenced by factors including growth rate and metabolism, and thus is used only as a proxy of the trophic niche (Jackson et al. Reference Jackson, Inger, Parnell and Bearhop2011). SEAs were calculated in the Stable Isotope Analysis in R (SIAR) and Stable Isotope Bayesian Ellipses in R (SIBER) packages (Jackson et al. Reference Jackson, Inger, Parnell and Bearhop2011) in the R computing program (R Core Team, 2013). SEAs are bivariate measures of the distribution of individuals in trophic space. As each ellipse encloses ≈40% of the data, they represent the core dietary breadth and thus reveal the typical resource use within a species or population (Jackson et al. Reference Jackson, Inger, Parnell and Bearhop2011, Reference Jackson, Donohue, Jackson, Britton, Harper and Grey2012). Due to small sample sizes, then a Bayesian estimate of SEA (SEAB) was used for testing differences in niche size between analysed groups, with this calculated using a Markov chain Monte Carlo simulation with 104 iterations for each group (Jackson et al. Reference Jackson, Inger, Parnell and Bearhop2011; R Core Team, 2014; Tran et al. Reference Tran, Jackson, Sheath, Verreycken and Britton2015). This generated 95% confidence intervals around the SEAB estimates and thus where these confidence intervals did not overlap between comparator groups, the niche sizes were interpreted as significantly different. For each population of R. rutilus and A. brama in each site, SEAB was calculated for two sub-sets of individuals: those infected with E. briani and those uninfected. In addition, to enable calculation of the extent of the overlap of niches within each species, SEAc had to be calculated. The overlap in niche size was calculated as the extent to which the respected niches shared isotopic space (%).
Statistical analyses
For each fish species and population infected with E. briani, differences between the infected and uninfected hosts were tested for length using analysis of variance (ANOVA), and their stable isotopes of δ 13C and δ 15N using Mann–Whitney U tests. Condition was calculated as Fulton's condition factor K, where K = 100 × W/L 3, where L was measured in cm, with differences between infected and uninfected fishes also tested using Mann–Whitney U tests. Differences in weight between the infected and uninfected fish per population and species were then tested in a generalized linear model (GLM) where the effect of length on weight was controlled as a covariate; outputs included estimated marginal means of weight controlled for length for each sub-set of fish and the significance of their differences through pairwise comparisons with Bonferroni correction for multiple comparisons. Other than the stable isotope mixing models, all analyses were completed in SPSS v. 22.0. In all analyses, where parametric tests were used, the assumptions of normality of residuals and homoscedasticity were checked, and response variables were log-transformed to meet the assumption if necessary.
RESULTS
Parasite prevalence and abundance, and effect on fish length and weight
Prevalence and mean parasite abundance was highest at site 1 for both fishes, with the maximum abundance recorded being 66 E. briani in an individual R. rutilus (Table 1). The native parasites recorded were 13 species that would be considered as the expected parasite fauna of these fishes in a British community. These parasites were recorded at levels that were considered as not high enough to cause clinical pathology (Hoole et al. Reference Hoole, Bucke, Burgess and Wellby2001) and included species of Diplozoa, Piscicola, Dactylogyrus and Myxosporida. Across the dataset, there was no relationship between E. briani abundance and their number of native parasites per host (R. rutilus R 2 = 0·02, F 1,94 = 0·49, P > 0·05; A. brama R 2 = 0·03, F 1,94 = 0·52, P > 0·05). At site 1, the non-native parasite Ergasilus sieboldi was also detected in the gills of two A. brama. Due to the potential for E. sieboldi to confound subsequent analyses, these fish were omitted from the dataset.
Table 1. Prevalence and abundance of Ergasilus briani per site and species

a Sampled October 2012.
b Sampled October 2014.
Differences in fish lengths between the infected and uninfected fish were not significant at any site (ANOVA: site 1: R. rutilus F 1,19 = 0·11, P > 0·05; A. brama F 1,29 = 0·01, P > 0·05, site 2: R. rutilus F 1,14 = 0·84, P > 0·05; A. brama F 1,15 = 0·42, P > 0·05, site 3: R. rutilus F 1,19 = 0·01, P > 0·05; Table 2). Similarly, there were no significant differences between the body weight of infected and uninfected fish at any site when the effect of total length was controlled (GLM: site 1: A. brama Wald χ 2 = 1·27, P > 0·05; R. rutilus Wald χ 2 = 0·91, P > 0·05; site 2: A. brama Wald χ 2 = 0·001, P > 0·05; R. rutilus Wald χ = 0·67, P > 0·05), or in Fulton's condition factor, K (Mann–Whitney U tests: site 1: A. brama Z = 1·16, P > 0·05; R. rutilus Z = 0·83, P > 0·05; site 2: A. brama Z = 0·82, P > 0·05; R. rutilus Z = 0·48, P > 0·05).
Table 2. Sample sizes, mean lengths of subsampled fish and their mean stable isotope data at each study site

Histopathology
Histopathological examinations revealed consistent pathological changes associated with E. briani infection. Parasites attached to the ventral surface of the gill filament, between the hemibranchs, tight to the interbranchial septum. Whilst dissection of the gill was needed to confirm the presence of E. briani, their egg strings were often visible prior to removal of the gills (Fig. 1A). During attachment, the parasite's antennae (Fig. 1B) were used to engulf the base of the gill filaments, bringing the head of the parasite tight to the gill septum (Fig. 1C and D). This frequently led to displacement and distortion of filaments to accommodate the body of the parasite (Fig. 1C–E). Parasite attachment led to compression of the gill tissue, with flattening of the epithelium (Fig. 1D and E). This was often accompanied by hyperplasia, localized haemorrhaging, epithelial erosion and compression of blood vessels underlying the body of the parasite (Fig. 1E). Although no direct evidence for parasite feeding was observed, localized loss and compression of gill epithelium was often apparent adjacent to the mouth (Fig. 1F).
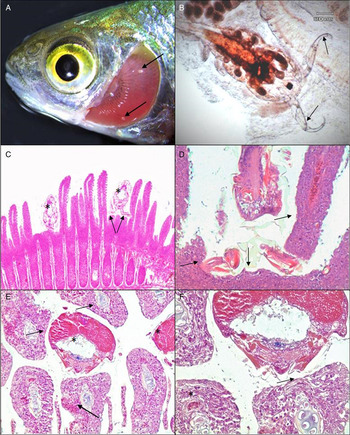
Fig. 1. Pathology of Rutilus rutilus infected with Ergasilus briani. (A) Presence of two E. briani (arrows) attached between the gill filaments following removal of the operculum. (B) Whole E. briani following dissection of the gill tissue, showing antennae used for attachment (arrows). (C) Histopathology of R. rutilus gill, with attachment of two E. briani (*) tight to interbranchial septum with displacement of filaments. The antennae can be seen engulfing multiple filaments (arrow). (D) Compression and distortion of gill tissue (arrow) adjacent to E. briani, indicative of forceful attachment to the base of the gill filaments. (E) Transverse section through infected gill arch, with multiple E. briani (*) attached between the hemibranchs, with compression and erosion of epithelium, localized haemorrhage (arrow) and displacement of filaments. (F) Gill tissue adjacent to E. briani, showing epithelial loss and compression, with constriction of blood vessel underlying the parasite (arrow). Normal vessel shown away from the immediate site of parasite attachment (*).
Stable isotope metrics
The differences in the mean values of δ 13C and δ 15N between the infected and uninfected fish were not significant for any of the species at any site (Mann–Whitney U test: δ 13C: site 1: A. brama Z = 0·57, P > 0·05; R. rutilus Z = 0·23, P > 0·05 site 2: A. brama Z = 1·19, P > 0·05; R. rutilus Z = 1·80, P > 0·05; site 3: R. rutilus Z = 0·01, P > 0·05; δ 15N: site 1: A. brama Z = 0·57, P > 0·05; R. rutilus Z = 0·16, P > 0·05; site 2: A. brama Z = 1·30, P > 0·05; R. rutilus Z = 1·03, P > 0·05; site 3: R. rutilus Z = 1·48, P > 0·05) (Table 2). There was, however, a consistent pattern of trophic (isotopic) niche size being considerably higher in the uninfected sub-set of fish when compared with their infected conspecifics (Table 3; Fig. 2). The extent of the overlap between the tropic niches of each sub-set of the populations was high, with infected A. brama sharing 95 and 100% of trophic space with uninfected A. brama in Sites 1 and 2, respectively, and infected R. rutilus shared 91, 69 and 73% of trophic niche space with uninfected R. rutilus in Sites 1, 2 and 3, respectively (Figs 2–4). Where R. rutilis and A. brama were present in sympatry at site 2, there was minimal overlap in the trophic niches of their uninfected individuals (16·7%), but this increased between their infected sub-sets of individuals (89·2%) (Table 3; Fig. 3).

Fig. 2. Trophic niche width (as standard ellipse area, SEAc) of infected and uninfected Abramis brama and Rutilus rutilus from site 1. (A) A. brama sampled May 2012, (B) R. rutilus sampled October 2014. The black line represents the infected individuals and the grey line represents uninfected individuals.

Fig. 3. Trophic niche width (as standard ellipse area, SEAc) of infected and uninfected Abramis brama and Rutilus rutilus from site 2. The black line represents the infected individuals and the grey line represents uninfected individuals.

Fig. 4. Trophic niche width (as standard ellipse area, SEAc) of infected and uninfected Abramis brama and Rutilus rutilus from site 3. The black line represents the infected individuals and the grey line represents uninfected individuals.
Table 3. Trophic niche width (standard ellipse areas, as SEAB (95% confidence intervals)) and SEAc of the uninfected and infected sub-sets of fish per site, and their relative size and extent of isotopic niche overlap between the infected and uninfected sub-sets of fish (SEAc)

DISCUSSION
Across the R. rutilus and A. brama infected by E. briani, infections by native parasites were relatively minor, were not associated with major pathological changes and were not related to E. briani infection. In contrast, infections in the gills of both fishes by E. briani resulted in gross pathological changes characterized by displacement gill filaments, loss and compression of epithelium, hyperplasia and localized haemorrhaging within the filaments as a consequence of parasite attachment. This is consistent with pathological changes associated with other ergasilid parasites (Alston and Lewis, Reference Alston, Lewis, Pike and Lewis1994; Dezfuli et al. Reference Dezfuli, Giari, Konecny, Jaeger and Manera2003). When the trophic niche widths of infected and uninfected fishes were compared, these revealed a general and consistent pattern of trophic niche constriction in the infected fishes, as per the hypothesis, suggesting that the infected fishes were consuming specific food items that were also within the dietary range of uninfected individuals. Despite this diet specialization resulting in the trophic niche of infected individuals overlapping with the niche width of the sub-set of the infected individuals of the other species, this dietary specialization appeared sufficient to maintain their energetic requirements, given that infection did not adversely affect their individual condition, contrary to the hypothesis. Whilst it would have been advantageous to then investigate the diet of each sub-set of fish using, for example, stable isotope mixing models (Phillips et al. Reference Phillips, Newsome and Gregg2005), the putative food resource data collected at the sites did not enable adequate separation of dietary resources when applied to mixing models in SIAR (Jackson et al. Reference Jackson, Inger, Parnell and Bearhop2011, Reference Jackson, Donohue, Jackson, Britton, Harper and Grey2012).
Optimum foraging theory models typically assume that individuals rank alternative resources according to their energetic value per unit handling time, with this dependent on the resource traits and phenotypic capacity of individuals to capture, handle and to digest those resources (Araujo et al. Reference Araujo, Bolnick and Layman2011). This suggests individuals will feed on the most valuable resources, ignoring lower value resources when search and handling time could be better spent searching for more valuable ones (Bolnick et al. Reference Bolnick, Svanback, Fordyce, Yang, Davis, Hulsey and Forister2003). Thus, niche variation between individuals is largely dependent on the diversity and abundance of available resources vs the phenotypic traits of the individual (Crowden and Broom, Reference Crowden and Broom1980; Stephens and Krebs, Reference Stephens and Krebs1986). Our outputs, revealing that infected fishes had increased specialization in their trophic niche, it can be argued that this was associated with the phenotypic changes resulting from the infection pathology. However, given that the study was based on field studies rather than manipulative experiments and thus identified correlative relationships rather than definitive causal mechanisms, then an alternative explanation for the patterns detected in the data was that dietary specializations was a driver of infection (Pegg et al. Reference Pegg, Andreou, Williams and Britton2015; Britton and Andreou, Reference Britton and Andreou2016). Indeed, contrasting parasite infections can develop between individuals in a population as a consequence of existing trophic niche specializations (Britton and Andreou, Reference Britton and Andreou2016). This is because dietary specializations that result from variability in, for example, fish body and/or gape size, or their habitat utilization (e.g. littoral vs open-water), can elevate the exposure of individuals to some parasites (Bolnick et al. Reference Bolnick, Svanback, Fordyce, Yang, Davis, Hulsey and Forister2003; Britton and Andreou, Reference Britton and Andreou2016). Although more often associated with parasites with complex lifecycles, where dietary specializations increase the exposure to intermediate hosts (Pegg et al. Reference Pegg, Andreou, Williams and Britton2015), differences in the behavioural traits of fish can also result in the acquisition of higher numbers of copepod parasites (Poulin et al. Reference Poulin, Rau and Curtis1991). Consequently, whilst we suggest that infection was the driver of the dietary specialization due to the histopathological impacts of infection detected, that specialization in habitat use, diet or behaviour was a driver of E. briani infection cannot be ruled out. It is recommended that experimental studies completed in more controlled conditions are used to test this in future.
That E. briani infection was the driver of trophic niche specialization, rather than a consequence, is supported by a number of studies that have revealed parasites impact host foraging efficiency through a variety of physiological, pathological and behavioural mechanisms (Britton and Andreou, Reference Britton and Andreou2016). These infection consequences resulting in, for example, altered time budgets through increased time spent foraging (Giles, Reference Giles1983; Barber et al. Reference Barber, Huntingford and Crompton1995; Britton and Andreou, Reference Britton and Andreou2016), and alterations in diet composition compared with non-infected individuals (Milinski, Reference Milinski1984). Moreover, in other animals infected with gill parasites, shifts in heart rate and oxygen consumption have been recorded (Schuwerack et al. Reference Schuwerack, Lewis and Jones2001), along with reduced haemoglobin levels (Montero et al. Reference Montero, Crespo, Padros, De la Gandara, Garcia and Raga2004), which impact swimming efficacy (Duthie and Hughes, Reference Duthie and Hughes1987) and the ability to maintain normal intestinal function while swimming (Thorarensen et al. Reference Thorarensen, Gallaugher, Kiessling and Farrell1993). In other ergasilid parasites, gill damage also results in respiratory dysfunction, osmoregulatory failure, and haematological disruption (e.g. Abdelhalim et al. Reference Abdelhalim, Lewis and Boxshall1991; Alston and Lewis, Reference Alston, Lewis, Pike and Lewis1994; Dezfuli et al. Reference Dezfuli, Giari, Konecny, Jaeger and Manera2003). As a consequence of these studies, we thus speculate that the infected fishes in our study increased their predation of prey that were highly abundant and/or relatively slow moving, and thus required relatively low-energy expenditure to capture and handle during foraging, as a consequence of some energetic costs associated with infection. However, this was not quantified experimentally in our study and thus is another recommendation for further work.
For predator populations containing infected individuals, whilst specialization may be beneficial at the population level as it appears to facilitate the survival of infected individuals despite the pathological impacts incurred (Lomnicki, Reference Lomnicki1988), the sub-set of specialized individuals might be at greater risk from external pressures (Durell, Reference Durell2000). For example, the increased time spent foraging and/or the utilization of different habitats to preferentially forage on specific prey items, allied with the potential for their antipredator behaviours being modified, might result in increased predation risk (Lafferty, Reference Lafferty1999; Barber et al. Reference Barber, Hoare and Krause2000; Ward et al. Reference Ward, Hoare, Couzin, Broom and Krause2002). Indeed, when infected with S. solidus, three-spined stickleback G. aculeatus spend more time foraging as a compensatory mechanism (Giles, Reference Giles1987), resulting in a trade-off with antipredator behaviours (Giles, Reference Giles1983), and thus incurring a greater likelihood of being predated by a piscivorous bird (Milinski, Reference Milinski1985). Similarly, infected banded killifish Fundulus diaphanous are more likely to occupy the front of shoals, a position that optimises feeding opportunities but also carries the greatest risk of predation (Ward et al. Reference Ward, Hoare, Couzin, Broom and Krause2002).
The focal parasite of this study, E. briani, is an introduced parasite to the UK, arriving as a consequence of fish being moved within aquaculture and fisheries (Fryer and Andrews, Reference Fryer and Andrews1983). It thus represents a parasite that was successfully introduced into the UK, despite such movements often resulting in non-native parasites failing to establish through, for example, enemy release (Sheath et al. Reference Sheath, Reading, Williams and Britton2015). The consequences of introduced parasites within native communities can be varied, but can result in disease outbreaks resulting in high fish losses. For example, the rosette agent Sphareothecum destruens, spread via the invasive topmouth gudgeon Pseudorasbora parva, can cause high mortality rates in naïve fishes (Andreou et al. Reference Andreou, Arkush, Guegan and Gozlan2012) and the impact of the introduced Gyrodactylus salaris in Norway was the collapse of wild salmon populations in 45 Norwegian rivers (Peeler and Thrush, Reference Peeler and Thrush2004) with an economic cost in excess of US$ 500 000 000 (Hansen et al. Reference Hansen, Bachmann and Bakke2003). Whilst the impact of E. briani here was much less dramatic, our outputs suggested that ecological alterations did occur as a potential cost of infection, with modification of host diet composition that constricted the trophic niche of the host component of the population.
Studies on trophic niche specialization have identified a range of causal factors, particularly inter- and intra-specific competitive processes, predation pressure and impact and the exploitation of new ecological opportunities (Araujo et al. Reference Araujo, Bolnick and Layman2011). The role of parasitism in trophic niche specialization has, conversely, received very little attention (Britton and Andreou, Reference Britton and Andreou2016). Consequently, our findings that the trophic niches of individuals infected with E. briani were consistently constricted and specialized across five fish populations are important. They suggest that the host consequences of infection, including pathological impacts, could also be an important driver of niche constriction that has been largely overlooked and thus should be incorporated into future studies on the ecological drivers of trophic niche specialization.
ACKNOWLEDGEMENTS
The authors thank the fishery owners and managers who gave permission for fish to be sampled on their waters; as well as AES Europe Ltd who assisted with sample collection at site 2; and Ian Wellby and John Wall for assistance with sample collection from site 3. They thank Environment Agency employees for their assistance in obtaining consents for sampling and advising on suitable sites. Views expressed in the paper are those of the authors and not their parent organizations.
FINANCIAL SUPPORT
JP was funded by a studentship from the Fisheries Society of the British Isles and Bournemouth University.


