INTRODUCTION
Coral reef fauna is known to be dominated by planktivore animals (Harmelin-Vivien, Reference Harmelin-Vivien1981; Sorokin, Reference Sorokin and Dubinski1990, Reference Sorokin1993). Phytoplankton and heterotrophic microplankton provide nutrition for numerous pelagic and benthic filterers and sediment feeders. Zooplankton forms a basic food source for various pelagic predators like fish larvae, planktivorous and omnivorous fish, pelagic and benthic coelenterates, bryozoans, tunicates and for the corals themselves. Consequently, the trophodynamics of the сoral reef ecosystems depends critically on plankton dynamics progress in the waters surrounding coral reef. The interaction between reef and surrounding waters is poorly understood and plankton studies on coral reefs need yet to address the principal problem of coral reef ecology, which suggests a discrepancy between low pelagic productivity of oligotrophic coral reef waters (Furnas, Reference Furnas1991) and the abundance and diversity of reef planktivore fauna. There are three principal causes of this imbalance: (a) an underestimation of the contribution of microheterotrophs to the production of particulate food; (b) an underestimation of mesozooplankton standing stock; and (c) that only plankton production (not just the standing stock) is available for reef planktivore fauna.
This imbalance has also been suggested in recent publications on primary production and plankton abundance in the waters of the central Great Barrier Reef (GBR) (Moriarty et al., Reference Moriarty, Pollard and Hunt1985; Jacoby & Greenwood, Reference Jacoby and Greenwood1988; Furnas & Mitchell, Reference Furnas and Mitchell1990; Roman et al., Reference Roman, Furnas and Mullin1990; Brodie et al., Reference Brodie, Furnas and Steven1997; McKinnon et al., Reference McKinnon, Duggan and De'Ath2005). To address this, we undertook an investigation of plankton abundance and productivity in this area of the GBR in the summer 1999–2000. We assessed the standing stocks and production of the principal groups of micro- and mesoplankton including the benthos–planktonic demersal component. Whole plankton respiration and concentrations of labile organic matter, suspended organic matter and total phosphorus were also measured in order to disclose the allochthonous energy and nutrient sources involved in the creation of plankton production in reef waters. The relative importance of autochthonous and allochthonous energy sources in reef pelagic communities was also assessed (Sorokin, Reference Sorokin and Dubinski1990; Venier & Pauly, Reference Venier and Pauly1997). We also intended to compare the concentration of microplankton and zooplankton thus far recorded in reef waters with the known threshold limits for the nutrition of filtering, seston feeding and predatory reef planktivore fauna. This kind of comparison provides an additional way to verify the reliability of the data on plankton abundance.
MATERIALS AND METHODS
Field research was undertaken between November 1999 and February 2001 at the Low Isles Research Station of the University of Queensland. The sampling area covered the principal habitats in the Tribulation zone of the central GBR between 16° and 17°S. Basic cross-sections began in the estuarine area of the Mosman River (depth-range 6 to 12 m) and then crossed the deep lagoon up to the Batt Reef (Station 6). Station 5 was situated in the boat channel 28 m deep, 3 miles to the east of Low Isles reef (Figure 1A). The inner lagoon of Low Isles reef 1.5 to 1.8 m deep was sampled during high tide (Figure 1B). Mangrove habitats were sampled in the mangrove forest site of Low Isles reef (Figure 1B) and in the intertidal Daintree River, which crosses the coastal mangrove forest (Figure 1C). The basic cross-section was sampled 3 times. Each sampling mission was carried out in daytime and at night. Time series sampling was also undertaken in the inner lagoon and at its external margins to investigate diel migrations of zooplankton.

Fig. 1. Schemes showing the position of the stations: A, at the main cross-section; B, in the Low Isles lagoon and reef; C, in the intertidal Daintree River and estuary.
The selection of analytical methods used was based upon our former experience (Sorokin, Reference Sorokin1999). The stock of labile organic matter (LOM) was estimated via the measuring of BOD-25. Total phosphorus was analysed in the intact water samples fixed with 0.5 ml 10 N H2SO4 after persulphate oxidation of seston (Parsons et al., Reference Parsons, Maita and Lallo1984). The microplankton was quantified within its principal groups: bacterioplankton, phytoplankton, planktonic protozoa and metazoan larvae. Wet biomass of the microplankton components was assessed as equal to their biovolume calculated after the number of cells per 1 m−3 and mean cell volume expressed in μm3. In this case, 109 μm3 correspond to 1 mm3 of biovolume or to 1 mg of wet biomass. Bacterioplankton, phytoplankton zooflagellates and nano-ciliates were quantified by epifluorescence microscopy afterwards (Hobbie et al., Reference Hobbie, Daley and Jasper1977; Caron, Reference Caron1983). Ciliates >30 µm size were quantified by viable counting in a chamber 4 mm deep with 30 cm3 capacity (Sorokin, Reference Sorokin1999). Metazoan larvae were collected using a 40 µm net.
The mesozooplankton was collected in the shallows by filtering 50 l of water taken with a bucket through a net with a 40 µm mesh (Glynn, Reference Glynn1973; Sorokin, Reference Sorokin and Dubinski1990, Reference Sorokin1994). In the deep lagoon, a Juday's type 120 µm mesh net was towed vertically. The upper ring diameter for this net was 20 cm and 30 cm for the lower ring. The samples were fixed with Lugol solution and were processed over several days using a 5 mm deep, 50 cm3 round plastic chamber with the bottom lined with intervals equal to the diameter of a field stereoscope. The chamber was filled with the sample without air bubbles. The total wet biomass of mesozooplankton (mg m−3) was assessed as the sum of biomasses of its key size-taxonomic groups, which were calculated accounting for the numerical abundance of each group expressed as ind. per 1 m3 of water filtered and the mean individual weight of plankters.
The volume of water filtered by the net was calculated knowing the tow length and the area of the upper ring. The mean individual weights of some zooplankters are given in Table 1. The weight of demersal zooplankton was measured directly using a sensitive balance.
Table 1. Ranges of individual wet weights (W) of the principal zooplankton groups (based on Glynn, Reference Glynn1973; Afrikova et al., Reference Afrikova, Lutzarev and Petipa1977).

The catching efficiency of towing plankton nets is generally less than 100% (Sorokin & Pavelyeva, 1972; Sorokin, Reference Sorokin and Dubinski1990). Therefore, each net has to be calibrated for its efficiency. We calibrated our Juday's net as follows. The net was fixed within the frame with floats attained to keep the net in a horizontal position at a depth of 30 cm under the water surface. The net was towed for 20 m in the inner and also the deep lagoons. Before and after towing, 100-l of water collected in the bucket was filtered through a 40 µm plankton net to obtain a reference sample. The catching efficiency was calculated as the percentage ratio of total biomass (mg m−3) and total number (ind. m−3) of zooplankton assessed in the net sample to those found in the reference sample. The calibration procedure was repeated five times. The mean catching efficiency of this net was thus assessed at 50% in relation to the zooplankton number, at 60% in relation to its total biomass, at 54% in relation to the copepod biomass and 70% in relation to the biomass of chaetognaths.
The biomass of the whole bentho-planktonic community which hide during the day time in the bottom substrates like macrophytes or coral rubble was assessed as follows. The samples of such substrates were gently collected and placed underwater in the plastic bags. The pre-weighed samples were subsequently thoroughly washed in 2 volumes of water to wash out the hidden fauna. Then both washes were filtered via a 200 µm mesh net to separate and to quantify the washed out plankters.
Phytoplankton primary production was measured with a version of the radiocarbon technique (Sorokin, Reference Sorokin1999). Glass bottles (400 ml) were used for the in situ incubations which lasted 3 to 4 hours. The respiration rate was determined with the oxygen bottle method. Dark bottles (400 ml) were incubated at the in situ temperature. Dissolved oxygen was measured with the Winkler method. Bacterial production (Pb) was calculated after the decomposition rate (D) expressed as mg C m−3 d−1: Pb = 0.28 D mg C m−3 d−1. This coefficient (0.28) was adapted experimentally for the reef waters by measuring the ratio of bacterial production to decomposition rate D, both expressed in the carbon units, in the same water sample. The bacterial production was assessed in this case with the use of the dark CO2 uptake method (Sorokin, Reference Sorokin1999).
RESULTS
Microplankton composition and biomass
Phytoplankton biomass in waters of the deep lagoon ranged from 120 to 150 mg m−3 (Table 2). In the estuarine areas, it varied ranging from 130 to 345 mg m−3. Pico-fraction was dominated by Synechococcus and Prochlorococcus. Nano-algae were mainly represented by chrysomonadic flagellates. Random trichomes and colonies of Trichodesmium were also present in the zooplankton samples collected with a 40 µm net. However, a large floating slick of Trichodesmium had drifted into the lagoon on 9 February as there was a strong easterly wind. The slick appeared 1 to 2 km to the north of the Low Isles reef and reached the continental coast the next day. The biomass of Trichodesmium in this slick was 0.75 g m−3, the surface primary production 0.1 g C m−3 d−1 and the specific production nearly 0.1 per day, compared to 1 to 2 in the pico- and nanophytoplankton fraction. This suggests that the Trichodesmium in the drifting slick was senescent.
Table 2. Whole plankton density and its composition estimated during the daytime and at night in the principal habitats of the central Great Barrier Reef November–January; abbreviations for dominant zooplankton groups: cp, copepods; ch, chaetognath larvae; ap, appendicularia larvae; os, ostracods; ms, mysids; zo, zoea; am, amphipods, pl, polychaetes; nm, nematods; jl, jelly plankton. All data are given as wet biomass.

Bacterioplankton numbers ranged in the reef waters from 0.6 to 3.5 × 10⁶ cells ml−1 (Table 3), and the wet biomass between 88 and 440 mg m−3 (Table 2). This density was close to the phytoplankton biomass or exceeds it by 2 to 3 times. In the estuarine waters, the biomass of bacteria reached over 300 mg m−3. The protozoan community was dominated by zooflagellates and oligotrichia ciliates. The number of zooflagellates ranged from 0.5 to 16 × 106 cells l−1, and their wet biomass was from 2 to 20 mg m−3. The number of ciliates ranged from 2 to 18 × 103 cells l−1, and their biomass from 6 to 100 mg m−3 (Tables 2 & 3). The biomass of meroplanktonic larvaceans (nauplii and trochophores) was most often less than 10 mg m−3. The number of nauplii in the deep lagoon varied from 0.5 to 6.0 × 10³ m−3 (Table 3).
Table 3. Numerical density of basic plankton components in the research sites given as range sampled at the stations; d-r, depth-range.

Mesozooplankton was abundant in the Mosman estuarine zone at Stations 1 and 2, even during daytime. Its numbers ranged from 11 to 28 × 103 ind. m−3 and biomass from 650 to 1260 mg m−3. At night, the biomass increased from 840 to 2320 mg m−3. The water column biomass at these stations was nearly 7 g m−2 during the daytime, increasing up to 10 to 16 g m−2 at night (Table 2). The demersal fraction, being represented mostly by mysids and amphipods, contributed 30 to 60% of the nocturnal zooplankton biomass. In the deep lagoon at Stations 5 and 6, the daytime zooplankton biomass was between 200 and 400 mg m−3, or 35 to 70 mg m−3 of the dry weight, assuming a dw/ww ratio 0.18 (Petipa, Reference Petipa1977). At night, the zooplankton biomass increased 2 to 3 times, attaining 700 to 890 mg m−3, with a numerical density up to 16 ind.103 m−3 (Tables 2 & 3). The daytime water-column biomass was 5 to 15 g m−2 in this area. At night, it reached up to 32 g m−2. The demersal fraction contributed 30 to 50% of the nocturnal zooplankton biomass (Table 2; Figure 3). The greatest values of 1935 mg m−3 and 87 g m−2 in the water column were recorded at night at Station 14, taken at the outer barrier in the pass between Batt and Tongue reefs at a depth of 45 m.

Fig. 2. Biomass (B, mg m−3, wet weight) of phytoplankton size fractions at the main cross-section stations .

Fig. 3. Shares of zooplankton components in its total biomass at the main cross-section; numbers above the columns, wet zooplankton biomass, mg m−3.
The shallow inner lagoon of the Low Isles ring reef is 1.5 to 2 m deep at high tide, and 0.2 to 0.7 m during the ebb. The daytime zooplankton density over the seagrass–rubble bottom was between 1.5 and 2.2 × 10³ ind. m−3 and its wet biomass between 9 and 30 mg m−3. At night, it increased 10 to 100 fold, attaining 1 to 4 g m−3 (Tables 2, 3 & 4). However, the maximal daytime zooplankton density was recorded during the afternoon ebb over the margins of sand–grass flat 5 to 10 cm deep at a water temperature 37 to 39°C and oxygen saturation of over 200%. The zooplankton density attained there was 45 × 103 ind. m−3 and the biomass was 710 mg m−3.
Table 4. Change of zooplankton density and composition after sunset recorded during time series sampling at Station 6 (Pontoon) 6 m deep at the Low Isles windward coral reef 17.11.

The data on the dynamics of demersal zooplankton during the night (Table 4; Figures 3 & 4) suggest that only a part of this community appear in the water column during the night. It means that its real density should be at least 3–5 times greater than that accounted for in the nocturnal samples in the inner lagoon or in the adjacent reef shallows outside. This concentration is supported by the results for the quantification of bentho-planktonic demersals hidden during the daytime in the typical bottom substrates of reef shallows (Table 5). Their biomass appeared to be about one order of magnitude greater than could be accounted for during nocturnal sampling. The wet biomass of this zooplankton fraction reached 20 to 40 g m−2. Copepod populations increased rapidly as darkness fell. The most common were Pseudocalanus, Tigriopus, Tisbe and miscellaneous harpacticoid copepods. Demersal behaviour features are also displayed by some common neritic calanoid copepods (Hamner & Carleton, Reference Hamner and Carleton1979).

Fig. 4. Daily fluctuations of total zooplankton biomass (Btot, mg m−3) and of its principal groups at the slope of the Low Isles reef (Station 7a, 6m depth); abbreviations for the zooplankton groups: cop, copepods; chaet + app, chaetognath + appendicularian larvae; mys, mysids; amph, amphipods; ost, ostracods; pol, polychaetes: the arrows indicate the sampling times.
Table 5. Numerical abundance (N) and biomass (B, g) of benthoplanktonic fauna contained in the bottom substrates of the Low Isles reef flats and in lagoon shallows; ww and dw, wet and dry weight units.

Stock and dynamics of organic matter
The same parameters were measured at key stations in the deep lagoon and in the Low Isles lagoon (Table 6). Surface phytoplankton primary production was greatest in the Mosman estuarine area at Stations 1 to 3, ranging between 41 and 133 mg C m−3 d−1 (mean 72 mg C m−3 d−1). In the deep lagoon, primary production was 20 to 32 mg C m−3 d−1. This is a typical level for GBR lagoon waters, where the wet phytoplankton biomass is 80 to 250 mg m−3 and the chlorophyll content 0.2 to 0.6 mg m−3 (Furnas & Mitchell, Reference Furnas and Mitchell1990; Liston et al., Reference Liston, Furnas, Mitchell and Grew1992; Brodie et al., Reference Brodie, Furnas and Steven1997). The integrated primary production in the water column ranged between 0.18 and 0.48 g C m−3 d−1 (mean 0.36 g C m−3 d−1), which corresponds to upper level in oligotrophic marine basins.
Table 6. Mean values of standing stock of labile organic matter (LOM), its residence time (T), its production and decomposition rates in pelagic communities for principal habitats in the Tribulation zone of Great Barrier Reef.

The decomposition rate corresponds to the whole plankton respiration rate and reflects the daily flux of labile organic matter. These parameters ranged between 0.32 and 0.62 mg O2 l−1 d−1 or 84 to 165 µg C l−1 d−1 in the deep lagoon, and thus exceeding primary production by 1.3 to 5.0 times (Dc/Ps-ratio). The integrated decomposition rate in the water column ranged from 1 to 2.5 g C m−2 d−1, which is 2.8 to 11.8 times greater than pelagic primary production (Dt/Pt ratio).
The standing stock of labile organic matter in the water (LOM) was nearly 1 mg C l−1 in the deep lagoon and approximately 2 mg l−1 in the estuarine zone. In the water column at Stations 3 to 6, it attained 1.9 to 3.6 g C m−2. The share of LOM in total Corg in marine waters is nearly 20 to 25% (Zsolnay, Reference Zsolnay1975; Torreton et al., Reference Torreton, Pages and Tolbo2002). Thus, the total Corg in reef water during high tide can be expected at 4 to 6 mg C l−1. During the ebbs, it should be 10 to 14 C l−1. LOM constitutes the principal energy source for pelagic and benthic heterotrophic production in the deep lagoon. The residence time of LOM (T) in the lagoon water was 8 to 15 days, thus suggesting an intensive turnover (Table 6).
Primary production in the inner lagoon during the high tide was similar to that in the deep lagoon, e.g. 20 to 35 mg C m−3 d−1. During the ebb tide period, it decreased to 6 to 10 mg C m−3 d−1 (Table 6), while heterotrophic activity doubled. The decomposition rate ranged between 68 and 242 µg C l d−1 rising during the ebbs. These data suggest an exuding of excess benthic photosynthetic production, which is created by abundant macro- and microphytobenthos (Sorokin, Reference Sorokin1993; Torreton et al., Reference Torreton, Pages and Tolbo2002).
Plankton dynamics in the Daintree River and estuary
The intertidal Daintree River flows through a vast mangrove forest as it nears the coast. Tidal saline waters reach 4 to 6 km upstream. Three cruises undertaken in this area (at midday, late evening and midnight) coincided with the beginning of the ebb. Fresh and brackish parts of the river contained an abundance of phytoplankton with a biomass of 390 to 940 mg m−3 and with photosynthetic production from 260 to 340 mg C m−3 d−1 (Tables 2 & 6). Most of the phytoplankton was small dinoflagellates, while in the mouth and estuarine areas, diatoms and symbiotic ciliates Mesodinium rubrum also appeared. Bacterioplankton in the river waters numbered over 2 × 10⁶ cells ml−1; its biomass was 300 to 800 mg m−3 (Tables 2 & 3). This was evidence that the river had been enriched with organic matter from the mangroves. Zooplankton was scarce in the river during the daytime (Station 7; Tables 2 & 3), but in the river mouth area and in the shallow turbid estuary filled with saline water (Stations 9 and 10), its daytime biomass increased from 700 to 800 mg m−3. During darkness, the zooplankton biomass rose 200 to 300 fold in the river, and 3 to 5 fold in its mouth and estuarine areas. The copepods Parvocalanus crassostris, Pseudodiaptomus griggae, and small harpacticoids dominated in the river. At Station 7 their number reached 70 × 103 m−3 and at Station 8 170 × 103 m−3, while in the daytime during the same tidal phase their numbers were only 110–130 ind. m−3 (Table 3). The mass of copepods of over 30 g m−2 might be hidden in the silted bed of the river. A greater part of their large nocturnal population, most probably, emerges from the bottom habitats of mangrove forest. Whole plankton biomass in the river at night reached 40 g m−2. Discharges of this mass of plankton into the lagoon during the nocturnal ebbs create an important food stock for the planktivorous fauna and especially for the fish larvae, which tend to accumulate in the estuarine zones of intertidal rivers (Williams & Hatcher, Reference Williams and Hatcher1983; Robertson et al., Reference Robertson, Dixon and Daniel1988).
The pelagic community in the river and estuary was characterized by intense metabolic activity. The decomposition rate was 150 to 300 µg C l−1 d−1, which was 3 to 4 fold greater than in the lagoon itself. The stock of labile organic matter found there was 1 to 2.3 mg C l−1 and its residence time 6 to 16 days (Table 6). Bacterial production in the river attained 60 µg C l−1 d−1, or up to 400 mg m−3 d−1 of wet biomass.
Total phosphorus content in water
The content of total phosphorus (Ptot) in water is among the principal parameters characterizing the trophic status of an ecosystem and its availability of nutrient resources (unlike the content of dissolved inorganic phosphorus, which reflects only a temporal balance between its consumption and regeneration rates). The latter stays in the reef waters monotonously at a level close to limiting phytoplankton growth, e.g. 0.02 to 0.2 µM (Crossland, Reference Crossland and Barnes1983). Mean Ptot content measured at 40 stations was around 0.5 µM (Table 7). The contribution of Ptot contained in the whole wet plankton biomass might be evaluated at a level of 0.15 to 0.25 µM, which corresponds to Ptot content in the particulate matter in waters of the GBR lagoon (Liston et al., Reference Liston, Furnas, Mitchell and Grew1992; Furnas et al., Reference Furnas, Mitchell and Skuza1997). In the Mosman River estuarine area in contact with the mangrove forest, the mean Ptot content attained 0.75 µM. The same was observed in the Daintree River estuary and in the mangrove forest of the Low Isles reef. The phosphorus enrichment comes from the mangroves, where the population of nearly 50,000 New Guinea pigeons nest. The phosphorus enrichment of the water over the shallow bottom of its inner lagoon is also combined with the capability of the resident filtering fauna to accumulate Ptot stock (Atkinson & Rigler, Reference Atkinson and Rigler1992; Sorokin, Reference Sorokin1992, Reference Sorokin1993).
Table 7. Contents of total phosphorus in waters of Low Isles region.

(+) numbers in parentheses, size of particulate organic phosphorus fraction.
Energy balance
The above data were used to create an energy balance approach based on the results of the biomass and production estimations expressed in energy units (kJ m−3). This analysis was aimed at assessing food demand, production and metabolic activity of the principal food web components in basic kinds of reef ecosystems. Such a balance could also indicate energy sources for the reef fauna. Necessary data on the biomass and production of phytoplankton and bacterioplankton were obtained experimentally in the same way as the data on biomass of micro- and mesozooplankton (Tables 2 & 6). The latter was assessed as the sum of copepod biomass plus triple biomass of bentho-planktonic demersals measured in the nocturnal samples, meaning that only about a third part of their total population appeared at a given moment at night in the water column (see above). For the biomass of benthic components and fish, corresponding published data were used (McWilliam et al., Reference McWilliam, Sale and Anderson1981; Sorokin, Reference Sorokin and Dubinski1990, Reference Sorokin1993). The production and food demands for reef fauna components were calculated with the use of recognized specific production coefficients (Table 8). The respiration rates (M) and ingested food ration (R) in heterotrophic food web components were calculated using known efficiency coefficients of secondary production (K2), and of assimilability for consumed food (I), given Table 8. Thus, M = P(I − K 2)/K 2, and R = M + P/I.
Table 8. Carbon and energy equivalents of wet biomass and convenient coefficients used for the calculation of energy balance in the reef ecosystem investigated; designations for the coefficients: K2, efficiency of secondary production; I assimilability efficiency of ingested food, %; μ, specific production per day (P/B). Based on Sorokin (Reference Sorokin1993), Zaika (Reference Zaika1973) Petipa (Reference Petipa1977); Grese (Reference Grese and Kinne1978).

Balances were calculated for the ecosystems of the deep and inner lagoons (Table 9). Corresponding models of energy fluxes in both these ecosystems were deduced by accounting for information on the nutrition of principal components of reef fauna (Pavlova et al., Reference Pavlova, Petipa, Sorokin and Vinogradov1971; Petipa, Reference Petipa1981; Grese, Reference Grese and Kinne1978; Sorokin, Reference Sorokin1999). The principal food web components are interconnected in these models not only with each other but also with the pool of dead organic matter both dissolved and particulate (Figures 5 & 6).

Fig. 5. Energy flow scheme (kJ m−2 d−1) in the deep Great Barrier Reef lagoon ecosystem; abbreviations: P, production; numbers in squares, food rations of subsequent food web components; numbers in ovals, non-digested food; numbers in trapezes, non-consumed food; AOM, allochthonous organic matter which arrives from the surrounding reefs, from the land, and from the Coral sea as drifting slicks of Trichodesmium; LOM, stock of dissolved labile organic matter in the water column.

Fig. 6. Energy flow scheme (kJ m−2 d−1) in the sand−grass flats ecosystem in the inner lagoon of Low Isles Reef; for designations see Figure 5.
Table 9. Biomass of food web components and energy balance in deep lagoon and shallow inner Low Isles lagoon ecosystems; designations for elements of food balance: R, food ration ingestion; A, assimilated part of food ration; P, production; M, metabolic losses; F, excretion.

An analysis of food balance and energy flux models in two of the most common reef biotopes demonstrates the key role of heterotrophic microplankton in the reef food webs, which functions as the link between benthic primary producers (algae, seagrasses, corals and mangroves) and filtering fauna both in shallow and deep reef habitats (Sorokin, Reference Sorokin and Dubinski1990, Reference Sorokin1994; Venier & Pauly, Reference Venier and Pauly1997). The role of phytoplankton in food webs in the reef shallows appears to be secondary to that of the bacterioplankton and microzooplankton (Figure 6). However, in the deep lagoon it is quite significant, supplying up to 40% of the mesozooplankton food demand (Figure 5).
DISCUSSION
The phytoplankton population in central and northern GBR waters is usually dominated by pico-fraction (Crosbie & Furnas, Reference Crosbie and Furnas2001; Figure 2). The biomass of phytoplankton was low to moderate even in the deep lagoon: 60 to 270 mg m−3 (Table 2). This range is close to that calculated after the chlorophyll data by Furnas & Mitchell (1990), e.g. the chlorophyll content between 0.2 and 0.6 mg m−3 corresponds to an approximate phytoplankton wet biomass of 60 to 240 mg m−3. This level of phytoplankton density is typical of oligotrophic oceanic waters. The main cause of phytoplankton paucity is due to inorganic phosphorus deficiency in reef waters, where it is used by bacterioplankton and benthic vegetation (Sorokin, 1982; Crossland, Reference Crossland and Barnes1983). However, primary production there was considerably high (0.1 to 0.4 g C m−2 d−1), because of the high specific production of reef phytoplankton, dominated by pico- and nanoalgae (Crosbie & Furnas, Reference Furnas, Mitchell and Wolanski2001; Figure 2).
The biomass of Trichodesmium, might be considered a source of allochthonus organic matter and nutrients in the GBR ecosystem. Floating slicks of Trichodesmium appear periodically in the GBR lagoon, driven there from the Coral Sea. Such slicks are often formed along the eastern shores of ultra-oligotrophic tropical basins such as the Coral Sea, and the South China Sea. Young Trichodesmium populations grow as single trichomes in oligotrophic tropical seas at the upper boundary of thermocline. The aging cells form coenobial bundles, which then float and lose their chlorophyll, gradually turning heterotrophic (Karnaukhov & Yashin, Reference Karnaukhov and Yashin2003). While accumulating in the surface film, they drift under the pressure of easterly trade winds and form dense slicks (‘blooms’) along the eastern shores which they encounter (Relevante et al., Reference Relevante, Williams and Bunt1982).
The joint wet biomass of microplankton in reef waters ranges between 300 and 600 mg m−3 (Table 2). Using a specific production over 1.5 per day (Tables 6 & 8), microplankton production might be expected to bee 0.5–1.0 g m−3 day. This level should be sufficient to meet the food demand of reef filterers and seston feeding fauna. The trophic status of the central GBR shelf waters is often misleadingly described as oligotrophic (Furnas, Reference Furnas1991), largely because of the low reported chlorophyll content in the water (<0.5 mg m−3). However, most other indices suggest that it is rather eutrophic (Sorokin, Reference Sorokin and Dubinski1990, Reference Sorokin1994). Among such indices, the Ptot content in water of 0.5 µM, the content of labile organic matter in water of 1.2 to 35 mg C l−1, the decomposition rate in water of 70 to 240 µg C l−1 d−1, the bacterioplankton production of 30 to 60 µg C m−3 d−1, the whole wet plankton biomass of 0.5 to 2.5 g m−3, the nocturnal zooplankton biomass 1 to 4 g m−3 and the biomass of fish at 160 g m−2 should be considered when assessing the trophic status.
The coral reef ecosystems are intrinsically eutrophic judging by the level of their organic productivity, their abundant heterotrophic life and the intense nutrient fluxes (Kinsey, Reference Kinsey and Baker1983, Sorokin, Reference Sorokin1993). They are open systems interacting with the energy metabolism of whole shelf ecosystems. The involvement of external organic matter as the basic energy source for bacterial and protozoan production in the deep lagoon is evidenced by the ratio of decomposition to local primary production rates in its water column (Dt/Pp in Table 6). The decomposition rate greatly exceeds the pelagic primary production. The largest energy flux is driven by heterotrophic microplankton in the deep lagoon (Table 9; Figure 5). The latter creates a principal food source for zooplankton and benthic-filtering fauna (Pavlova et al., Reference Pavlova, Petipa, Sorokin and Vinogradov1971; Sorokin, Reference Sorokin1993). Production in the water column of the deep lagoon was significantly greater by microheterotrophs than by phytoplankton (Tables 6 & 9): being 0.67 to 0.85 g C m−2, while primary production was 0.29 to 0.49 g C m−2 d−1. The flux of organic matter supporting this production must therefore be largely of an allochthonous origin, while local pelagic primary production by phytoplankton could supply around 15% of energy needed (Figure 5); the rest might be supplied by external sources.
The principal flux of organic matter enters the lagoon from the surrounding vast shallow reefs. The export of exuded organic matter, organic aggregates, detritus and microbenthos living biomass from coral reefs is well documented (Marshall, Reference Marshall1968; Hansen et al., Reference Hansen, Klumpp, Alongi, Dayton and Riddle1992; Sorokin, Reference Sorokin1993; Ferrier-Pages et al., Reference Ferrier-Pages, Leclerq, Jaubert and Pelegri1999; Torreton et al., Reference Torreton, Pages and Tolbo2002). The magnitude of this export may relate to the net autotrophic production of reef benthic associations. The limits of net production rates on barrier reefs may be evaluated between 3 and 8 g C m−2 d−1 against the background of gross primary production as between 5 and 11 g C m−2 d−1 (Barnes & Devereux, Reference Barnes and Devereux1984; Sorokin, Reference Sorokin1993; Pichon, Reference Pichon1997). Kinsey (Reference Kinsey and Baker1983) estimates the net photosynthetic production on the Rib reef of the central GBR close to 4.2 g C m−2 d−1. Vast shallow reefs of the outer barrier are occupied by patch reefs and by sand-grass rubble and macrophyte flats with abundant periphytonic overgrowth. They cover about 30% of the total shelf area in the Tribulation zone: 2500 km2 out of 8000 km2. With the most probable mean net benthic primary production in this area at 4 to 5 g C m−2 d−1, the input of excess organic matter from this area into the waters of the deep lagoon might be expected at about 1.4 to 1.8 g C m2 d−1. Hansen et al. (Reference Hansen, Alongi, Moriarty and Pollard1987) and Furnas & Mitchell (2001) estimate the contribution of the surrounding reefs to the primary production in the lagoon of the central GBR close to 50%, by the 10% coverage of shelf area by reefs. In the Tribulation zone it may be significantly greater. As an additional source of allochthonous organic matter the export of LOM and detritus from mangroves, the riverine discharge of detritus and plankton (Furnas & Mitchell, Reference Furnas, Mitchell and Wolanski2001) and the drifting Trichodesmium slicks can be considered.
Evaluation of zooplankton abundance in the GBR waters is difficult to carry out, although there are significant efforts to quantify it (McWilliam et al., Reference McWilliam, Sale and Anderson1981; Hodgeson, Reference Hodgeson1982; Sammarco & Crenshaw, Reference Sammarco and Crenshaw1984; Hamner et al., Reference Hamner, Jones, Carleton, Hauri and McWilliams1988; Roman et al., Reference Roman, Furnas and Mullin1990). The above publications use daytime vertical tows done with nets >200 µm mesh to evaluate mesoplankton biomass in the GBR waters and show limits of 1 to 10 mg C m−3 or around 10 to 100 mg m−3 wet weight. This seems to be between 5 times up to 1–2 orders of magnitude less than real (see Tables 2 & 4).
There is an underestimation in biomass determined in the above mentioned publications because no catching efficiency correction was used. The standard conical plankton nets undercatch the mesozooplankton between 2 to 10 times depending on the zooplankton composition and on the kind of a net (Sorokin & Paveljeva, Reference Sorokin and Paveljeva1972; Glynn, Reference Glynn1973; Sorokin, Reference Sorokin1994). Specialists from the Shirshov Institute of Oceanology, RAS, have rejected use of these towing nets for zooplankton sampling in the ocean for the last 20 years. They used 140 l water samples taken with a large water bottle on the vertical profile and then filtered via 60 µm mesh net (Shushkina & Vinogradov, Reference Shushkina, Vinogradov, Zatsepin and Flint2002), for this purpose, in the same way that was used to collect zooplankton in the reef shallows (Sorokin, Reference Sorokin and Dubinski1990, Reference Sorokin1994). Most of the standard plankton nets have meshes over 200 µm, and thus significantly under-catch small animals 0.15–0.25 mm wide. The latter became evident during our net calibrations (see Materials and Methods). The mesozooplankton fraction was represented mostly by small copepods and copepodides, and by slim appendicularian larvae. This fraction was almost absent in the parallel samples collected with the standard net 250 µm mesh. However, this fraction contributed to over 50% of zooplankton numerical density in the control samples. We have also calibrated the big conical net 275 µm mesh, which had been in use at the Low Isles Research Station since 1928. The catching efficiency of this net appeared to be 4% for the numerical density, and 20% for the biomass of the mesozooplankton.
Another probable cause of mesoplankton underestimating is the predominance of daytime tows during routine zooplankton sampling, notwithstanding the well-known abundance of demersals zooplankton in reef waters. The difference between the daytime and the nocturnal zooplankton biomass in the reef waters often attains 1 to 2 orders of magnitude (Glynn, Reference Glynn1973; Sale et al., 1976).
McKinnon et al. (Reference McKinnon, Duggan and De'Ath2005) used a double net supplied with a current meter. Their data appeared to be some 3 times greater than the above mentioned: 100 to 250 mg m−3 of wet biomass (10–25 mg C m−3). However, it was also some 3 to 5 times an underestimation in comparison with our data (see Table 2). The cause might be the ‘bucket’ effect induced by towing dense plankton nets with fine porosity (70 µm). In this case, the speed of the current and even its direction will be different in the centre of the net, where the current meter is fixed, and at its margins. Thus, the volume of water really filtered by the net might be much less then recorded by the current meter. For the correct measurement of water volume really filtered by the net, the current meter should be installed at its exit end as shown in Figure 7. Furthermore, the ‘bucket’ effect induces a pressure wave in front of the moving device, which should repel fast moving demersals like mysids or amphipods. This explains the small difference between the daytime and the nocturnal tows reported by the above authors. However, our results show that this difference is about 3 times in the deep lagoon and up 1 to 3 orders of magnitude over the reef shallows (Tables 2 & 4; Figure 4; Alldredge & King, Reference Alldredge and King1977; Porter & Porter, Reference Porter and Porter1977).
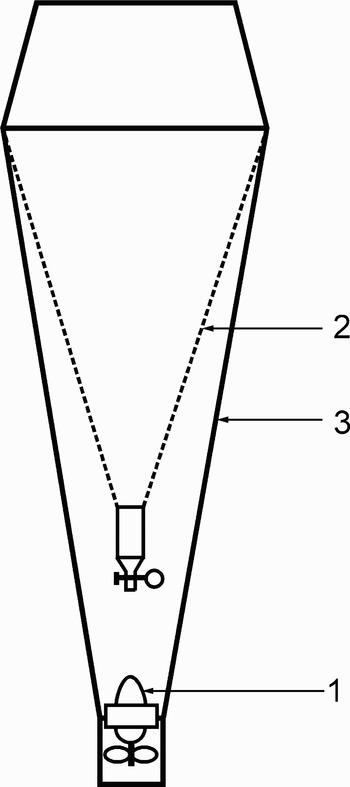
Fig. 7. Appropriate arrangement of plankton net supplied with the current meter; designations: 1, current meter, 2, gauze cone; 3, water impermeable tapestry cone.
The information on mesoplankton abundance in the GBR waters presented in the literature is often insufficient (Hodgeson, Reference Hodgeson1982; Robertson et al., Reference Robertson, Dixon and Daniel1988; Le Borgne et al., Reference Le Borgne, Blanchot and Charpy1989). For example, only numerical density is given, despite that the individual weights of plankters in this group varies within 2 orders of magnitude. The reliability of data on zooplankton abundance in reef waters might be verified by the comparison of its production with the food demand of zooplankton grazers in its environment. Alldrege & King (1977) found that zooplankton standing stock assessed at that time was less than 100 mg m−3 (wet weight) and that this did not match the calculated daily food demands of reef planktivore fauna estimated at 300 to 500 mg m−3. However, this discrepancy should really be 3–4 times greater since only zooplankton production, not just the standing stock, is available for grazing. Production of reef zooplankton should be calculated as the sum of production by holoplanktonic copepods plus the production by the whole demersal plankton fraction using corresponding coefficients of their specific production (Table 8) and data on their biomass (Tables 2, 4 & 5). Food demand by the zooplankton-feeding reef fauna could be calculated using the published data on mean biomass of its basic components in reef environments (McWilliam et al., Reference McWilliam, Sale and Anderson1981; Sorokin, Reference Sorokin and Dubinski1990, Reference Sorokin1993) and known values of their daily food rations (Table 8). For example, in a deep lagoon measuring 15 m deep with a sandy bottom the zooplankton wet biomass might be evaluated at 30 g m2 meaning that the holoplanktonic copepods contribute ~10 g m−2 and the benthoplanktonic demersals 20 g m−2. Correspondingly, its production should approach 3 g m−3 d−1. The food demand of zooplankton feeding animals in the lagoon should approach 3.5 g m−2 (wet weight) being contributed to by the Planktivore fish and crustacean demersals (biomass 30 g m−3, food ration ~2 g m−2 d−1), and by benthic zooplankton grazers like resident fish, crustaceans, bryzoans and zoantharians (meat biomass ~20 g m−2, food demand between 1 and 1.5 g m−1). However, zooplankton production by its maximal biomass of 10 to 20 mg C m−3 was claimed in the above mentioned publications as being expected at 2 to 4 mg C m−3d or around 0.3–0.6 g m−2 d−1of wet weight. This level of zooplankton production is 5–10 times less than the calculated food demand of zooplankton feeding fauna, thus suggesting a gross undercatch with the improved net tow technique, to say nothing of the most commonly used standard net tows.
The most abundant planktivore fauna is found in shallow habitats within a depth-range of 2 to 5 m with bottoms covered with corals, coral rubble and macrophytes. Its principal components are small planktivore fish, fish larvae, corals, hydroid, zantharians, bryozoans and ascidians. Their mean biomass might be assumed at around 15 to 20 g m−2 (McWilliam et al., Reference McWilliam, Sale and Anderson1981; Sorokin, Reference Sorokin1993). Their food demand should approach 1.5–2 g m−2d−1 of wet weight. Basic food sources to cover this demand might be created by the whole demersal community hidden in the bottom substrates during the daytime. This production should approach 1–2 g m−2d−1 of wet biomass by the biomass of demersals 20 to 40 g m−2 (see Tables 4 & 5). This source of food is accessible for the planktivore fauna, when a significant part of the demersal community (~20 to 40%) migrates at night into the water column (Glynn, Reference Glynn1973; Hobson & Chess, Reference Hobson and Chess1978; Harmelin-Vivien, Reference Harmelin-Vivien1981; Robertson et al., 1988). Indeed, bentho-planktonic demersals dominate in the gut content of reef fish (Harmelin-Vivien et al., 1988). Balance calculations based on the adequately assessed zooplankton standing stock including the whole community of demersals show that their joint production is sufficient to meet the food demands of abundant and diverse planktivore fauna on the coral reefs (Table 9). The realistic evaluation of plankton abundance in reef waters has another important aspect which remains ignored. The nutrition efficiency in planktivore animals critically depends upon the food concentration (Panov & Sorokin, Reference Panov and Sorokin1967; Gaudi, Reference Gaudi1974; Petipa, Reference Petipa1981; Sorokin, Reference Sorokin1993, Reference Sorokin1999). An optimal food concentration ranges between 0.5 and 1.0 g m−3 of wet biomass. This level is roughly the same in filter feeders and predators. With a concentration 0.2 to 0.3 g m−3, the assimilated food covers only the respiration losses (the ‘threshold’ concentration). Below this threshold, there is inadequate nutrition for survival. A zooplankton concentration in the GBR waters of less than 250 mg m3 of wet biomass reported in several publications (Hamner et al., Reference Hamner, Jones, Carleton, Hauri and McWilliams1988; Roman et al., Reference Roman, Furnas and Mullin1990; McKinnon, Reference McKinnon, Duggan and De'Ath2005) is less than the threshold, which suggests it was grossly underestimated. In reality, even the daytime zooplankton concentration in the deep lagoon and in the estuarine areas approaches the optimal 0.3 to 0.5 g m−3.
Hamner et al. (Reference Hamner, Jones, Carleton, Hauri and McWilliams1988) suggest that planktivore fish live mainly over the reefs and thus can collect zooplankton from a large volume of water and while passing over it they could acquire enough food despite the low concentration of zooplankton in this water (Roman et al., Reference Roman, Furnas and Mullin1990). This is not correct. First, the planktivore fish and especially the fish larvae, are not only concentrated over the reef ridges, but are randomly spread in the deep lagoon, where the biomass of fish is around 160 g m−2, while over the reef ridges it is close to 200 g m−2 (Williams & Hatcher, Reference Williams and Hatcher1983). Secondly, the fish catch zooplankton, which are always in motion. This makes no difference whether the water or the fish is moving. Only the food concentration can really influence the rate of nutrition (Petipa, Reference Petipa1981).
The standing stock of zooplankton contained in waters of the GBR lagoon, when appropriately quantified, is measured from 15 to 30 g m−2 of wet weight (accounting for demersals). Annual production would be expected roughly at 6000 kg ha−1. This production can support the annual production of only planktivore fish at 500–700 kg ha−1. Moreover, GBR reefs and lagoon are the feeding grounds for fry of many oceanic and coastal benthic and pelagic fish (Davis & Birdsong, Reference Davis and Birdsong1973; Russ, Reference Russ1984; Dredge, Reference Dredge1988; Hamner et al., Reference Hamner, Jones, Carleton, Hauri and McWilliams1988). From this viewpoint, an abundant zooplankton stock on the GBR shelf might be recognized as having a greater economic value than, for example, tourism.
ACKNOWLEDGEMENTS
The authors thank Professor P. Bell, who organized this study; Dr I. Elmetri and Mr S. Currie for their technical assistance during the field work; Dr P. Pollard and Clare O'Keeffe for English language assistance and Dr D. Kinsey and Professor J. Greenwood for their encouragement.