


1. Introduction
In the middle of Xinjiang, W China, there are three Precambrian blocks, known as Kuluketage (or Quruktagh), Keping and Middle Tianshan (Qin et al. Reference Qin, Sun, Li, Fang, Wang and Liu2002; Wang et al. Reference Wang, Wang and Wang2004). The Kuluketage Block outcrops on the NE margin of the Tarim Craton (TC) (Fig. 1a). It is believed to be representative of the TC basement, which was finally cratonized during the Tarimian Orogeny (Gao et al. Reference Gao, Chen, Lu, Peng and Qin1993; Q Li et al. Reference Li, Yu and Xiu2002). As the TC is covered by desert, the outcrops on the Kuluketage Block play an important role in recording the evolutionary history of the early crust. A lot of geological research has been carried out in the Kuluketage Block, especially regarding the geological chronology and geodynamic setting.
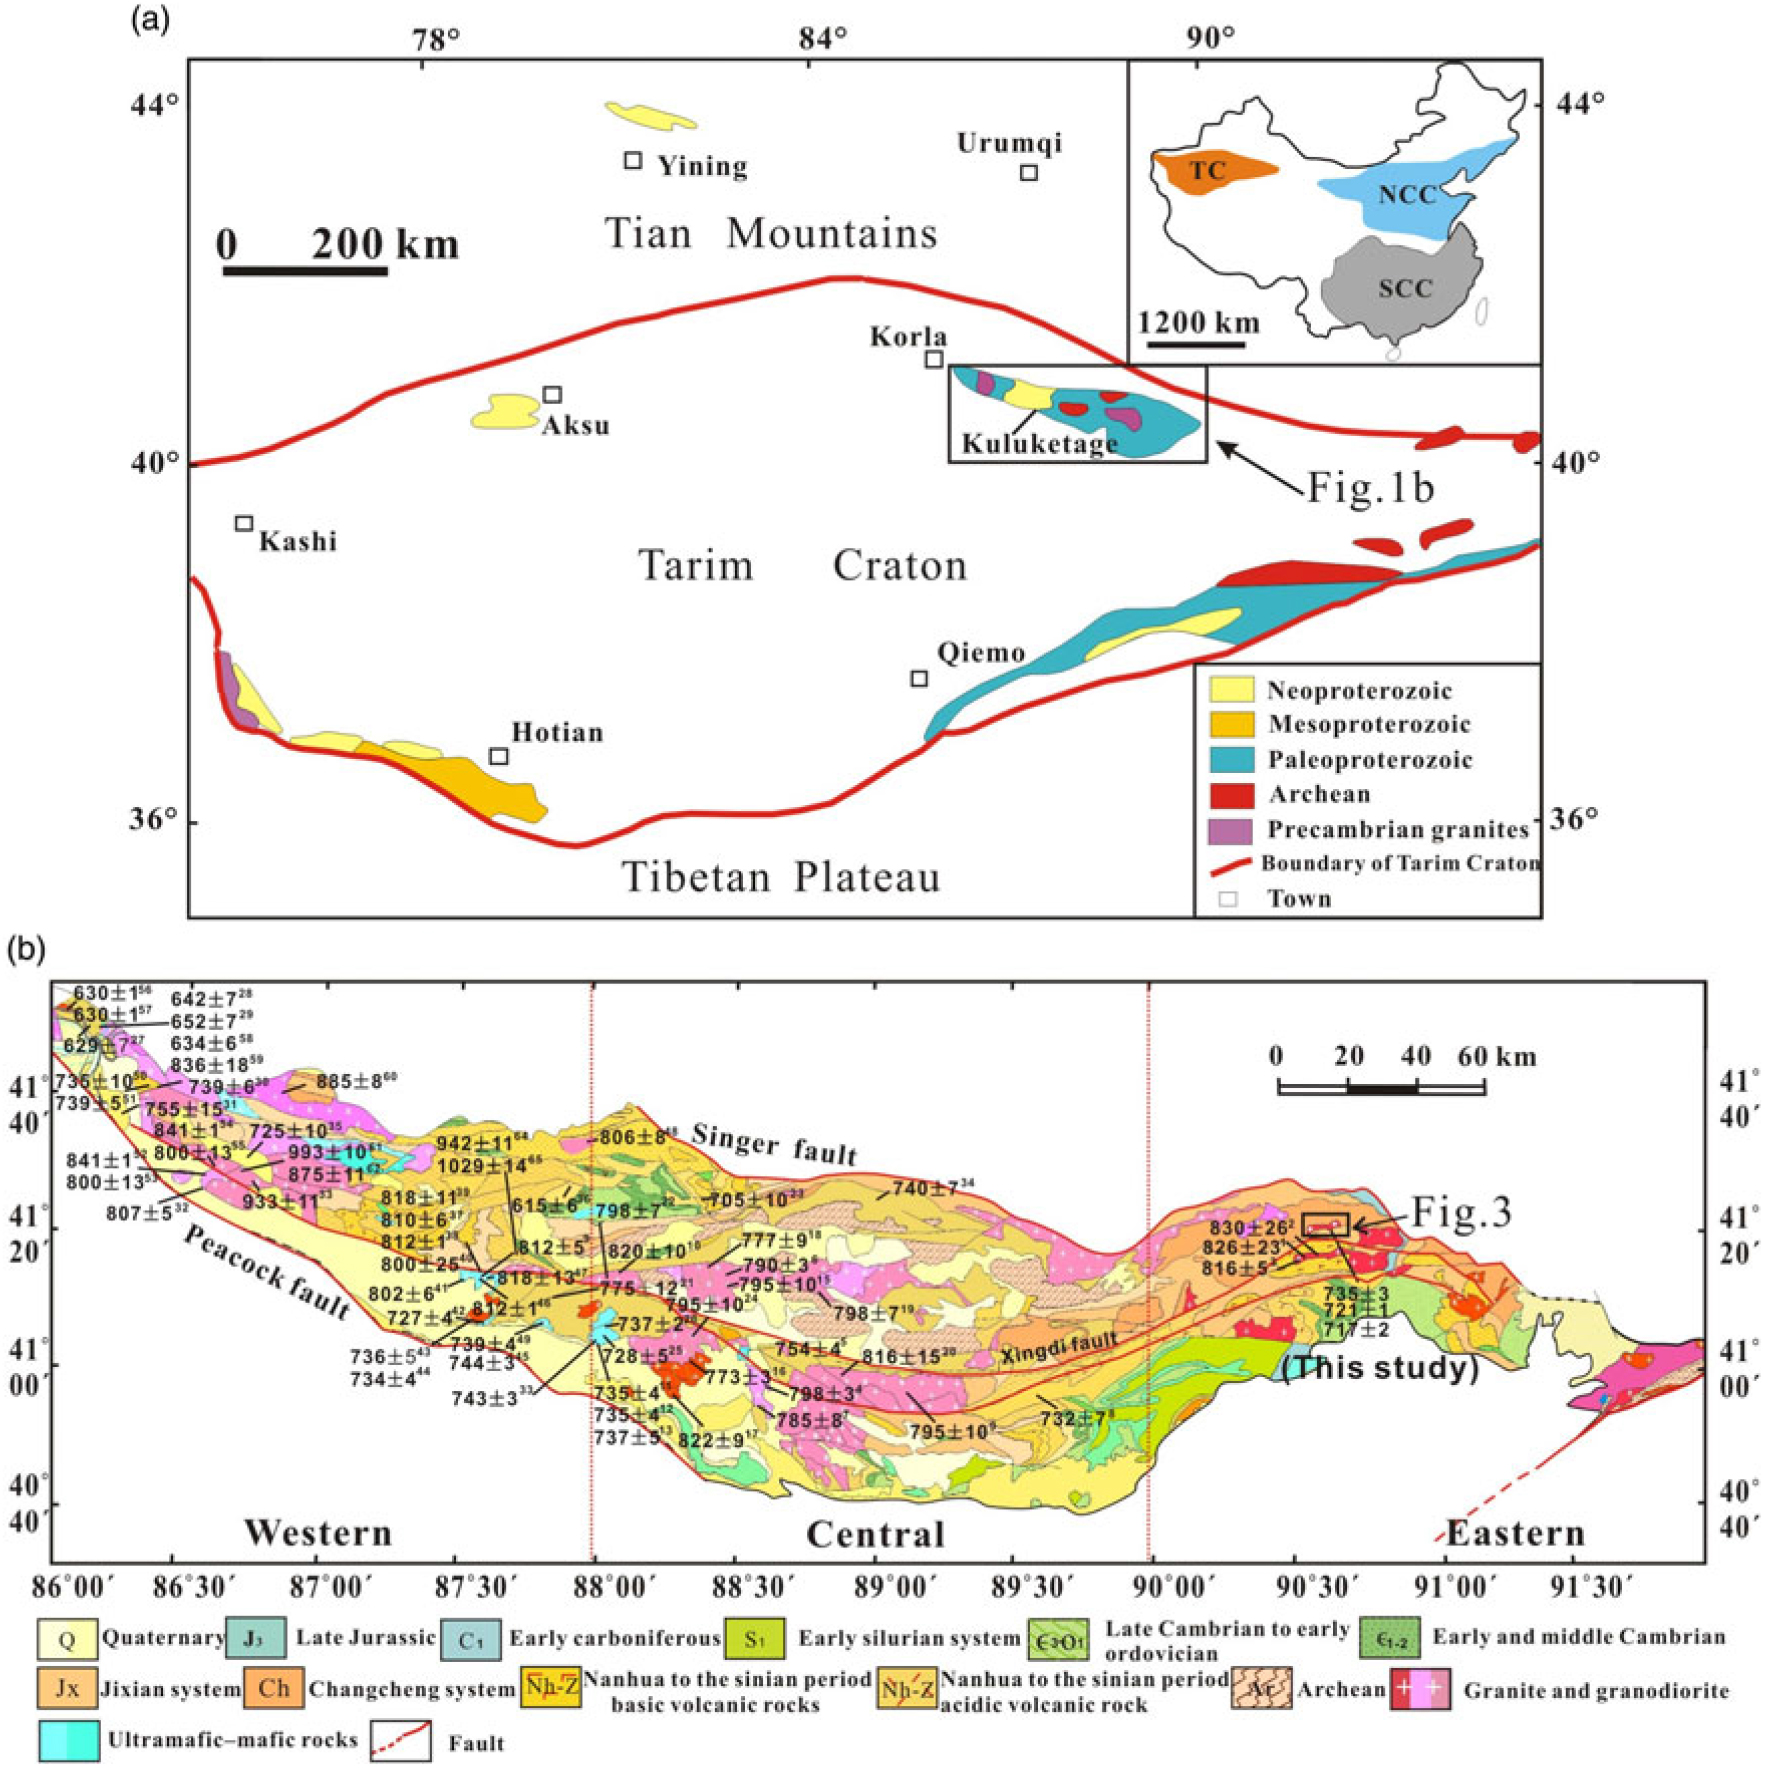
Fig. 1. (a) Tectonic framework of Tarim Craton and adjacent areas (after Wu et al. Reference Wu, Xiao, Bonin, Ma, Li and Zhu2018). NCC, North China Craton; SCC, South China Craton; TC, Tarim Craton; STMT, Southern Tianshan Mountains; NKMT, Northern Kunlun Mountains; EKMT, Eastern Kunlun Mountains; ALMT, Altun Mountains. (b) Regional geological map of the Kuluketage Block in NE Tarim (after Cao et al. Reference Cao, Lü and Gao2012), showing the distribution of the c. 1000–615 Ma geochronological data. Superscript indicates no. in Table 1. Digitals of ages and errors are omitted.
In the past ten years, the published literature has reported a great deal of research on the magmatic rocks exposed in the central and western region of the Kuluketage Block, while similar research in the eastern region has rarely been reported (Fig. 1b), in addition to some research on the Dapingliang Cu deposit (Cao et al. Reference Cao, Lü, Lei, Chen, Wang, Du, Mei, Gao and Du2010, Reference Cao, Lü, Liu, Zhang, Gao, Chen and Mo2011). Moreover, previous research highlighted an important debate about the tectonic setting of Late Neoproterozoic (c. 745–710 Ma) magmatic activities in the Kululetage Block: was it a continental rift setting related to mantle plume activities (Xu et al. Reference Xu, Kou, Song, Wei and Wang2008; Q Qin, unpub. Master’s thesis, Xinjiang Univ., 2012; Cao et al. Reference Cao, Lü, Yuan, Wang, Liu and Shen2014; B Lv, unpub. Master’s thesis, Xinjiang Univ., 2017) or was it an island-arc setting (Zhang et al. Reference Zhang, Yang, Wang, Takahashi and Ye2011; Tang et al. Reference Tang, Zhang, Li, Wang and Ripley2016; Chen et al. Reference Chen, Chen, Ripley, Li, Deng, Yue, Zheng and Fu2017)? In order to gain more insights into the Late Neoproterozoic (c. 745–710 Ma) geodynamic setting, we report new ages and experimental data for the Dapingliang magmatic rocks in the eastern Kuluketage Block.
2. Geological background
The Tarim Block is one of the three major continental blocks in China (the others being the North China and South China Blocks). The TC records the Precambrian evolutionary history of NW China (Lu et al. Reference Lu, Li, Zhang and Niu2008b; Zhao & Peter, Reference Zhao and Peter2012) and covers an area of 530 000 km2. This block preserves the Precambrian basement, which is composed of Archaean, Palaeoproterozoic, Mesoproterozoic and Early Neoproterozoic lithologies, and Middle Neoproterozoic to Phanerozoic sedimentary cover (Gao et al. Reference Gao, Chen, Lu, Peng and Qin1993; Cheng, Reference Cheng1994; Feng et al. Reference Feng, Zhou and Chi1995; Lu et al. Reference Lu, Zhao, Wang and Hao2008a, b) (Fig. 1b). The Kuluketage Block outcrops on the NE margin of the TC. Precambrian magmatic activities are pulsating, and a mass of magmatic rocks was distributed in the Kuluketage Block during this period (Cao et al. Reference Cao, Lü, Lei, Chen, Wang, Du, Mei, Gao and Du2010; Zhang et al. Reference Zhang, Li, Santosh, Li, Zou, Wang and Ye2012a; Ge et al. Reference Ge, Zhu, Wilde, Wu, He and Zheng2014a, b; Long et al. Reference Long, Yuan, Sun, Zhao, Xiao, Wang, Yang and Hu2010). Archaean rocks are well exposed to the north of the Kuluketage Block. The oldest rocks are known as the Tuoge Complex and are derived from TTG (tonalite–trondhjemite–granodiorite)-type granites, which yielded a zircon multigrain U–Pb thermal ionization mass spectrometry (TIMS) age of 2582 ± 11 Ma and a Pb–Pb zircon evaporation age of 2488 ± 10 Ma (Lu, Reference Lu1992). The latest SHRIMP (sensitive high-resolution ion microprobe) and laser ablation inductively coupled plasma mass spectrometry (LA-ICP-MS) geochronological studies show that the 2.65–2.53 Ga TTG rocks and K-rich granites are widely distributed (Hu & Wei, Reference Hu and Wei2006; Long et al. Reference Long, Yuan, Sun, Xiao, Zhao, Zhou, Wang and Hu2011a; Shu et al. Reference Shu, Deng, Zhu, Ma and Xiao2011; Zhang et al. Reference Zhang, Li, Santosh, Li, Zou, Wang and Ye2012a). The Palaeoproterozoic metamorphic rocks are mainly distributed in the western Kuluketage Block, and are known as the Xingditage Group, which consists of older metamorphic mafic, felsic intrusions and high-grade metamorphic supracrustal rocks. Mesoproterozoic to Early Neoproterozoic granitoids and diabasic dikes are widespread in this area (Feng et al. Reference Feng, Zhou and Chi1995; Lu et al. Reference Lu, Zhao, Wang and Hao2008a, b). Middle Neoproterozoic to Phanerozoic rocks consist of lower mafic dyke swarms, bimodal intrusions, bimodal volcanics and granitoids (CL Zhang et al. Reference Zhang, Li, Li, Lu, Ye and Li2007a, 2009; Xu et al. Reference Xu, Kou, Song, Wei and Wang2008, Reference Xu, Xiao, Zou, Chen, Li, Song, Liu, Zhou and Yuan2009; Zhu et al. Reference Zhu, Zhang, Shu, Lu, Sun and Yang2008; ZY Zhang et al. Reference Zhang, Li, Li and Ye2009; Long et al. Reference Long, Yuan, Sun, Kröner, Zhao, Wilde and Hu2011b; Cao et al. Reference Cao, Lü and Gao2012; Ge et al. Reference Ge, Zhu, Zheng, Wu, He and Zhu2012; Han et al. Reference Han, Xiao, Su, Sakyi, Ao, Zhang, Wan, Song and Wang2016; Chen et al. Reference Chen, Chen, Ripley, Li, Deng, Yue, Zheng and Fu2017). A diverse set of Neoproterozoic magmatic rocks has been documented in the Kuluketage Block, including: (1) c. 1000–860 Ma metamorphic rocks; (2) c. 810 Ma mafic–ultramafic–carbonatite complexes; (3) c. 810 Ma and 760–730 Ma bimodal intrusive complexes; (4) c. 830–735 Ma voluminous granitoids; (5) c. 810 Ma, 760–735 Ma and 650–630 Ma mafic dykes; and (6) c. 735 Ma volcanic rocks (Table 1) (Cao et al. Reference Cao, Lü, Liu, Zhang, Gao, Chen and Mo2011; Zhu et al. Reference Zhu, Zheng, Shu, Ma, Wan, Zheng, Zhang and Zhu2011; Zhang et al. Reference Zhang, Zou, Wang, Li and Ye2012b; Ge et al. Reference Ge, Zhu, Wilde, He, Cui, Wang and Zheng2014c; B Lv, unpub. Master’s thesis, Xinjiang Univ., 2017). Extensive geological research on the Kuluketage Block has identified multiphase and voluminous Neoproterozoic magmatic rocks (Xinjiang Bureau of Geology and Mineral Resources, 1993; Yang et al. Reference Yang, Luo, Zhu and Zhang1997; Li et al. Reference Li, Xie, Chang, Cai, Zhu and Zhou1998; CL Zhang et al. Reference Zhang, Lu, Yu and Ye2007c; Cao et al. Reference Cao, Lü, Lei, Chen, Wang, Du, Mei, Gao and Du2010) (Fig. 1b), including c. 1000–860 Ma metamorphic rocks and high-K granitic rocks (Hu et al. Reference Hu, Wang and Tu1997; Shu et al. Reference Shu, Deng, Zhu, Ma and Xiao2011; Ge et al. Reference Ge, Zhu, Zheng, Wu, He and Zhu2012; B Lv, unpub. Master’s thesis, Xinjiang Univ., 2017); c. 830–760 Ma ultramafic–mafic–carbonatite complexes, voluminous adakitic granites and mafic dyke swarms (CL Zhang et al. Reference Zhang, Li, Li, Lu, Ye and Li2007a, b, Reference Zhang, Yang, Wang, Takahashi and Ye2011, Reference Zhang, Zou, Wang, Li and Ye2012b; Deng et al. Reference Deng, Shu, Zhu, Ma and Wang2008; Zhu et al. Reference Zhu, Zhang, Shu, Lu, Sun and Yang2008; Cao et al. Reference Cao, Lü, Liu, Zhang, Gao, Chen and Mo2011; Long et al. Reference Long, Yuan, Sun, Kröner, Zhao, Wilde and Hu2011b; Luo et al. Reference Luo, Che, Zhang, Han, Zhang and Nian2011; Shu et al. Reference Shu, Deng, Zhu, Ma and Xiao2011; Ye et al. Reference Ye, Li and Lan2013; Han et al. Reference Han, Xiao, Su, Sakyi, Ao, Zhang, Wan, Song and Wang2016; Chen et al. Reference Chen, Lü, Cao, Yuan and Wang2019); c. 745–710 Ma mantle-derived mafic dykes, tholeiitic ultramafic–mafic bimodal intrusions, basalt, alkaline granites and bimodal volcanic rocks (Xu et al. Reference Xu, Kou, Song, Wei and Wang2008, 2009; Zhang et al. 2011; Tang et al. Reference Tang, Zhang, Li, Wang and Ripley2016; Chen et al. Reference Chen, Chen, Ripley, Li, Deng, Yue, Zheng and Fu2017); and c. 650–630 Ma mafic dykes and volcanic rocks (Huang et al. Reference Huang, Xu, Zhang, Li and Zhu2005; Zhu et al. Reference Zhu, Zhang, Shu, Lu, Sun and Yang2008, Reference Zhu, Zheng, Shu, Ma, Wan, Zheng, Zhang and Zhu2011; Zhang et al. Reference Zhang, Ye and Li2014) (Table 1; Fig. 2).

Fig. 2. The age distribution of the Kuluketage Neoproterozoic magmatic rocks.
Table 1. Compilation of the latest Mesoproterozoic to Neoproterozoic geochronological data from the Kuluketage Block

a KU = Kuluketage Block; b B.F. = Beiyixi Formation; Z.F. = Zamoketi Formation; T.F. = Teriaiken Formation.
3. Geology of the study area
The Dapingliang area (41° 21′ 30′′–41° 23′ 30′′ N, 90° 36′ 00′′–90° 41′ 00′′ E) is located in Shanshan County and belongs to the Bayinguolengmenggu Autonomous Region, covering an area of 20 km2. Liu et al. (Reference Liu, Lü and Cao2015) and Chen et al. (Reference Chen, Zhu, Cao and Lü2016) carried out geological works related to mineral resource prospecting and exploration. The exposed formations were mainly found in the Mesoproterozoic Yangjibulake and Nanxingeertage. Magmatic rocks comprised albitophyre, granite porphyry, diorite porphyrite and quartz granite-porphyry, and were all intruded into the Yangjibulake Formation. The zircon U–Pb geochronological and geochemical samples (D1, D2 and D3) were taken from the albitophyre, granite porphyry and diorite porphyrite (Fig. 3).

Fig. 3. Simplified geological map of the Dapingliang area (after Liu et al. Reference Liu, Lü and Cao2015; Chen et al. Reference Chen, Zhu, Cao and Lü2016), showing the sample locations and the geochronological data.
The albitophyre outcrop is in the middle of the study area. Albitophyre is faint pink-white to rosy in colour (Fig. 4a) and exhibits typical porphyritic texture. The main phenocrysts are Na-feldspar, quartz and plagioclase (Fig. 4a2). It is mainly composed of Na-feldspar, quartz, and minor K-feldspar. The accessory minerals are biotite, zircon, apatite, pyrite and magnetite. The granite porphyry outcrops are in the east and SE corner. The granite porphyry is yellow to rosy in colour and also exhibits typical porphyritic texture (Fig. 4b). The main phenocrysts are Na-feldspar, quartz and plagioclase (Fig. 4b3). It is mainly composed of plagioclase, quartz, minor Na-feldspar and a little biotite. The accessory minerals are zircon, pyrite, epidote and apatite. The diorite porphyrite outcrops are in the NW corner and the south. The diorite porphyrite is grey to celadon in colour and exhibits typical porphyritic texture (Fig. 4c). The main phenocrysts are plagioclase and a small amount of quartz, hornblendite and pyroxene (Fig. 4c1). It is mainly composed of plagioclase, quartz, minor K-feldspar and muscovite (Fig. 4c2, c3).

Fig. 4. Hand specimen and photomicrographs of the albitophyre (a–a3), granite porphyry (b–b3) and diorite porphyrite (c–c3). Pl, Plagioclase; Kf, K-feldspar; Q, quartz; Ms, muscovite; Ab, albite; Bi, biotite; Px, pyroxene; Hbl, hornblende.
4. Analysis method
4.a. In situ zircon U–Pb isotope analysis
Rock samples for analysis were carefully selected on the basis of geographical distribution, trying to represent the different rock types. Zircon grains were separated from the samples by conventional magnetic and density techniques at the laboratory of the Langfang Regional Geological Survey Institute in Hebei Province, China. The prepared zircon grains were then hand-picked, embedded in epoxy resin, and polished to expose the grain centres. Zircons that were free of visible inclusions and fractures were selected for cathodoluminescence (CL) imaging in the electron microprobe laboratory at the State Key Laboratory of Geological Processes and Mineral Resources (GPMR), China University of Geosciences (CUG), Wuhan.
Measurements of U, Th and Pb isotopes in the zircons were performed synchronously by using a LA-ICP-MS at GPMR. Laser sampling was conducted using GeoLas 2005 with a beam diameter of 32 μm, and an Agilent 7500a ICP-MS instrument was used to acquire ion-signal intensities. Helium was used as a carrier gas, while argon was used as a make-up gas. The two gases were mixed before entering the ICP. We analysed the standards 91500 and GJ-1 for U–Pb dating. Each analysis incorporated a background acquisition of 20 s followed by 60 s of data acquisition from the sample. The detailed work conditions for the laser ablation system and the ICP-MS instrument were described by Liu et al. (Reference Liu, Gao, Hu, Gao, Zong and Wang2010). Software ICPMSDataCal was used for the off-line selection and integration of background and analytical signals, and time-drift correction and quantitative calibration were applied for the trace element analyses and U–Pb dating (Liu et al. Reference Liu, Gao, Hu, Gao, Zong and Wang2010). Concordia diagrams and weighted mean calculations were conducted using Isoplot Version 3.75 (Ludwig, Reference Ludwig2012).
4.b. In situ zircon Hf isotope analysis
In situ Lu–Hf isotope analyses were conducted in dated zircon grains with identical sampling spots to the U–Pb analyses or within the same oscillatory zones. A Neptune Plus MC-ICP-MS (Thermo Fisher Scientific, Germany) equipped with a GeoLas 2005 excimer ArF laser-ablation system (Lambda Physik, Göttingen, Germany) was used at GPMR. The sampling-spot size was 44 um, and the energy density was 15–20 J cm−2 during the analyses. The standards 91500 and GJ-1 were simultaneously analysed (Hu et al. Reference Hu, Liu, Gao, Liu, Zhang, Tong, Lin, Zong, Li, Chen, Zhou and Yang2012). The obtained Hf isotope compositions were 0.282315 ± 0.000014 (1σ) for 91500, and 0.282019 ± 0.000013 (1σ) for GJ-1. The off-line selection and integration of analytical signals and mass-bias calibrations were conducted using ICPMSDataCal (Liu et al. Reference Liu, Hu, Gao, Gao, Günther, Xu, Gao and Chen2008).
4.c. Major and trace element analysis
Samples chosen for whole-rock geochemical analysis were trimmed to remove the weathered surfaces, before being crushed and powdered to 200 mesh. Major elements were analysed in a PAN analytical Axios X-ray fluorescence spectrometer (XRF) at ALS Chemex (Guangzhou) Co. Ltd. Prior to analysis, a calcined or ignited sample (0.9 g) is added to 9.0 g of Lithium Borate Flux (50 %–50 % Li2B4O7–LiBO2), mixed well and fused in an auto fluxer at between 1050 and 1100 °C. A flat molten glass disc is prepared from the resulting melt; this disc is then analysed via X-ray fluorescence spectrometry. The precision of the XRF analyses at ALS Chemex is better than 5 %.
Trace element concentrations were determined in an Elan 9000 at the same lab. A prepared sample (0.2 g) is added to lithium metaborate flux (0.9 g), mixed well and fused in a furnace at 1000 °C. The resulting melt is then cooled and dissolved in 100 mL of 4 % HNO3 / 2 % HCl3 solution. This solution is then analysed via ICP-MS. The precision of the ICP-MS analyses at ALS Chemex is better than 10 % for all elements. Data for whole-rock chemistry are reported as weight per cent (wt %), while trace-element and rare earth element values are reported in parts per million (ppm).
4.d. Sr–Nd–Pb isotope analysis
Sr and Nd isotopic analyses were performed on a Micromass Isoprobe multi-collector ICPMS at the State Key Laboratory of Isotope Geochemistry (SKLIG), Guangzhou Institute of Geochemistry (GIG), Chinese Academy of Sciences (CAS), using analytical procedures described by Li et al. (Reference Li, Li, Wingate, Chung, Liu, Lin and Li2006). Sr was separated using cation columns, and Nd fractions were further separated by HDEHP-coated Kef columns. Measured 87Sr/86Sr and 143Nd/144Nd ratios were normalized to 86Sr/88Sr = 0.1194 and 146Nd/144Nd = 0.7219, respectively. The reported 87Sr/86Sr and 143Nd/144Nd ratios were adjusted to the NBS987 standard 87Sr/86Sr = 0.710262 ± 10 (2σ) and the Shin Etsu JNdi-1 standard 143Nd/144Nd = 0.512101 ± 4 (2σ).
For Pb isotopic determinations, c. 100 mg powder was weighed into a Teflon beaker, spiked and dissolved in concentrated HF at 180 °C for 7 h. Lead was separated and purified by conventional cation-exchange technique (AG1 × 8, 20–400 resin) with diluted HBr as an eluant. Total procedural blanks were less than 50 pg Pb. Isotopic ratios were measured by a VG-354 mass spectrometer at the SKLIG-GIGCAS. Repeated analyses of SRM 981 yielded average values of 206Pb/204Pb = 16.9320 ± 5 (2σ), 207Pb/204Pb = 15.4853 ± 5 (2σ) and 208Pb/204Pb = 36.6804 ± 10 (2σ). External precisions are estimated to be less than 0.005 and 0.0015. The analytical procedure is similar to that described by Zhu et al. (Reference Zhu, Zhang, Tu, Chang, Fan, Liu and Liu2001).
5. Results
5.a. Zircon U–Pb age
The zircon U–Pb dating data are listed in Table 2, and representative CL images of the zircon are shown in Figure 5. Zircon grains from D1 can be divided into two groups under CL imaging. Group A are euhedral, colourless and transparent, with a length of 60–220 μm and length-to-width ratios of 1:1 – 2:1 (Fig. 5a1). They are bright in the CL images, with clear oscillatory zoning, indicating their magmatic origin (Andersson et al. Reference Andersson, Miller and Johansson2002; Wu & Zheng, Reference Wu and Zheng2004). The analyses of 17 grains with clear oscillatory zoning yielded a group of 206Pb/238U ages, ranging from 724 to 746 Ma. This group of ages yielded a weighted mean 206Pb/238U age of 735 ± 3 Ma (mean square weighted deviation (MSWD) = 0.40, N = 17; Fig. 5a). The measured U, Th and Th/U values for these zircon grains range from 852 to 1938 ppm, 659 to 1876 ppm, and 0.67 to 1.05, respectively. The weighted mean 206Pb/238U age of 735 ± 3 Ma is interpreted as being the crystallization age of the albitophyre. Group B has one zircon grain, characterized by clear oscillatory zoning and surrounded by a dark rim in the CL images (Fig. 5a1). Two analysis spots (D1-17, 2262 ± 18 Ma; D1-18, 2410 ± 18 Ma) obtained from the same zircon are both significantly older than the main age group. The two spots are spread around the discordant line (Fig. 5d). This zircon is believed to have been captured from the source region or wall rocks.

Fig. 5. Zircon U–Pb concordia diagrams (a, b, c) and the CL images of zircon grains (a1–c1). a1–c1: red circles indicate the U–Pb isotopic analysis spots, and 206Pb/238U ages are presented between the circles, while green circles indicate the Lu–Hf isotopic analysis spots and the ε Hf(t) values are also presented between the circles.
Table 2. LA-ICP-MS U–Pb isotopic compositions of zircon grains for the D1, D2 and D3

Zircon grains from D2 are prismatic, colourless and transparent, with lengths of 60–120 μm and length-to-width ratios of 1:1 – 1.3:1 (Fig. 5b1). Zircons are bright in the CL images, with clear oscillatory zoning, indicating their magmatic origin. Eighteen analyses on 16 grains with clear oscillatory zoning yielded a group of 206Pb/238U ages, ranging from 711 to 720 Ma. This group of ages yielded a weighted mean 206Pb/238U age of 717 ± 2 Ma (MSWD = 0.21, N = 18; Fig. 5b). The measured U, Th and Th/U values for these zircon grains range from 602 to 1549 ppm, 417 to 1389 ppm and 0.58 to 0.94, respectively. This weighted mean 206Pb/238U age of 717 ± 2 Ma was interpreted as the crystallization age of the granite porphyry.
Zircon grains from D3 are euhedral, colourless and transparent, with lengths of 100–200 μm and length-to-width ratios of 1:1 – 2:1 (Fig. 5c1). Zircons are bright in the CL images, with clear oscillatory zoning, indicating their magmatic origin. Eighteen analyses on 18 grains with clear oscillatory zoning yielded a group of 206Pb/238U ages, ranging from 716 to 728 Ma. This group of ages yielded a weighted mean 206Pb/238U age of 721 ± 1 Ma (MSWD = 0.36, N = 18; Fig. 5c). The measured U, Th and Th/U values for these zircon grains range from 175 to 823 ppm, 78 to 387 ppm and 0.32 to 0.92, respectively. This weighted mean 206Pb/238U age of 721 ± 1 Ma was interpreted as the crystallization age of the diorite porphyrite.
5.b. Zircon Hf isotopes
The Hf isotopic data are listed in Table 3 and are illustrated in Figure 6. D1 has variable 176Hf/177Hf ratios from 0.282007 to 0.282114, with ε Hf(t) values ranging from −7.22 to −11.41 and the T DM2 (two-stage zircon Hf model ages) ranging from 1927 to 2156 Ma (mostly 2.0–2.1 Ga). 176Hf/177Hf ratios of the two analytic points (D1-17 and D1-18) on the same zircon vary narrowly from 0.281366 to 0.281382, with ε Hf(t) values ranging from + 1.09 to + 1.74 and T DM2 ranging from 2758 to 2753 Ma. D2 has highly variable 176Hf/177Hf ratios from 0.282216 to 0.282436, with ε Hf(t) values ranging from -4.35 to + 1.50 and T DM2 ranging from 1433 to 1755 Ma (mostly 1.6–1.7 Ga). D3 has variable 176Hf/177Hf ratios from 0.281880 to 0.282045, with ε Hf(t) values ranging from -10.65 to −16.43 and T DM2 ranging from 2103 to 2310 Ma (mostly 2.1–2.3 Ga).

Fig. 6. (a, b) Initial Hf composition and ε Hf(t) vs crystal age plots for dated zircon samples (after Long et al. Reference Long, Yuan, Sun, Kröner, Zhao, Wilde and Hu2011b). (c) Histogram of the T DM2.
Table 3. LA-ICP-MS Lu–Hf isotopic compositions of zircon grains for the D1, D2 and D3
5.c. Geochemistry
5.c.1. Major and trace elements
The analytical results for the major and trace elements are presented in Table 4 and are illustrated in Figures 7–11.

Fig. 7. Geochemical classification diagrams. (a) TAS diagram, after Cox et al. (Reference Cox, Bell and Pankhurst1979); (b) A/CNK – A/NK diagram, after Shand (Reference Shand1943); (c) SiO2–K2O diagram, after Peccerillo & Taylor (Reference Peccerillo and Taylor1976); (d) K2O–Na2O diagram, after Peccerillo & Taylor (Reference Peccerillo and Taylor1976).

Fig. 8. Chrondrite-normalized REE patterns (a, c, e) and primitive mantle-normalized incompatible elements spider diagrams (b, d, f). The normalizing values are from Sun & McDonough (Reference Sun and McDonough1989).

Fig. 9. (a) La / Sm–La discrimination diagram. (b) La / Yb–La discrimination diagram. (c) Ce / Yb–Ce discrimination diagram. Base plot is taken from Treuil & Joron (Reference Treuil and Joron1975).

Fig. 10. Geochemical discrimination diagrams. (a) (Na2O + K2O)/CaO–(Zr + Nb + Ce + Y) and (d) FeO/MgO–(Zr + Nb + Ce + Y) discrimination diagrams after Pimentel et al. (Reference Pimentel, Fuck and Botelho1999). (b) (Na2O − K2O)/CaO – 10000 * Ga/Al, (c) FeO/MgO – 1000 * Ga/Al, (e) Ce – 1000 * Ga/Al and (f) Zr – 1000 * Ga/Al discrimination diagrams after Whalen et al. (Reference Whalen, Currie and Chappell1987). (g) Nb – Y – Ce, (h) Nb – Y– 3Ga and (I) Rb/Nb – Y/Nb discrimination diagrams after Eby (Reference Eby1992).
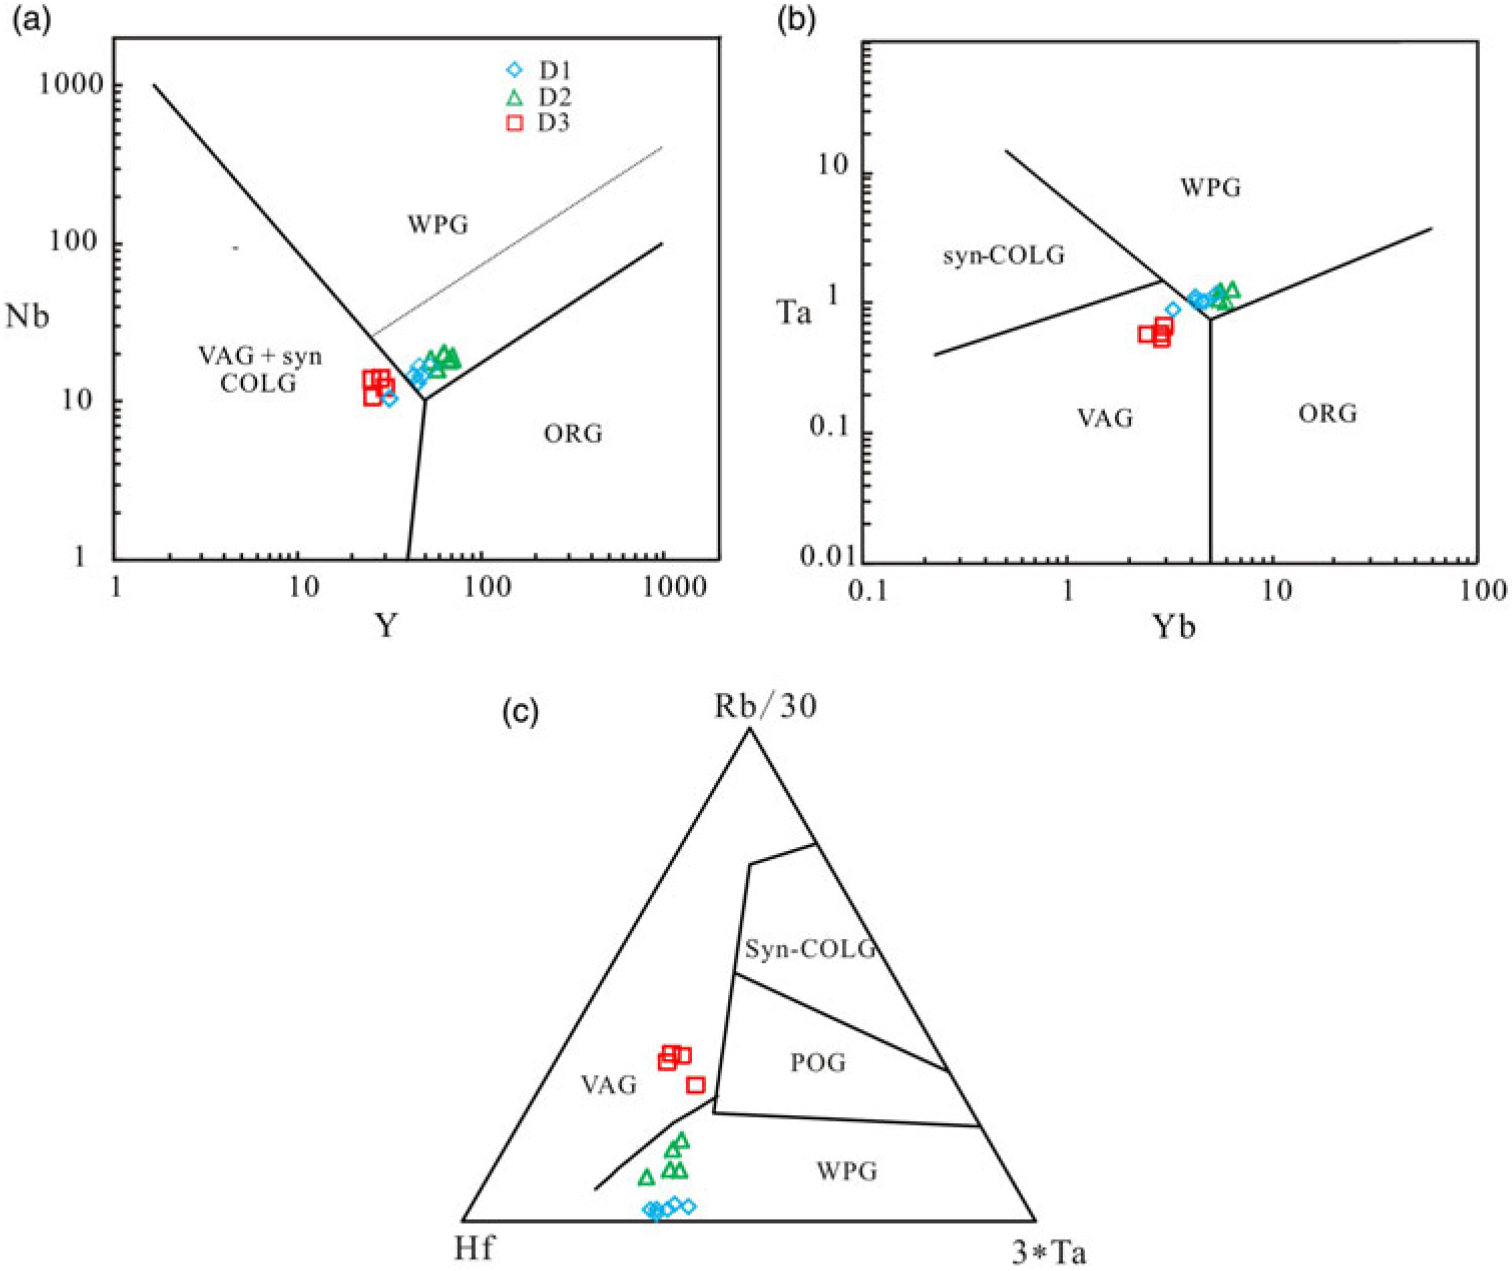
Fig. 11. Tectonic discrimination diagrams. (a) Nb–Y and (b) Ta–Yb discrimination diagrams after Pearce et al. (Reference Pearce, Harris and Tindle1984). (c) Rb/30 – Hf – 3*Ta discrimination diagram after Harris et al. (Reference Harris, Pearce and Tindle1986). VAG, volcanic arc granite; ORG, ocean ridge granite; WPG, within-plate granite; syn-COLG, syn-collision granite; POG, post-collision granite.
Table 4. Major elements (wt %), trace elements (ppm) and rare earth elements (ppm) of the Dapingliang pluton
For D1, Table 4 reveals the following element distribution: SiO2 = 81.37–82.85 wt %, Al2O3 = 9.64–10.89 wt %, Fe2O3 = 0.21–1.22 wt %, CaO = 0.08–0.21 wt %, MgO = 0.02–0.03 wt %, Na2O = 5.51–6.30 wt %, K2O = 0.09–0.19 wt %. All major elements fall within a narrow variation range and have no apparent correlation. Mg# varies from 3.2 to 16.0. On the total-alkali silica (TAS) diagram, all data plot in the granite area (Fig. 7a). Wright (Reference Wright1969) introduced the AR series classification for rocks whose SiO2 content exceeds 70 %. Calculation revealed AR values ranging from 3.68 to 3.88, indicating that D1 is an alkaline rock. Sample A/CNK values range from 1.00 to 1.05, and A/NK values range from 1.03 to 1.07. All samples plot in the weakly peraluminous area on the A/CNK vs A/NK diagram (Fig. 7b). The low K2O and K2O/Na2O ratios indicate that D1 also belongs to a low-K calc-alkaline or tholeiite granite (Peccerillo & Taylor, Reference Peccerillo and Taylor1976) (Fig. 7c, d). Samples are generally enriched in LREE relative to HREE. Sample (La/Yb)N ratios vary from 8.94 to 12.69, and the ∑LREE/∑HREE ratios vary from 8.00 to 10.34. The (La/Yb)N (La/Sm)N ratios vs La, and (Ce/Yb)N ratios vs Ce diagrams show a good linear relation (Fig. 9). The recorded REE distribution patterns show a strongly negative Eu anomaly (δEu = 0.05–0.07) and have nearly flat heavy rare earth patterns ((Dy/Yb)N = 1.70–1.79). The primitive mantle-normalized spider diagrams show that D1 is enriched in large iron lithophile elements (LILE) such as Th and U and is depleted in Rb, Ba and K. The high field strength element (HFSE) P and Ti are depleted, whereas Zr, Hf, Nb and Ta elements are enriched. The rare earth and trace element contents are similar to those of the upper continental crust, with the exception of relatively higher Zr and Hf levels and lower Nb, Ta, Sr, P and Ti levels (Rudnick & Gao, Reference Rudnick and Gao2003).
For D2, all samples reveal the following element distribution: SiO2 = 78.38–79.90 wt %, Al2O3 = 11.78–12.42 wt %, Fe2O3 = 0.91–1.18 wt %, CaO = 0.16–0.78 wt %, MgO = 0.03–0.13 wt %, Na2O = 4.66–5.82 wt %, K2O = 0.87–1.92 wt %. Mg# varies from 5.7 to 20.9. Calculation revealed AR values ranging from 2.97 to 3.30, indicating that D2 is an alkaline rock. Almost all samples plot in the peraluminous area (Fig. 7b). One sample plots in the weakly peraluminous area for its greater CaO content, which may be caused by a small injection of calcite as its loss-on-ignition (LOI) value is a little higher. Therefore, D2 can be considered to be peraluminous. The low K2O and K2O/Na2O ratios indicate that D2 also belongs to a low-K calc-alkaline or tholeiite granite (Fig. 7c, d). D2 samples show similar REE distribution patterns to D1 (Fig. 8c). Sample (La/Yb)N ratios vary from 4.64 to 10.17, and the ∑LREE/∑HREE ratios vary from 5.74 to 8.67. The (La/Yb)N (La/Sm)N ratios vs La, and (Ce/Yb)N ratios vs Ce diagrams show good linear relation (Fig. 9). The recorded REE distribution patterns show a strongly negative Eu anomaly (δEu = 0.01–0.05) and nearly flat HREE patterns, similar to A-type granites. The primitive mantle-normalized spider diagrams show that D2 is enriched in LILE, such as Th, U and Rb, and are depleted in Ba and K elements (Fig. 8d). The HFSE Nb, Ta, P and Ti are depleted whereas Zr and Hf are enriched. Apart from the high Rb contents, D2 shows similar primitive mantle-normalized spider diagrams to D1.
Compared to D1 and D2, D3 exhibits intermediate compositions. Analysis of Table 4 reveals the following element distribution: SiO2 = 62.10–63.86 wt %, Al2O3 = 14.89–15.59 wt %, Fe2O3 = 7.13–7.41 wt %, CaO = 1.68–1.99 wt %, MgO = 2.14–3.09 wt %, Na2O = 1.96–2.90 wt %, K2O = 2.29–3.95 wt %. Mg# varies from 36.9 to 46.4. All samples plot into the diorite/granodiorite area (Fig. 7a). Rittman index (δ) values range from 1.81 to 2.32, indicating a calc-alkaline / tholeiite series. All samples plot in the peralkaline area, indicating that D3 is strongly peraluminous (Fig. 7b). The high K2O and K2O/Na2O ratios indicate that D3 also belongs to a high-K calc-alkaline or shoshonitic granodiorite series (Fig. 7c, d). Samples are generally enriched in LREE, relative to HREE. Sample (La/Yb)N ratios vary from 8.74 to 10.18, and the ∑LREE/∑HREE ratios vary from 7.86 to 8.78. The recorded REE distribution patterns show a slightly negative Eu anomaly (δEu = 0.84–0.94). The primitive mantle-normalized spider diagrams show that D3 is enriched in LILE (e.g. Ba, K and Rb) and are depleted in Nb, Ta, Ti, P and Sr elements (Fig. 8e, f).
5.c.2. Sr–Nd–Pb isotopic composition
Sr–Nd isotopic compositions are presented in Table 5 and are illustrated in Figure 12. D1 has homogeneous Nd and Sr isotope compositions. The ε Nd(t) values range from −11.45 to −11.98, and the (87Sr/86Sr)i values range from 0.7088 to 0.7093. D2 has relatively homogeneous Nd isotope compositions, and its Sr isotope compositions have a large range. The ε Nd(t) values range from −8.79 to −12.86, and the (87Sr/86Sr)i values range from 0.7048 to 0.7092. D3 has heterogeneous Sr–Nd isotope compositions. The ε Nd(t) values range from −5.09 to −13.49, and the (87Sr/86Sr)i values range from 0.7047 to 0.7078.
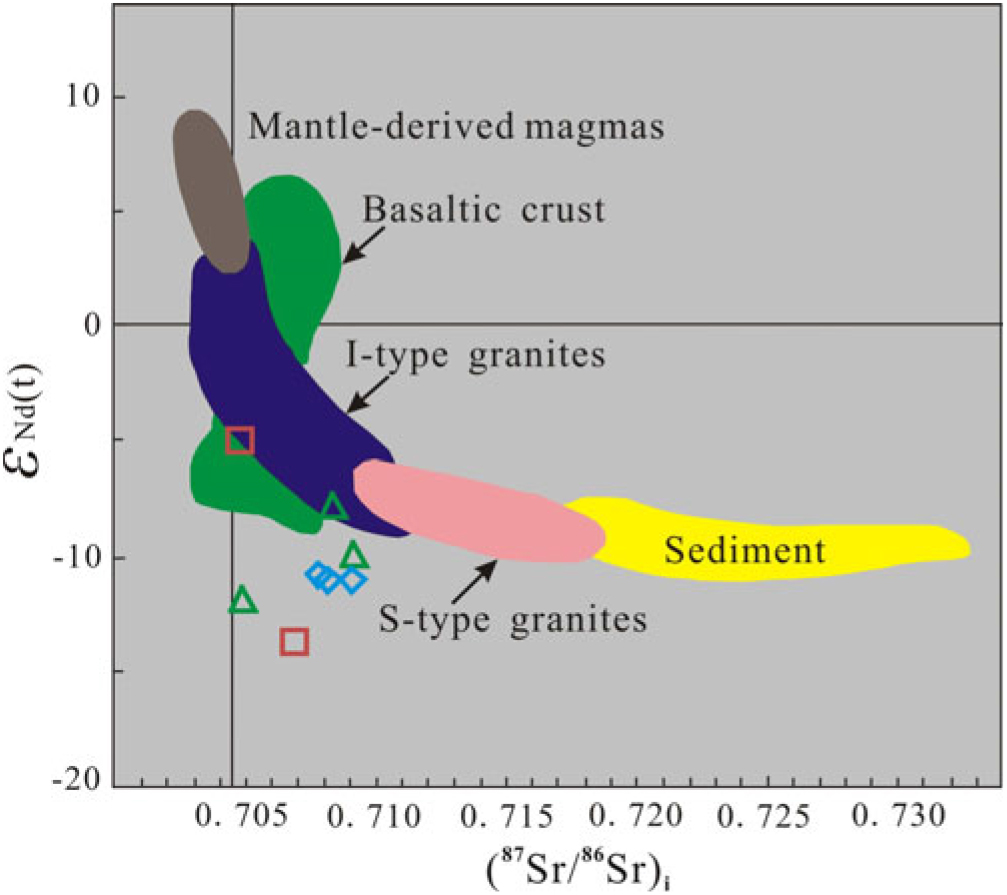
Fig. 12. Plot of ε Nd(t) vs initial Sr isotope ratio for Dapingliang suite rocks. Base plot is after Keay et al. (Reference Keay, Collins and McCulloch1997). Symbols as in Figure 11.
Table 5. Sr and Nd isotopic data for D1, D2 and D3

Pb isotopic compositions are presented in Table 6 and are illustrated in Figure 13. The Pb isotopic compositions are distinctive and relatively homogeneous, with 206Pb/204Pb ranging from 17.461 to 18.912, 207Pb/204Pb ranging from 15.438 to 15.522, and 208Pb/204Pb ranging from 37.651 to 38.878, respectively. On the conventional Pb isotope diagram, the initial 208Pb/204Pb and 207Pb/204Pb of the samples are well above the Northern Hemisphere Reference Line (NHRL; Hart, Reference Hart1984) (Fig. 13a). On the 207Pb/204Pb vs 206Pb/204Pb diagram, the D1 and D3 samples plot in or near the lower crust area. The D2 samples not only plot near the lower crust, but also plot in the mid-ocean ridge basalt (MORB) (Fig. 13b).

Fig. 13. Isotopic correlation diagram for (a) 208Pb/204Pb vs 206Pb/204Pb and (b) 207Pb/204Pb vs 206Pb/204Pb of the Dapingliang suite rocks. Base plot is after White (Reference White2005). Symbols as in Figure 11.
Table 6. Pb isotopic data and initial ratios for D1, D2 and D3

6. Discussion
6.a. Genetic types of rocks
Granites are generally divided into A, I, S and M-types, evidencing different geochemistry and origins (Whalen et al. Reference Whalen, Currie and Chappell1987; Chappell, Reference Chappell1999; Bonin, Reference Bonin2007). According to the analysis of their geochemical features, D1 is different from D2 and D3 in that it belongs to an alkaline weakly peraluminous series. Its weakly peraluminous features and the absence of Al-saturated minerals (such as garnet, cordierite, muscovite or an Al2SiO5 polymorph) preclude the possibility that D1 is an S-type granite (Chappell & White, Reference Chappell and White1974). D1 displays the characteristics of an A-type granite with high SiO2 (Na2O + K2O) and HFSE contents, high FeOT/MgO ratios and low Al2O3 and CaO contents. All D1 samples plot in the A-type granite area (Fig. 10a, b, c, d, e, f), indicating that D1 belongs to an A-type granite. Indeed, Pitcher (Reference Pitcher1993) has pointed out that A-type granite can be both metaluminous and peraluminous. D1 is further classified into the A2 type on the Nb–Y–3Ga and Nb–Y–Ce diagrams (Eby, Reference Eby1992) (Fig. 10g, h).
D2 is different from D1 in that it belongs to a weakly-peraluminous – peraluminous series, which is similar to S-type granitic features (Chappell & White, Reference Chappell and White1974). However, it belongs to an alkaline series and has high SiO2, Zr, Ce and Y contents, high FeOT/MgO and (Na2O + K2O)/CaO ratios and low P2O5 contents, with an absence of aluminium-rich muscovite, garnet and cordierite. These features are similar to A-type granite and are different from S-type and I-type granites (Chappell & White, Reference Chappell and White1974; Collins et al. Reference Collins, Beams, White and Chappell1982; Whalen et al. Reference Whalen, Currie and Chappell1987; Wang et al. Reference Wang, Zhao, Lu and Chen2000). Apart from that, the calculated zircon saturation temperatures of D2 were c. 838 °C according to Hanchar & Watson (Reference Hanchar and Watson2003) (Table 4), similar to those given by the A-type granite zircons (i.e. 826 °C) (Liu et al. Reference Liu, Chen, Chen, Wang and Hu2003). D2 is similar to D1, and its samples plot in the A-type granite area (Fig. 10a, b, c, d, e, f), so D2 is also an A-type granite. D2 is also further classified into the A2 type (Fig. 9g, h, I).
D3 belongs to the high-K calc-alkaline and strongly peraluminous series. It has relatively low total alkali, Zr and SiO2 contents, and low FeOT/MgO (Na2O + K2O)/CaO, Ga/Al and Nb/Y ratios, which are significantly different from those of A-type granites (Collins et al. Reference Collins, Beams, White and Chappell1982; Whalen et al. Reference Whalen, Currie and Chappell1987). Its strong peraluminous characteristics and the appearance of muscovite under the microscope seem to imply that D3 belongs to an S-type granite. However, whilst its peraluminous character, high amount of REE and negative anomalies for Nb, Ta and Ti are similar to the I–S transition type granite formed in active continental margins (Qin, unpub. Master’s thesis, Xinjiang Univ., 2012), its rock-forming minerals clearly rule out the possibility of its being an S-type granite (e.g. the presence of hornblende and pyroxene). High Zr and Hf contents indicate that the zircons reached saturation in the process of magma crystallization. The calculated zircon saturation temperatures for D3 were c. 833 °C, which is different to those given by the S-type granite zircons ( < 750 °C). D3 has a relatively high CaO and MgO content and low Ce, Zr, TiO2, Fe2O3 (Na2O + K2O), P2O5 and Nb contents, and its high-k calc-alkaline features show that D3 is an I-type granite (Collins et al. Reference Collins, Beams, White and Chappell1982; Whalen et al. Reference Whalen, Currie and Chappell1987). In addition, all D3 samples plot in the I-type granite area (Fig. 9a, b, c, d, e, f).
6.b. Petrogenesis of the rocks
6.b.1. A magmatic origin for the Na-rich granite porphyry and albitophyre
For a long time, Na-rich granites were considered to be the result of post-magmatic metasomatism and they may be related to A-type granite magmatism (see review in Cerny, Reference Cerny1992). However, the volcanic rocks and subvolcanic rocks with similar features pose a serious challenge to the metasomatic interpretation. For some peculiar rocks, the magmatic genesis can be supported (Kovalenko & Kovalenko, Reference Kovalenko and Kovalenko1984; Cerny, Reference Cerny1992). Most authors believe that the Na-rich character of A-type granites should be attributed to post-magmatic metasomatism (e.g. Kaur et al. Reference Kaur, Chaudrih, Okrush and Koepke2006). The latter may be the result of infiltration of a high-Na/(Na + K) fluid or the exsolution of the late magmatic fluid (e.g. Haapala, Reference Haapala1997; Chaudhri et al. Reference Chaudhri, Kaur, Okrusch and Schimrosczyk2003; see review in Cerny, Reference Cerny1992). In such cases, albite would replace K-feldspar. The Dapingliang Na-rich D1 and D2 still contain a certain percentage of K-feldspar and we argue that these rocks did not result from metasomatic processes on the basis of field, textural and chemical arguments. (1) The late magmatic to subsolidus alteration recorded within the Dapingliang magmatic rocks represents chloritization and epidotization (Chen et al. Reference Chen, Zhu, Cao and Lü2016). However, they did not significantly affect the granitic facies and could not account for the albitization. This is illustrated by the preservation of the K-feldspar rapakivi coronas, as well as by magmatic textures. (2) The textures of D1 and D2 are consistent with a magmatic origin. Albite mainly occurs in the form of euhedral crystals, as the minerals grow in a cooling magma. The albite grains formed by late magmatic processes would appear in anhedral and/or interstitial forms (Fig. 4a2, b3). (3) Microscopic observations of D1 and D2 show that the replacement textures within K-feldspars (albite rims, patchy perthite) are very limited. (4) Zircon is sensitive to the circulation of Na-rich fluids. Previous studies have shown that zircon would dissolve when it comes into contact with these fluids and the zircon would present mosaic zoning and pervasive recrystallization spongy textures (Rubatto et al. Reference Rubatto, Müntener, Barhoorn and Gregory2008). However, zircons from D1 and D2 do not show this porous aspect and display well-preserved magmatic textures (e.g. oscillatory zoning) (Fig. 5a1, b1). (5) Normally, metasomatism will result in the formation of (Cl, Li, F)-bearing minerals (e.g. lepidolite or topaz) (see review in Cuney et al. Reference Cuney, Marignac and Weisbrod1992). However, these minerals are not found in D1 and D2. (6) During metasomatic albitization, Nb is highly enriched (Wedepohl, Reference Wedepohl1978). Such enrichment is not recorded within D1 and D2 (10.4–16.2 ppm; Table 4). (7) Previous studies have shown that post-magmatic metasomatism would dramatically increase the contents of Ga, Li, Rb and U in rocks (through mica recrystallization) and decrease the contents of Sr, Ba and Eu (through albitization) or LREE (by-phase leaching) (Higgins et al. Reference Higgins, Solomon and Varne1985; Mackenzie et al. Reference Mackenzie, Black and Sun1988). D1 and D2 do not show these characteristics but show completely opposite trends (e.g. low Rb and Ga contents).
6.b.2. Petrogenesis of albitophyre and granite porphyry
6.b.2.1. Genesis of A-type felsic magmas from crustal sources
The genetic models of A-type granite fall into three main categories: (1) derivation from a mantle-derived mafic magma (e.g. Jacobson et al. Reference Jacobson, MacLeod and Black1958; Turner et al. Reference Turner, Foden and Morrison1992; Auwera et al. Reference Auwera, Bogaerts, Liégeois, Demaiffe, Wilmart, Bolle and Duchesne2003), (2) melting of the crust (e.g. Collins et al. Reference Collins, Beams, White and Chappell1982; Anderson, Reference Anderson1983; Clemens et al. Reference Clemens, Holloway and White1986; Creaser et al. Reference Creaser, Price and Wormland1991) and (3) a combination of mantle and crustal sources (e.g. Barker et al. Reference Barker, Wones, Sharp and Desborough1975; Foland & Allen, Reference Foland and Allen1991; Frost & Frost, Reference Frost and Frost1997). The key point is to obtain the very specific geochemical features observed in A-type granites, such as high Na2O contents.
D1 has low TiO2 and Fe2O3T contents and shows obvious negative Eu anomalies, along with a weakly peraluminous character, low CaO/(MgO + FeOT) (0.12–0.51) and high Al2O3/(MgO + FeOT) (8.3–35.0) molar ratios. This consistently rules out D1 as being from a mantle-derived mafic magma (Vielzeuf & Holloway, Reference Vielzeuf and Holloway1988; Montel & Vielzeuf, Reference Montel and Vielzeuf1997). Zircons from D1 show negative ε Hf(t) values (−11.41 to −7.22), significantly deviating from the Hf isotope compositions of the coetaneous Xingdi mafic rocks derived from the mantle-derived mafic magma and matching the Hf isotope compositions of the Xingdi II granites derived from the lower crust (Zhang et al. Reference Zhang, Zou, Wang, Li and Ye2012b; Cao et al. Reference Cao, Lü, Yuan, Wang, Liu and Shen2014). If the magma source was from a combination of crustal and mantle sources, the geochemical characteristics of the rock would show some mantle information. Mixing of mantle and crustal melts will produce liquids of intermediate composition, which may fractionate to eventually generate granitic rocks. These intermediate products do not outcrop in this area. Indeed, the intermediate rocks that outcrop in the Xingdi area (some of them being described in Cao et al. Reference Cao, Lü, Liu, Zhang, Gao, Chen and Mo2011) have a distinctive Nd isotopic signature and are therefore not related to D1. In addition, the high La abundances and significantly lower La/Yb ratios suggest that this rock is not related to the intermediate rocks by highly fractional crystallization. On the other hand, its high SiO2, Zr and Hf contents, low Cr, Ni and MgO contents, and stable enriched Sr–Nd isotope compositions reflect its single crustal source. The ε Nd(t) values (−11.45 to −11.98) are similar to those of the Xingdi granites (c. 735 Ma) (−11.28 to −12.30) derived from the lower crust (Zhang et al. Reference Zhang, Yang, Wang, Takahashi and Ye2011), indicating its crustal source.
6.b.2.2. Rock formation process of the albitophyre
Magmatic Na-rich granites have been widely accepted (Christiansen et al. Reference Christiansen, Burt, Sheridan and Wilson1983; London et al. Reference London, Morgan and Hervig1989; Petford & Atherton, 1996; Xiong et al. Reference Xiong, Zhao, Zhu and Rao1999). There are two types of formation mechanism of the Na-rich granites: (1) H2O-fluxed partial melting of the meta-mud siltstone under high-pressure conditions (∼10 kbar) (Patiño Douce & Harris, Reference Patiño Douce and Harris1998; Patiño Douce & McCarthy, Reference Patiño Douce and McCarthy1998); (2) partial melting of the mafic rocks (e.g. hornblendite) (Rapp & Watson 1991, 1995; Atherton & Petford, Reference Atherton and Petford1993; Garcia, Reference Garcia2005; Stevenson et al. Reference Stevenson, Daczko, Clarke, Pearson and Klepeis2005; Richards & Kerrich, Reference Richards and Kerrich2007).
Here, we rule out the possibility of the partial melting of the meta-mud siltstone under high-pressure conditions. The supporting arguments are as follows: (1) its relatively low Rb and K contents and low Rb/Sr ratios (mostly less than 0.04) argue against significant mica in the source. The reaction of the H2O-fluxed partial melting should involve muscovite (Patiño Douce & Harris, Reference Patiño Douce and Harris1998). Under high pressure, the reactions are as follows: (i) quartz + plagioclase + H2O → melt; (ii) quartz + plagioclase + muscovite + H2O → melt + biotite; (2) D1 shows a weakly peraluminous character, which is different from the Na-rich strongly peraluminous S-type granites derived from the partial melting of the meta-mud siltstone; (3) the above reactions occur under fully H2O-saturated and low-temperature conditions ( ≤ 750 °C). However, the calculated zircon saturation temperatures of D1 were c. 838 °C. As rutile is lacking in the mineral assemblage, the calculated temperatures were minimum estimates (Watson & Harrison, Reference Watson and Harrison2005). The formation temperature is slightly higher and we do not find enhydrite in the rocks. Thus, D1 should be from the partial melting of the mafic rocks (e.g. hornblendite).
A lack of upwardly concave chondrite normalized REE patterns indicates that amphibole was not a major residual phase during their formation (Borg & Clynne, Reference Borg and Clynne1998). Experimental petrography has shown that the partial of the amphibole under high temperatures (1000–1150 °C) and pressures (8–32 kbar) could form Na-rich melts (Rapp & Watson, Reference Rapp and Watson1995). The solidus curve of hornblendite shows that amphibolite begin to produce melts when temperatures are greater than 650 °C and the calculated zircon saturation temperatures of D1 were c. 838 °C. In the Kuluketage area, the basement rocks are mainly composed of amphibolites and TTG series (Lu, Reference Lu1992; Hu et al. Reference Hu, Jahn, Zhang, Chen and Zhang2000). Based on their pronounced negative ε Nd(t) and ε Hf(t) values, Early Palaeoproterozoic T DM2, high (87Sr/86Sr)i and elemental compositions, we suggest that D1 was derived from the partial melting of basement amphibolites. The positive correlation in the La/Sm vs La, La/Yb vs La and Ce/Yb vs Ce diagrams further indicates that the genesis of D1 was related to different degrees of partial melting.
6.b.2.3. Rock formation process of granite porphyry
D2 is also an Na-rich A-type granite. Isotopically, D2 also has high (87Sr/86Sr)i and negative ε Nd(t) values, but it has a large range of ε Hf(t) and 206Pb/204Pb values. Note that D2 has decoupling Nd–Hf isotope compositions, indicating metasomatism of the mantle sources (Pearce et al. Reference Pearce, Kempton, Nowell and Noble1999). On the 207Pb/204Pb vs 206Pb/204Pb diagram, D2 samples not only plot near the lower crust, but also plot in the MORB. The large range of the Pb isotopic compositions is commonly interpreted as a mixing between mantle-derived Pb and less radiogenic crustal Pb (Davidson et al. Reference Davidson, Harmon and Wörner1991). Generally, metasomatism of the crust materials, especially recent metasomatism, could not significantly change Hf isotope compositions, but could decrease ε Nd(t) values. We suggest that the decoupling between Nd–Hf isotope compositions, in conjunction with its c. 1.4 Ga Hf T DM2, supports the idea of the recent metasomatism of the mantle sources. The decoupling between the consistent Nb/La ratios and the wide range of the ε Hf(t) values indicate that both metasomatism of the depleted mantle source and crustal contamination have contributed to the geochemical signatures of D2, while the εHf(t) values of D2 range between −4.35 and + 1.5, indicating that relatively juvenile crust or coeval depleted mantle played an important role in the magma source. The T DM2 of zircons with positive ε Hf(t) values range from 1.4 to 1.5 Ga. As the Mesoproterozoic was dominated by carbonate sedimentation with minor magmatism in the northern Tarim (e.g. Gao et al. Reference Gao, Chen, Lu, Peng and Qin1993; Lu et al. Reference Lu, Li, Zhang and Niu2008b), and the juvenile crust of this age has not yet been documented, we interpret the positive ε Hf(t) of these zircons as being a result of the contemporary addition of depleted mantle-derived magma and its mixing with the old continental crust-derived magma. It is noticeable that the zircon Hf isotopic compositions of D2 continuously vary from positive or nearly positive values to large negative values even in a single sample (Fig. 5b1). The wide range of Hf isotopic composition in the sample scale cannot be explained by magma evolution in a closed system and, thus, rules out the possibility of a simple ‘liquid line of descent’ crystallization process. Instead, it indicates the involvement of magma mixing between two discrete magma sources (e.g. Griffin et al. Reference Griffin, Wang, Jackson, Pearson, O’Reilly, Xu and Zhou2002; Kemp et al. Reference Kemp, Whitehouse, Hawkesworth and Alarcon2005, Reference Kemp, Hawkesworth, Foster, Paterson, Woodhead, Hergt, Gray and Whitehouse2007; Yang et al. Reference Yang, Wu, Chung, Wilde and Chu2006, Reference Yang, Wu, Wilde, Xie, Yang and Liu2007; Chen et al. Reference Chen, Tian, Jahn and Chen2008; Qin et al. Reference Qin, Lai, Grapes, Diwu, Ju and Li2009). Therefore, the variation of ε Hf(t) value was explained by different degrees of magma mixing between the depleted mantle-derived magma and the old continental crust-derived magma. The T DM2 of D1 was rejuvenized by injection of the depleted mantle-derived magmas. However, a mechanism must be involved which allows zircons incorporating different Hf isotopic compositions produced by different degrees of hybridization to be juxtaposed in a single sample. Griffin et al. (Reference Griffin, Wang, Jackson, Pearson, O’Reilly, Xu and Zhou2002) suggested that the magma-mixing processes occurred during transport in magma conduits. Kemp et al. (Reference Kemp, Hawkesworth, Foster, Paterson, Woodhead, Hergt, Gray and Whitehouse2007) proposed a dual-level magma-mixing model to interpret the zircon Hf–O isotopic data of I-type granite in the Lachlan Fold Belt of Australia. In this model, the underplating of mantle-derived magma leads to anatexis of the lower crust and melt hybridization, resulting in melts with different Hf-isotope components that are expelled through feeder dykes to a shallow magma chamber, where they interact with supra-crustal rocks, and zircons incorporating different Hf isotopic components crystallize. This model could explain the large variation of ε Hf(t) observed in D2. This magma was a mixture of old lower crust and depleted mantle-derived magma, but mainly through partial melting of the old lower crust.
The proposal that parental magmas were mainly derived from partial melting of the old lower crust is supported by the following arguments: (1) the incompatible element ratios and the pronounced positive Zr–Hf anomalies indicate that the parental magma comprised assimilated crustal materials (Fig. 8d). The crustal materials could significantly contribute to the enriched signature of the rocks; (2) D2 has consistent Nb/La ratios similar to the continental crust average (Rudnick & Gao, Reference Rudnick and Gao2003); (3) the metasomatism of the parental magma by the crustal materials could significantly decrease the Nb/La ratios and lead to the enrichment of the LILE and high (87Sr/86Sr)i and low ε Nd(t) values simultaneously; (4) the extremely depleted Fe2O3, MgO, Ba, K, P and Ti, and relatively higher Zr and Hf levels.
D2 is also an Na-rich A-type granite and shows similar REE distribution patterns and a similar primitive mantle-normalized spider diagram (excluding the Rb and K elements) to D1, indicating their similar magma sources. D2 was mainly derived from partial melting of the basement amphibolites. Its relatively high Rb, K and Rb/Sr ratios (0.3–0.5) indicate that there was significant mica in their source, which can be interpreted as being of a peraluminous character. Of the major elements, D2 has relatively lower SiO2 and Na2O contents and higher Fe2O3, Al2O3, MgO, CaO and K2O contents than D1, due to the metasomatism of the mantle sources. The primitive mantle-normalized spider diagrams of D2 show an obviously negative Eu anomaly and low Sr contents, indicating that the parental magma source area should have a large residual plagioclase crystallization. In addition, experiments performed by Skjerlie & Johnston (Reference Skjerlie and Johnston1992) and Patiño Douce (Reference Patiño Douce1997) indicate that the plagioclase must be the main equilibrium residue phase in order to produce A-type granite. The positive correlation of the La/Sm vs La, La/Yb vs La and Ce/Yb vs Ce diagrams further indicates that the genesis of D2 was related to different degrees of partial melting of the parent magma.
6.b.3. Petrogenesis of diorite porphyrite
D3 is a high-k calc-alkaline rock, which is different from the two Na-rich rocks described above. It exhibits a weakly negative Eu anomaly and relatively high LREE/HREE fractionation. The negative Eu and Sr anomaly and low (La/Yb)N and (Sr/Y)N values show that the origin should have left residual plagioclase and no residual garnet. It shows apparently negative anomalies for Nb, Ta, P and Ti elements, and positive anomalies for Rb, Ba, K and Sm elements. This is characteristic of similar arc-related granites. D3 is enriched in LILE, LREE and mobile incompatible lithophile Th and U elements but is depleted in P, Ti, Nb and Ta elements, and reflects the obvious negative anomaly ‘TNT’ characteristics of subduction mantle related granites (Sun & McDonough, Reference Sun and McDonough1989). The trace elements and REE patterns are not compatible with the ones identified in within-plate granite. Its high Ba content (Ba positive anomaly) is also different from the anorogenic alkaline granites, as Bonin (Reference Bonin1990) pointed out that the Ba is strongly depleted in early anorogenic alkaline granites but is more abundant in post-orogenic alkaline granites. High MgO, FeOT, CaO and K2O contents, low SiO2 contents, enriched LILE and depleted HFSE (high field strength element), and hornblende and pyroxene minerals in the rock indicate its mafic magma origin (Vielzeuf & Holloway, Reference Vielzeuf and Holloway1988; Montel & Vielzeuf, Reference Montel and Vielzeuf1997). High LILE (large ion lithophile element), Zr and Hf contents, significantly enriched Sr–Nd isotope compositions and relatively older T DM2 indicate a crustal source. Sr–Nd–Pb–Hf isotopic data indicate that this rock originated from the lower crust. These features are similar to Qinling Orogen post-collisional granites, and HF Zhang et al. (Reference Zhang, Jin, Zhang, Harris, Zhou, Hu and Zhang2007) suggested that the Qinling Orogen post-collisional granites may have been generated by melting of lower crustal K-rich hornblende. Most melting experiments have shown that the ilmenite or rutile are always residual phases (Rapp & Watson, Reference Rapp and Watson1991; Martin et al. Reference Martin, Smithies, Rapp, Moyen and Champion2005). Residual minerals such as rutile and ilmenite could account for the Nb, Ta and Ti negative anomalies (Green & Pearson, Reference Green and Pearson1987; Foley et al. Reference Foley, Barth and Jenner2000). D3 could be dominated by melting of the K-rich hornblende in the lower crust.
6.c. Tectonic implications
D3 is different from D1 and D2 in that it has relatively high K2O, BaO, CaO and MgO contents and low Na2O and SiO2 contents. It belongs to the high-K calc-alkaline series and is a typical I-type granite, which differs from rifting-related A-type granite. According to the Barbarin (Reference Barbarin1999) classification scheme, these plutons belong to the KCG group (K-rich and K-feldspar porphyritic calc-alkaline granitoids), which is commonly distributed in post-collisional uplift tectonic settings. Although KCG rocks can be found in other settings, they are commonly associated with other major granite types such as MPG (muscovite-bearing peraluminous granitoids) or CPG (cordierite-bearing peraluminous granitoids) in syn-collisional tectonic settings, and ACG (amphibolerich calc-alkaline granitoids) in active continental margins. However, the lack of typical syn-collisional and subduction magmatic rocks precludes syn-collisional tectonic and subduction settings, and the Sr–Nd–Pb–Hf isotopic data, instead, indicate that this rock originated from the lower crust. These features are similar to the Qinling Orogen post-collisional granites, and HF Zhang et al. (Reference Zhang, Jin, Zhang, Harris, Zhou, Hu and Zhang2007) suggested that these granites were generated by the melting of lower crustal K-rich hornblende, with plagioclase, pyroxene and Fe–Ti containing mineral residues. As described above, the post-collisional setting has been dated to c. 830–800 Ma in the Kuluketage Block (CY Luo et al. Reference Luo, Yang, Zhu, Luo and Zhang1998; XR Luo et al. Reference Sun and Huang2007; Sun & Huang, Reference Luo, Shi, Fan and Luo2007; CL Zhang et al. Reference Zhang, Li, Li, Lu, Ye and Li2007a; Cao et al. Reference Cao, Lü, Lei, Chen, Wang, Du, Mei, Gao and Du2010, Reference Cao, Lü, Liu, Zhang, Gao, Chen and Mo2011; Shu et al. Reference Shu, Deng, Zhu, Ma and Xiao2011) and the rifting-related mafic–ultramafic intrusions, dyke swarms and bimodal volcanic rocks were dated to c. 774–725 Ma (B Xu et al. Reference Xu, Jian, Zheng, Zou, Zhang and Liu2005, Reference Xu, Xiao, Zou, Chen, Li, Song, Liu, Zhou and Yuan2009; CL Zhang et al. Reference Zhang, Li, Li, Lu, Ye and Li2007a, 2009, Reference Zhang, Yang, Wang, Takahashi and Ye2011; Lu et al. Reference Lu, Zhao, Wang and Hao2008a; ZY Zhang et al. 2009). On the tectonic discrimination diagrams, D3 samples fall in the volcanic arc granite (VAG) field (Fig. 11). The arc-featured geochemical characteristics are common in Kuluketage Neoproterozoic magmatic rocks, such as the Xingdi granites formed in a rift setting (Qin, unpub. Master’s thesis, Xinjiang Univ., 2012; Cao et al. Reference Cao, Lü, Yuan, Wang, Liu and Shen2014). Its K-rich I-type characteristics and arc-related geochemical features were induced either by an enriched source or by the injection of the mafic magma that originated from the metasomatized lithospheric mantle. So, D3 was likely formed in a rift setting. D1 and D2 belong to high-Na alkaline series and are typical A-type granites. Analysed samples from D1 and D2 fall within the WPG field, suggesting a plate rift setting (Fig. 11). Although the genetic mechanism of A-type granites is still controversial, there is a general consensus that these rocks are located in an extensional or non-compressional tectonic environment (Whalen et al. Reference Whalen, Currie and Chappell1987; Sylvester, Reference Sylvester1989; Rogers & Greenberg, Reference Rogers and Greenberg1990; Eby, Reference Eby1990, Reference Eby1992). The thinning of extensional crust is often closely related to deep thermal activity (such as mantle upwelling or injection of basic magma) in time and space. The formation of A-type granite is mainly attributed to the upward movement of the warm asthenosphere mantle. In this study, the magma source of D1 was from the lower crust and the heat could be from the recently under-plated basalts or mantle-derived magmas. The magma source of D2 was from a combination of crustal and mantle sources. The upwelling of the asthenosphere not only provides the necessary heat and material source for the formation of A-type granitic magma, but also causes the partial melting of large areas of crustal material. There may be a problem when D1 and D2 are further classified into A2-type granite. Eby (Reference Eby1992) pointed out that the A2 ype represents magmas derived from continental crust or underplated crust that has been through a cycle of continent–continent collision or island-arc magmatism. Most A2-type granites are related to post-collisional environments (Eby, Reference Eby1992), but not all. Jia et al. (Reference Jia, Wang and Tang2009) proposed that A2-type granites could be formed from a long period of high heat-flow related granitic rocks emplaced at the end of magmatism (such as Australia Gabo and Mumbulla). Many A-type granites formed in a rift setting and plot in both the A1 and A2 areas in the A1–A2 type discrimination diagrams from Eby (Reference Eby1992) and Bonin (Reference Bonin2007). Jia et al. (Reference Jia, Wang and Tang2009) pointed out that we should take a cautious attitude, and it is necessary to combine the geological background with comprehensive analysis when we use the A1–A2 type discrimination diagrams. Some of the A2-type granites formed by combining the asthenosphere material and crustal material from the Yangtze Craton were formed in a rifting setting. Xingdi A2-type granite from the Kuluketage Block also formed in a rift setting (Cao et al. Reference Cao, Lü, Yuan, Wang, Liu and Shen2014). Thus, D1 and D2 were formed in a rift setting.
Over the past ten years, a great deal of research has been carried out on the geochronology, genesis and tectonic evolution of the magmatic rocks in the Kuluketage area (Fig. 1b). The Neoproterozoic magmatic activities in the Kuluketage Block can be divided into four stages:
(i) c. 1000–850 Ma metamorphic rocks, gneissic granites and granitic rocks;
(ii) c. 830–760 Ma ultramafic–mafic–carbonatite complexes, voluminous adakitic granites and mafic dyke swarms;
(iii) c. 745–710 Ma mantle-derived mafic dykes, tholeiitic ultramafic–mafic bimodal intrusions, basalt, alkaline granites and bimodal volcanic rocks;
(iv) c. 650–630 Ma mafic dykes and volcanic rocks (Table 1; Fig. 2).
During this period (c. 745–710 Ma), the magmatic rocks are mainly Xingdi bimodal intrusive rocks, Beiyixi bimodal volcanic rocks and Teruiaiken pillow basalts (Xu et al. Reference Xu, Kou, Song, Wei and Wang2008; Gao et al. Reference Gao, Wang, Xu, Yang and Zhang2010; Qin, unpub. Master’s thesis, Xinjiang Univ., 2012; Cao et al. Reference Cao, Lü, Yuan, Wang, Liu and Shen2014; Chen et al. Reference Chen, Chen, Ripley, Li, Deng, Yue, Zheng and Fu2017). B Xu et al. (Reference Xu, Jian, Zheng, Zou, Zhang and Liu2005, Reference Xu, Xiao, Zou, Chen, Li, Song, Liu, Zhou and Yuan2009) reported two SHRIMP U–Pb ages of 740 and 755 Ma for volcanic rocks from near the base of the Beiyixi Formation, and a SHRIMP U–Pb age of 725 Ma for volcanic rocks from near the top of the Beiyixi Formation. The geochronology of the Beiyixi volcanic rocks in Xishankou that appear above the Beiyixi diamictite unit (Xiao et al. Reference Xiao, Bao, Wang, Kaufman, Zhou, Li, Yuan and Ling2004) has also been studied and a SHRIMP U–Pb zircon age of 727 Ma has been assigned to the top horizon of volcanic rocks in the Beiyixi Formation (Huang et al. Reference Huang, Xu, Zhang, Li and Zhu2005). Zhang et al. (Reference Zhang, Zou, Wang, Li and Ye2012b) and Cao et al. (Reference Cao, Lü, Yuan, Wang, Liu and Shen2014) reported three LA-ICP-MS U–Pb ages of 743, 735 and 739 Ma for samples collected from bimodal intrusive rocks formed in a rift setting. Qin (unpub. Master’s thesis, Xinjiang Univ., 2012) reported five LA-ICP-MS U–Pb zircon ages (728, 741, 729, 737 and 731 Ma) for samples collected from Xingdi I and IV bimodal intrusive rocks (granite and gabbro), formed in a rift setting related to mantle plume activities. B Xu et al. (Reference Xu, Jian, Zheng, Zou, Zhang and Liu2005) reported a SHRIMP U–Pb age of 755 Ma for volcanic rocks formed in a rift setting related to mantle plume activities. Recently, B Lv (unpub. Master’s thesis, Xinjiang Univ., 2017) reported two LA-ICP-MS U–Pb ages of 735 and 738 Ma for samples collected from Korla rhyolite and granite formed in an intraplate extension environment related to post-collision extension. Tang et al. (Reference Tang, Zhang, Li, Wang and Ripley2016) and Chen et al. (Reference Chen, Chen, Ripley, Li, Deng, Yue, Zheng and Fu2017) reported three LA-ICP-MS zircon U–Pb ages of 743, 728 and 727 Ma for samples collected from Xingdi gabbro formed in a subduction-related island-arc setting. Existing studies show disputed interpretations as to the tectonic attribution of late Neoproterozoic (c. 745–710 Ma) magmatic activities in the Kululetage Block: a continental rift setting related to mantle plume activities or an island-arc setting.
The following evidence supports an island-arc setting and opposes a continental rift setting related to mantle plume activities (e.g. Qin, unpub. Master’s thesis, Xinjiang Univ., 2012; Tang et al. Reference Tang, Zhang, Li, Wang and Ripley2016; Chen et al. Reference Chen, Chen, Ripley, Li, Deng, Yue, Zheng and Fu2017; B Lv, unpub. Master’s thesis, Xinjiang Univ., 2017): (1) whole-rock trace elemental compositions clearly show arc signatures, such as enriched LILE and depleted Nb, Ta and P elements; (2) there is no direct evidence to support mantle plume activities in the Tarim Block, such as exposed komatite, high-mafic basalt and ocean island basalt in the TC; (3) magmatic rocks in the Kuluketage Block are mainly granites derived from the remelting of the lower crust, while the contribution of the mantle material is very limited; (4) the model of a rift setting related to mantle plume activities in the northern rim of the TC is not supported by the protracted nature of magma emplacement, and there is no hot-spot track.
The following evidence supports a, more-likely, continental rift setting: (1) the Xingdi mafic–ultramafic rocks are typical bimodal intrusions, which are different from the calc-alkaline andesite formed in a typical continental margin island-arc setting. The bimodal mafic–ultramafic intrusions usually form in a rift setting (Condie, Reference Condie1982). The Xingdi mafic–ultramafic rocks are mainly tholeiite series, which are different from the calc-alkaline basalt series formed in a typical continental margin island-arc setting. Both Xingdi I and II complexes are bimodal intrusive complexes, and the volume of the granites in the Xingdi I complex reaches up to 30 %, which precludes an arc setting because the volume of the silicic end member of bimodal igneous series is generally less than 2 % in arc settings (Pin & Paquette, Reference Pin and Paquette1997; Zhang et al. Reference Zhang, Zou, Wang, Li and Ye2012b); (2) during plate subduction, the plate will be dehydrated. U enters fluid more easily than Th, and island-arc related basalt generally has a low Th/U ratio (Hawkesworth et al. Reference Hawkesworth, Turner, McDermott, Peate and van Clasteren1997; Becker et al. Reference Becker, Jochum and Carlson1999). Xingdi mafic–ultramafic intrusions have a high Th/U ratio (3.02–4.81) (Qin, unpub. Master’s thesis, Xinjiang Univ., 2012). Island-arc related basalts usually have low Zr contents (<100 ppm), while intraplate-related basalts have high Zr contents (Pearce & Norry, Reference Pearce and Norry1979). The Xingdi mafic–ultramafic intrusions have high Zr contents; (3) as most mafic rocks from the complexes were cumulated products with variable crustal contamination, the geochemical characteristics of some island arcs would be inherited from the continental crust and continental lithospheric mantle. The unique physical properties of the continental lithosphere allow it to retain previous magmatic tectonic events, such as early subduction (Zhang et al. Reference Zhang, Stephenson, O’Reilly, McCulloch and Norman2001; Sprung et al. Reference Sprung, Schuth, Münker and Hoke2007). Thus, whole-rock trace element compositions would show arc signatures, such as enrichment in LILE, and depletion in Nb, Ta and P elements; (4) Wei et al. (Reference Wei, Guo, Sun, Lv, Guo and Hu2017) reported the clastic composition of sandstone from the Nanhua Formation, which is consistent with continental-rift sandstone, indicating a continental rift setting. Therefore, we may consider the c. 745–710 Ma magmatic rocks to have been formed in a continental rift setting.
The following lines of evidence indicate that the c. 745–710 Ma magmatic rocks in the Kuluketage Block were formed in a continental rift setting, probably related to the underplating of mantle plume-derived magmas: (1) the E–W-trending positive magnetic anomaly belt, located in the central Tarim Basin along latitude 39° 40′, is nearly 30 000 km2 in the superimposed map of the distribution of the Neoproterozoic rift and aeromagetic anomalies (Liu et al. Reference Liu, Lü, Wu, Hu, Duan, Deng, Wang, Zhu, Zeng, Wang, Wang and Lu2016). According to the Bouguer gravity map, the Bachu area is characterized by high value and a northeastern high-gravity belt also observed in the central Tarim Basin (Liu et al. Reference Liu, Lü, Wu, Hu, Duan, Deng, Wang, Zhu, Zeng, Wang, Wang and Lu2016). The distribution of the magnetic anomaly and the gravity anomaly in Tarim share the same characteristics, indicating that the two are homologous (M Xu et al. Reference Xu, Wang, Zhong, Hu, Li and Hu2005). The high magnetic anomaly belt is mainly due to Neoproterozoic rift-related magmatic activities (Guo et al. Reference Guo, Zhang and Wang1998, Reference Guo, Zhang, Jia and Wei2000; YJ Li et al. Reference Li, Sun, Hu, Song, Wang and Tan2003; Wu et al. Reference Wu, Li, Wang, Wei, Luo and Meng2006; Hou & Yang, Reference Hou and Yang2011). The positive magnetic anomalies found in the Bachu area are potentially indicative of a close proximity to the central part of the mantle plume in the inner Tarim Basin, which could be consistent with the occurrence of picrite in this area (Tian et al. Reference Tian, Campbell, Allen, Guan, Pan, Chen, Yu and Zhu2010). Picrite is a rock containing >18 % MgO and is derived from a high degree of mantle melting, most likely at the hottest part or the plume centre (Hill, Reference Hill1991; Gill et al. Reference Gill, Pedersen and Larsen1992; Coffin & Eldholm, Reference Coffin and Eldholm1994; Saunders, Reference Saunders2005; Zhang et al. Reference Zhang, Mahoney, Mao and Wang2006c). Although picrite has not been found along the NE margin of the Tarim Block, a picritic magma is suggested according to the inferred composition of olivine in the mafic–ultramafic rocks (Ling et al. Reference Ling, Xia, Guo, Wang, Xia and Jiang2011; Xia, Reference Xia2012); (2) although the closely temporal and spatially related Beiyixi basalts were derived from metasomatized subcontinental lithospheric mantle (SCLM), they exhibit typical intraplate signatures similar to those studied in intrusive complexes (B Xu et al. Reference Xu, Jian, Zheng, Zou, Zhang and Liu2005, Reference Xu, Xiao, Zou, Chen, Li, Song, Liu, Zhou and Yuan2009; CL Zhang et al. Reference Zhang, Li, Li and Ye2009). There is no evidence for different tectonic settings between the basalts and the intrusive complexes. In general, voluminous mafic dyke swarms are ascribed to the break-up of continents by mantle plumes (Ernst et al. Reference Ernst, Wingate, Buchan and Li2008); (3) in this paper, the parental magma of D2 originated from the mixing of depleted mantle and crustal magma, but mainly from crustal magma; (4) c. 4000 km2 of Neoproterozoic granites are distributed in the northern margin of Tarim. Most granites are adakitic granites derived from the partial melting of the thickened lower crust. Tremendous heat is required to melt deep crust; (5) Figure 14 shows the characteristics of Late Neoproterozoic Nd–Hf isotope evolution in the Kuluketage Block, indicating crustal growth related to depleted mantle-derived magmas.The Late Neoproterozoic mafic complex in the region has positive ε Nd(t) and ε Hf(t) values, indicating that the ancient SCLM was probably metasomatized by underplated materials of the mantle plume and became more depleted. These lines of evidence suggest that the underplating of mantle plume-derived magmas could have reworked the continental crust of the TC. Here, a partial melting scheme triggered by underplating of mantle plume-derived magmas is proposed to interpret the formation of the Late Neoproterozoic c. 745–710 Ma A-type and I-type granites, bimodal intrusive rocks, adakitic granites and volcanic rocks (Fig. 15).

Fig. 14. (a) Diagram of ε Hf(t) – t (after Long et al. Reference Long, Yuan, Sun, Kröner, Zhao, Wilde and Hu2011b). (b) Diagram of ε Nd(t) – t (after Cao et al. Reference Cao, Lü, Yuan, Wang, Liu and Shen2014). Data cited from Long et al. (Reference Long, Yuan, Sun, Kröner, Zhao, Wilde and Hu2011b), Zhang et al. (Reference Zhang, Li, Santosh, Li, Zou, Wang and Ye2012a, b), Cao et al. (Reference Cao, Lü, Yuan, Wang, Liu and Shen2014), Tang et al. (Reference Tang, Zhang, Li, Wang and Ripley2016), Chen et al. (Reference Chen, Chen, Ripley, Li, Deng, Yue, Zheng and Fu2017) and references therein.

Fig. 15. A proposed model for the generation of Late Neoproterozoic (c. 745–710 Ma) magma in the Kuluketage area, mostly likely triggered by underplating magmas.
Rodinia was a c. 1.0 Ga supercontinent and amalgamated during the Grenville Orogeny (Hoffman, Reference Hoffman1991; Moores, Reference Moores1991). Based on glacial diamictite-bearing sedimentary sequences, and the correlation of palaeomagnetic poles and magmatic events within Australia and the South China Block (SCB), the TC is considered to be a part of the Neoproterozoic Rodinia supercontinent. The TC was suggested to be located in the periphery of the proposed Rodinian superplume (Lu, Reference Lu2002; XH Li et al. Reference Li, Li, Ge, Zhou, Li, Liu and Wingate2003; Chen et al. Reference Chen, Xu, Zhan and Li2004; B Xu et al. Reference Xu, Jian, Zheng, Zou, Zhang and Liu2005, Reference Xu, Xiao, Zou, Chen, Li, Song, Liu, Zhou and Yuan2009; CL Zhang et al. 2006a, Reference Zhang, Li, Li, Wang and Guo2006b, Reference Zhang, Li, Li, Lu, Ye and Li2007a; Deng et al. Reference Deng, Shu, Zhu, Ma and Wang2008; Li et al. Reference Li, Bogdanova, Collins, Davidson, De Waele, Ernst, Fitzsimons, Fuck, Gladkochub, Jacobs, Karlstrom, Lu, Natapovm, Pease, Pisarevsky, Thrane and Vernikovsky2008; Lu et al. Reference Lu, Zhao, Wang and Hao2008a, b; ZY Zhang et al. Reference Zhang, Li, Li and Ye2009; Shu et al. Reference Shu, Deng, Zhu, Ma and Xiao2011). Palaeogeographic reconstructions and available palaeomagnetic data suggest that the TC and SCB were closely positioned in the period of the Neoproterozoic Rodinia supercontinent (Chen et al. Reference Chen, Xu, Zhan and Li2004; Li et al. Reference Li, Evans and Zhang2004; Macouin et al. Reference Macouin, Besse, Ader, Gilder, Yang, Sun and Agrinier2004; B Xu et al. Reference Xu, Jian, Zheng, Zou, Zhang and Liu2005). The Neoproterozoic picritic, komatiitic basalts, rifting-related mafic dykes and A-type granite strongly support the existence of a Neoproterozoic plume, developed in the SCB (XC Wang et al. Reference Wang, Li, Li and Li2007; Li et al. Reference Li, Zhu, Zhong, Wang, He, Bai and Feng2010; Q Wang et al. Reference Wang, Wyman, Li, Bao, Zhao, Wang, Jian, Yang and Chen2010). Similarly, the Neoproterozoic plume and the underplating of plume-related mafic magmas can be interpreted as the reworking of the lithosphere in the SCB, which is supported by the tectonic settings and the similarities of rock associations to TC (XH Li et al. Reference Li, Li, Zhou, Liu and Kinny2002; XH Li et al. Reference Li, Li, Ge, Zhou, Li, Liu and Wingate2003, Reference Li, Li, Wingate, Chung, Liu, Lin and Li2006; ZX Li et al. 2003). Therefore, the mantle plume provides an effective mechanism for reactivation of the old craton. Due to the underplating of the plume-related magmas, the continental blocks of the Neoproterozoic Rodinia supercontinent were reworked and this eventually resulted in the break-up of the Rodinia supercontinent. These Late Neoproterozoic magmatic activities in the Kuluketage Block were probably related to the break-up of the Rodinia supercontinent.
7. Conclusions
(1) LA-ICP-MS zircon U–Pb dating provided weighted mean 206Pb/238U ages for D1, D2 and D3 of 735 ± 3 Ma, 717 ± 2 Ma and 721 ± 1 Ma, respectively.
(2) Geochemical characteristics reveal that D1 and D2 are an alkaline A-type granite and D3 is a high-K calc-alkaline I-type granite. Sr–Nd–Hf–Pb isotopes show that D2 originated from a mixture of old lower crust and depleted mantle-derived magmas, mainly due to partial melting of the old lower crust. D1 and D3 originated from the old lower crust.
(3) Circa 745–710 Ma magmatic rocks were formed in a continental rift setting, probably related to the underplating of mantle plume-derived magmas.
Author ORCIDs
Wei Chen 0000-0003-2237-8621
Acknowledgements
Constructive comments from two reviewers and guidance from the editor are greatly appreciated. Thanks to the PRS (Proof-Reading-Service.com) for their help in polishing the English language. This research was founded by the National Key R&D Program of China (No. 2017YFC0602404) and the 305 Project of the State Science and Technology Support Program (Grant No. 2011BAB06B04-05).


