INTRODUCTION
Donax is a genus of bivalve molluscs that is commonly found in the swash zone and has a global distribution in tropical and temperate regions. In India, under genus Donax (Family: Donacidae) 10 species (Donax faba, D. cuneatus, D. dussumieri, D. incarnatus, D. spinosus, D. aperittus, D. spiculum, D. scortum, D. lubrica and D. veligers) were reported from coastal areas (Alagarswami, Reference Alagarswami1966; Ansell et al., Reference Ansell, Sivadas, Narayanan and Trevallion1972a, Reference Ansell, Sivadas, Narayanan and Trevallionb; Balasubramanian et al., Reference Balasubramanian, Vijayaraghavan and Kumari1979; Nayar, Reference Nayar1955; Victor & Subramoniam, Reference Victor and Subramoniam1988; Mathew & Menon, Reference Mathew and Menon1992; Zacharia et al., Reference Zacharia, Krishnakumar, Dineshbabu, Vijayakumaran, Rohit, Thomas, Sasikumar, Kaladharan, Durgekar and Mohamed2008; Varadharajan et al., Reference Varadharajan, Soundarapandian, Gunalan and Babu2010). After D. serra (de Villiers, Reference de Villiers1975; Donn, Reference Donn1990; Laudien et al., Reference Laudien, Brey and Arntz2003) and D. deltoides (Willan, Reference Willan, Beesley, Ross and Wells1998), D. scortum is the third largest species of Donax worldwide. The wedge clam, D. scortum occurs abundantly on the surf-beaten sandy beaches along the north (Raghunathan et al., Reference Raghunathan, Tewari, Joshi, Kumar, Trivedi and Khambhat2003), east (Karthikeyan et al., Reference Karthikeyan, Prakash and Ananthan2009; Varadharajan et al., Reference Varadharajan, Soundarapandian, Gunalan and Babu2010) and west (Zacharia et al., Reference Zacharia, Krishnakumar, Dineshbabu, Vijayakumaran, Rohit, Thomas, Sasikumar, Kaladharan, Durgekar and Mohamed2008) coasts of India. Tanyaros (Reference Tanyaros2010) reported that this species tended to accumulate more sand in its body.
The molluscs of economic importance are the bivalves, gastropods and cephalopods, which contribute considerable quantities of seafood, pearls and shells to molluscan fisheries, and these molluscs are utilized mainly by the fishers for subsistence when fish are scarce. Donax scortum is valued as food by fishermen (Nayar, Reference Nayar1955; Prasad & Nair, Reference Prasad and Nair1973; Talikhedkar et al., Reference Talikhedkar, Mane and Nagabhushanam1976). Despite this potential value, little is known of the population dynamics of this wedge clam in Asia. For the management of mollusc resources, knowledge of various population parameters and exploitation level of the population of wedge clams are needed. Throughout the world, bivalve exploitation plays an important role in the national economy of many countries (Vakily, Reference Vakily1992). There are many tools for assessing exploitation levels and population biology of a stock. Of these, FAO-ICLARM Stock Assessment Tools (commonly known as FiSAT) has been used for calculating population parameters of Donax species (Zeichen et al., Reference Zeichen, Agnesi, Mariani, Maccaroni and Ardizzone2002; Cardoso & Veloso, Reference Cardoso and Veloso2003; Singh et al., Reference Singh, Krishnamoorthy and Thippeswamy2011). On the sandy shore of Panambur, Karnataka, Donax species occur in dense populations and during the peak of their breeding seasons, a thick carpeting of clams is a common sight all along the sandy beaches of Karnataka (Thippeswamy, Reference Thippeswamy1985). Several authors have studied some aspects of the population dynamics of Donax species. An investigation has been made on the effect of various physico-chemical parameters on the abundance of wedge clam species in Karnataka coast (Thippeswamy & Joseph, Reference Thippeswamy and Joseph1991). There is, however, no report regarding abundance, biomass, growth, age mortality and exploitation level of D. scortum in India or in other regions of Asia; therefore the objective of the present study was to establish the status of the population of this species to assess the stock.
MATERIALS AND METHODS
At Padukere, the shore consists of compacted fine sand. The majority of the population of D. scortum occurred along the mid intertidal zone. Donax scortum is more abundant on the flatter portions of the beach where the wave wash is more uniform thus providing better conditions for filter-feeding. The largest-sized donacid, D. serra (de Villiers, Reference de Villiers1975; Donn, Reference Donn1990) also occupies the flatter portions of the beach and showed semi-lunar migrations, which are a response by this species to the spring-neap cycle of movement of the water table (Donn et al., Reference Donn, Clarke, McLachlan and du-Toit1986). Live D. scortum clams were collected at monthly intervals for a period of 1 year from February 2009 to December 2010 from the intertidal sandy beach at Padukere (13°20′51.80″N 74°41′30.92″E) near Udupi town (Fig. 1). Donax scortum (from an area of 1 m2) were excavated to 20 cm depth. Sand excavated from each plot was sieved on a 1 mm mesh to collect the clams. Extra clams were also collected from the study area.

Fig. 1. Location of sampling site at wedge clam-growing area along Karnataka coast.
Densities of the species were expressed as number of individuals per metre square, representing those wedge clams retained on a 1 mm mesh sieve. Hand-collected clams were not taken into account in calculating densities. The total weight of clams was recorded and the result was expressed as biomass in g m−2. A total of 2367 individuals was measured for shell length (maximum anterio-posterior distance) using Vernier calipers. For estimating von Bertalanffy growth parameters, asymptotic length (L α) and growth coefficient (K), the length measurements of 1-year data were pooled month-wise and grouped into length classes by 5 mm intervals, and analysed using the ELEFAN (Electronic Length Frequency Analysis) of FiSAT software (Gayanilo et al., Reference Gayanilo, Sparre and Pauly1996). Estimates of L α and K were used to estimate the growth performance index (ø′) (Pauly & Munro, Reference Pauly and Munro1984) of D. scortum using the equation, ø′ = 2log 10 L α + log 10 K. From the values of L α, K and t o the growth curve was fitted to the von Bertalanffy growth equation. Growth was described by the von Bertalanffy growth function (VBGF) (von Bertalanffy, Reference von Bertalanffy1938). The VBGF is defined by the equation, L t = L α [1 − e − K(t–to)], where L t is the length at time t, e is the base of the natural logarithm, t the time of observation and t o is the hypothetical age at which the length is zero (Newman, Reference Newman2002).
Taking into account that non-linear growth functions are difficult to compare, several authors demonstrated the suitability of composite indices for overall growth performance (OGP) for inter- and intra-specific comparisons (Pauly, Reference Pauly1979; Munro & Pauly, Reference Munro and Pauly1983). The OGP is calculated by OGP = log(K[L α]3). The total mortality (Z) was estimated by a length converted catch curve method (Pauly, Reference Pauly1984). The natural mortality coefficient (M) was determined using M ≈ K approximation (Gayanilo & Pauly, Reference Gayanilo and Pauly1997). However, the fishing mortality coefficient (F) was estimated by subtracting M from Z. The exploitation level (E) was obtained from the relationship of Gulland (Reference Gulland and Cushing1965), i.e. E = F/Z = F/F + M. The recruitment pattern was obtained by projecting the length-frequency data backwards on the time axis using growth parameters (Moreau & Cuende, Reference Moreau and Cuende1991).
RESULTS
Temporal variations of population density and biomass
Data on temporal variations in the population density (ind. m−2) are presented in Fig. 2. The values of maximum and minimum densities of D. scortum were 8 ind. m−2 (December) and 2 ind. m−2 (June, July and August) respectively. The average density of clams in the study area was 4 ind. m−2. The maximum and minimum total weights of clams were 185.100 g m−2 (December) and 10.084 g m−2 (August) respectively. Biomass showed an increasing trend from August onwards. The average biomass of D. scortum was 71.088 g m−2 during the study period.

Fig. 2. Density and biomass of D. scortum in the present study.
Growth parameters
Asymptotic length (L α) of the VBGF was 70.88 mm and the growth coefficient (K) was 0.64 year−1 for D. scortum. The growth curve using these parameters is shown over the length-frequency distribution in Fig. 3. The growth performance index (ø′) was found to be 3.51. The range at 95% confidence interval of extreme length (80 mm) was between 65.78 and 71.10 mm. The calculated overall growth performance (OGP) of D. scortum was 5.36.

Fig. 3. Growth curves of D. scortum as superimposed on the length–frequency distribution using ELEFAN-I.
Age and growth
Using the growth parameters, age and growth of Donax scortum were calculated. The growth rate and the absolute increase in age are presented in Fig. 4. It was assumed in the age and growth analysis that the value of the third parameter of the von Bertalanffy growth function was zero (Newman, Reference Newman2002). The sizes attained by D. scortum were 33.51, 51.17, 60.49, 65.40, 67.99 and 69.36 mm at the end of first, second, third, fourth, fifth and sixth years of age, respectively. The average growth rates for D. scortum from first to sixth years were 2.79, 1.47, 0.78, 0.41, 0.22 and 0.11 mm respectively. The lifespan of this species reached up to 6.5 years.

Fig. 4. Plot of age and growth of D. scortum based on computed growth parameters.
Recruitment pattern
Whole recruitment pattern of D. scortum was continuous throughout the year with one major peak in May (Fig. 5). The per cent recruitment varied from 0.24 to 15.63 during the present study. The highest and lowest recruitment per cent were observed in May and November respectively.

Fig. 5. Recruitment pattern of D. scortum.
Mortality and exploitation
The total mortality (Z) was estimated as 3.20 year−1 using the length converted catch curve (Fig. 6). The natural mortality (M) and fishing mortality (F) were 0.64 and 2.56 year−1 respectively. From this figure, the exploitation level (E) of 0.80 was obtained for the D. scortum fishery.

Fig. 6. Mortality estimation of D. scortum using Pauly's linearized length converted catch curve method and estimation of exploitation.
Virtual population analysis
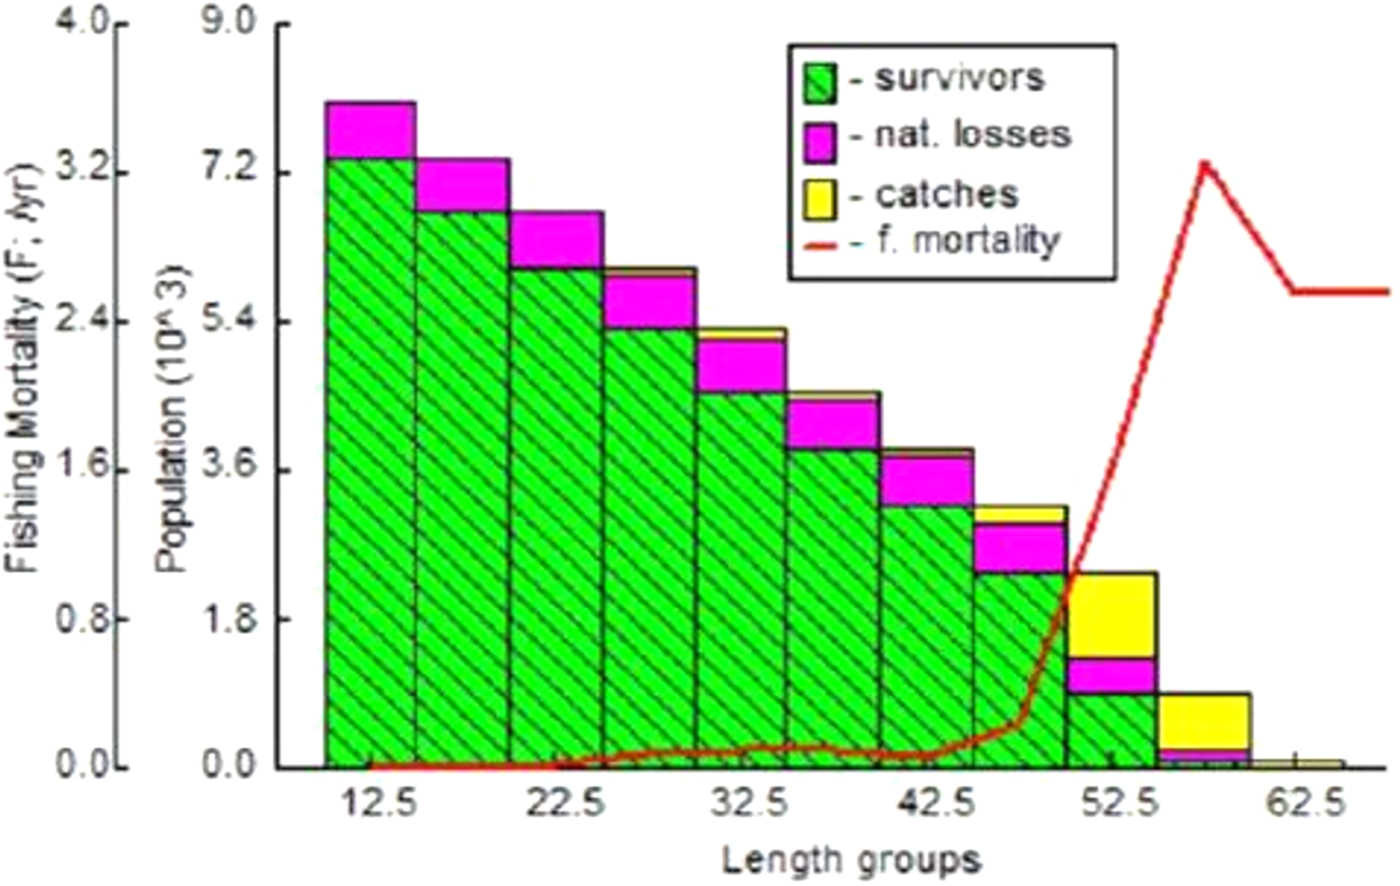
The length structured virtual population analysis of D. scortum is presented in Fig. 7 and indicated that the minimum and maximum fishing mortalities were 0.0010 year−1 and 3.2614 year−1 for the mid lengths of 12.5 and 57.5 mm respectively. The fishing mortality (F) was high over the mid lengths from 47.5 to 57.5 mm.

Fig. 7. Length-structured virtual population analysis of D. scortum.
DISCUSSION
Considerable changes take place in the beach profile along the south-west coast of India due to accretion and erosion during the monsoon period (Ansell et al., Reference Ansell, Sivadas, Narayanan and Trevallion1972a). In the intertidal zone of the sandy beach, juvenile and adult wedge clams appeared, whereas a few adult clams were found in the upper intertidal zone in the study area. The small-sized wedge clam, D. hanleyanus reached the maximum density (2254 ind. m−2) (Marcomini et al., Reference Marcomini, Penchaszadeh, Lòpez and Luzzatto2002). Nayar (Reference Nayar1955) observed a maximum density (5267 ind. m−2) of the wedge clams, D. cuneatus from Palk Bay in the south-east coast of India. A population density of D. faba ranging between 89 and 217 ind. m−2 was reported from the coast of Mandapam (Alagarswami, Reference Alagarswami1966). However, in the present investigation, the lowest density (2 ind. m−2) was recorded during the monsoon season when the sea was rough. The maximum density (8 ind. m−2) of D. scortum was recorded during December followed by March (Fig. 2) in the present study. In contrast, D. incarnatus showed high population densities ranging between 89 ind. m−2 (April) and 39,446 ind. m−2 (January) (Thippeswamy, Reference Thippeswamy1985). Wide ranges of density values for D. denticulatus at different locations have been shown depending partially on environmental factors, such as particulate organic carbon and nitrate (Sastre, Reference Sastre1984). Based on the present data, fluctuations in abundance might have been driven primarily by natural fluctuation in wind, or associated hydrological conditions, during the larval phase. A similar suggestion was also noticed by King (Reference King1985). In one case, Hussain et al. (Reference Hussain, Mohanty, Satpathy and Prasad2010) reported the presence of the Madras Atomic Power Plant affected variation in D. cuneatus populations along Kalpakkam coast, Chennai due to thermal discharge. Victor & Subramoniam (Reference Victor and Subramoniam1988) reported the population density of D. cuneatus from three beaches along the east–west coast of Tamil Nadu. They suggested that beach slope seemed to play a significant role in the distribution and abundance of D. cuneatus among the various environmental parameters. The data on the biomass (total weight) of D. scortum in the present study revealed that the biomass ranged between 10.084 g m−2 (August) and 185.100 g m−2 (December). In contrast, Thippeswamy (Reference Thippeswamy1985) reported that the biomass (total weight) of D. incarnatus varied from 124 g m−2 (October) to 1892 g m−2 (January) in Panambur beach. Thus, the biomass of D. incarnatus (Panambur) was much higher than that of D. scortum (Padukere). The biomass was higher when the large number of young clams settled and lower when large-sized clams were recorded in the present study.
From Table 1, the highest value of L α (82.0 mm) is from Namibia and South Africa (de Villiers, Reference de Villiers1975; Laudien et al., Reference Laudien, Brey and Arntz2003) for Donax serra and the lowest value (18.5 mm) is in Venezuela for D. denticulatus (Vélez et al., Reference Vélez, Venables and Fitzpatrik1985). On the other hand, the highest K value was 1.79 year−1 in Venezuela for D. denticulatus (Marcano et al., Reference Marcano, Prieto, Làrez and Salazar2003) and the lowest value was 0.04 year−1 in India for D. cuneatus (Talikhedkar et al., Reference Talikhedkar, Mane and Nagabhushanam1976). Among the tropical/subtropical Donax species, the D. scortum showed the highest (70.88 mm) value of L α and the K value is very close to Colombia, but quite different from other parts of India (Table 1). The calculated growth performance index (ø′) and overall performance index (OGP) values of D. scortum are higher compared with the values reported from different regions of India. The OGP of this species conforms well with values calculated from data sets of the largest-sized clam, D. serra species found in South Africa and Namibia (de Villiers, Reference de Villiers1975; Laudien et al., Reference Laudien, Brey and Arntz2003) This may be due to the large size of these two species compared with other donacids.
Table 1. Values of the von Bertalanffy growth parameter L α (mm) and K (year–1), ø′ and OGP for several Donax species in comparison with D. scortum. Climate areas are: tropical/subtropical (X), temperate (Y) and upwelling (Z).

a Age estimated from length-frequency distributions.
b Age estimated from hyaline growth rings.
c Age estimated from external growth rings.
d Values calculated on monthly basis from raw data reported by the authors.
Alagarswami (Reference Alagarswami1966) recorded growth of 19.5 mm in D. faba by the end of the first year of life and 22.5 mm at the end of the second year of life from Mandapam. Talikhedkar et al. (Reference Talikhedkar, Mane and Nagabhushanam1976) found that D. cuneatus reached the size of 13–14, 21–22 and 22–23 mm in first, second and third years respectively. The wedge clam, D. cuneatus in Palk Bay along the east coast of India attained a length of 14 mm within 10 months, 19 mm by the second year and after this they died (Nayar, Reference Nayar1955). Nair et al. (Reference Nair, Dalal and Ansari1978) recorded average monthly growth of 2.2 mm for 1 year in D. incarnatus from the sandy beach at Benaulim along the west coast of India. Coe (Reference Coe1955) determined that increase in size in D. gouldi at 1 and 2 years of age averaged about 12 and 18 mm in length, respectively. The lifespan of D. scortum was more than 6.5 years and the growth rate of juvenile clams was rather high during the first few months after settlement. The highest size of clams recorded in the size group of 65–70 mm class interval and maximum size of the clam was about 78 months old (Fig. 4). Thus, the population comprises individuals of more than 1 year in age. Thippeswamy & Joseph (Reference Thippeswamy and Joseph1991) reported that the lifespan of D. incarnatus was above 1 year (less than 15 months) at Panambur. Like D. incarnatus, the small-sized clam, D. denticulatus has a shorter lifespan of 18 months (Marcano et al., Reference Marcano, Prieto, Làrez and Salazar2003), even D. hanleyanus showed a lifespan of about 17 months (Cardoso & Veloso, Reference Cardoso and Veloso2003). In contrast, Marcomini et al. (Reference Marcomini, Penchaszadeh, Lòpez and Luzzatto2002) reported that the lifespan of D. hanleyanus can be up to 3 years. Most wedge clams (Donax spp.) have a relatively short lifespan of 1–2 years (Ansell, Reference Ansell, McLachlan and Erasmus1983; McLachlan, Reference McLachlan1979). But the present study indicates that D. scortum from Karnataka coast with maximum length (69.8 mm) has a longer lifespan of approximately around 7 years. The lifespan of D. scortum was quite different when compared with D. incarnatus (Ansell et al., Reference Ansell, Sivadas, Narayanan and Trevallion1972b; Nair et al., Reference Nair, Dalal and Ansari1978; Thippeswamy & Joseph, Reference Thippeswamy and Joseph1991), D. spiculum (Ansell et al., Reference Ansell, Sivadas, Narayanan and Trevallion1972b), D. cuneatus (Nayar, Reference Nayar1955; Talikhedkar et al., Reference Talikhedkar, Mane and Nagabhushanam1976) and D. faba found along both the east and west coasts of India (Alagarswami, Reference Alagarswami1966; Singh et al., Reference Singh, Krishnamoorthy and Thippeswamy2011).
Thippeswamy & Joseph (Reference Thippeswamy and Joseph1991) observed that recruitment of young wedge clams to the population occurred in several stages due to occurrence of clams of size less than 4 mm in January, May and November indicating a prolonged/staggered breeding period for the population. Tirado & Salas (Reference Tirado and Salas1999) reported continuous and unimodal recruitment during the period of sexual activity. From the findings of Neuberger-Cywiak et al. (Reference Neuberger-Cywiak, Achituv and Mizrahi1990) the recruitment period of Donax trunculus was July–September while several recruitments occurred for D. semistriatus in the sandy beach of Haifa Bay, northern Israel. The density increment observed during pre-monsoon was identified as a recruitment peak of juveniles, which became the dominant age group in the present study. Two recruitments of different intensity were observed during this study and the per cent recruitment varied from 0.24 to 15.63. The highest and lowest per cent recruitment was observed in May and November respectively. For most bivalves, peak recruitment periods are thought to coincide with the spawning patterns of local adults. However, few studies have quantified this. Recruitment patterns may, therefore, be independent of the resident bivalve population and recently settled juveniles may be spatially separated from the remaining parts of the population (McLachlan et al., Reference McLachlan, Dugan, Defoe, Ansell, Hubbard, Jaramillo and Penchaszadeh1996). Recruitment patterns observed in the findings of other studies provide clear evidence that juvenile wedge clams occur only sporadically and recruitment varies between years (Arntz et al., Reference Arntz, Brey, Tarazona and Robles1987; Laudien et al., Reference Laudien, Brey, Arntz and Payne2001; Herrmann et al., Reference Herrmann, Carstensen, Fischer, Laudien, Penchaszadeh and Arntz2009). A unimodal pattern of recruitment was reported (Ansell & Lagardère, Reference Ansell and Lagardère1980; Zeichen et al., Reference Zeichen, Agnesi, Mariani, Maccaroni and Ardizzone2002), whereas a bimodal recruitment is the common pattern observed (Ramón et al., Reference Ramón, Abelló and Richardson1955; Ansell & Bodoy, Reference Ansell, Bodoy, Naylor and Hartnoll1979; Marcano et al., Reference Marcano, Prieto, Làrez and Salazar2003) from different geographic areas. At Padukere also, a bimodal recruitment was found for the D. scortum.
Mortality of the adult clams, D. cuneatus was highest during October–November and June–July, which are preceded by the highest salinity and temperature conditions of the inshore waters respectively (Nayar, Reference Nayar1955). Thippeswamy & Joseph (Reference Thippeswamy and Joseph1991) suggested that mortality occurred due to differences in salinity and grain size of the sandy beach at Panambur. Riascos & Urban (Reference Riascos and Urban2002) reported that the mortality pattern of D. dentifer suggested that the population was selectively affected by El Niño 1997/98, due to smaller individuals inhabiting the lowest areas of the beach, where they are exposed to abnormal seawater conditions. They reported that the total mortality was higher (2.65 year−1) for small individuals (2–5 mm) while a lower value (1.71 year−1) was obtained for larger ones (19–25 mm). In D. denticulatus, García et al. (Reference García, Prieto, Alzola and Lodeiros2003) reported that the total mortality for larger individuals (greater than 22 mm) was high (2.93 year−1). In one case, parasitic interactions and inter-specific interactions generally were shown to play a role in mortality events of molluscs (Dugan et al., Reference Dugan, Jaramillo, Hubbard, Contreras and Duarte2004). Thippeswamy & Joseph (Reference Thippeswamy and Joseph1991) reported that monthly instantaneous total mortality based on the mean size in the sample of whole population varied from 0.1368 (January) to 0.3963 (March) for D. incarnatus. They stated that high mortality rates are due to high sediment temperature, reduced salinity and instability of the sandy beach. Cardoso & Veloso (Reference Cardoso and Veloso2003) reported that the instantaneous mortality rate in D. hanleyanus was 1.70 year−1 in 1998 and 1.55 year−1 in 1999. McLachlan (Reference McLachlan1979) and McLachlan & van der Horst (Reference McLachlan and van der Horst1979), working on D. sordidus on several beaches in South Africa, found similar values of total mortality (1.27 and 1.98 year−1). However, in India, D. incarnatus (Z = 6.24 and 8.72 year−1) (Ansell et al., Reference Ansell, Sivadas, Narayanan and Trevallion1972a) and D. spiculum (Z = 22.67 year−1) (Ansell et al., Reference Ansell, McLusky, Stirling and Trevallion1978) showed higher mortality values. High mortality of D. incarnatus was also observed by McLusky et al. (Reference McLusky, Nair, Stirling and Bhargava1975) from the Indian region. In the present study, the total mortality (3.20 year−1) was lower when compared with the above values found from India. Thus, it can be concluded that the lifespan increases and mortality decreases for Donax species from tropical to temperate regions. High flows from the Murray River were implicated in high mortality of clams on Goolwa beach in October–November 1984 (Clarke, Reference Clarke1985; King, Reference King1985). This may be in accordance with a mortality of D. scortum living near the mouth of the Udyavara River.
The distribution of intertidal clams could be affected by human exploitation. The largest-sized wedge clam is the target of a recreational fishery (McLachlan et al., Reference McLachlan, Dugan, Defoe, Ansell, Hubbard, Jaramillo and Penchaszadeh1996). Clams are exploited for bait and their unique, delicate taste makes them a potentially valuable food resource. Exploitation of D. faba was reported on the Tuticorin harbour beach. These clams were exploited purely for ornamental purposes in the shell craft industry as these shells exhibited multi-hued colours and attractive patterns (Dharmaraj et al., Reference Dharmaraj, Shanmugasundaram and Suja2005). The largest-sized species, D. serra is subject to intensive exploitation by bait dealers and anglers in South Africa (de Villiers, Reference de Villiers1975; McLachlan et al., Reference McLachlan, Dugan, Defoe, Ansell, Hubbard, Jaramillo and Penchaszadeh1996; Laudien et al., Reference Laudien, Brey and Arntz2003). According to Gulland (Reference Gulland and Cushing1965), the yield is optimized when F = M; therefore, when E is more than 0.5, the stock is over-fished. Exploitation level (E) was computed as 0.80, indicating that the fishery of D. scortum in the coastal waters of Karnataka is overexploited.
CONCLUSIONS
The growth and mortality parameters described in the present study can provide important guidelines for fishery management of the wedge clam, D. scortum. The result also shows that the population studied was overexploited. To maintain this valuable resource, the exploitation rate should therefore be reduced below the optimum value.
ACKNOWLEDGEMENTS
The author is grateful to the authorities of Mangalore University (Karnataka) for providing research facilities during research work.
FINANCIAL SUPPORT
The research work was supported by BSR-UGC Meritorious Fellowship (UGC No.4-1/2008(BSR) from University Grant Commission, New Delhi, India.