INTRODUCTION
During the past several decades, a significant decline in soil health has been observed worldwide due to incongruous agricultural practices and land uses (Arshad and Martin, Reference Arshad and Martin2002). This includes excessive and unbalanced inorganic chemical applications, inappropriate tillage, nutrient mining and many other anthropogenic activities (Xiubin et al., Reference Xiubin, Fenli, Chenge and Keli2002). These agricultural management processes are used as supplement or even substitute for biological functions, which distort the natural balance of the ecosystem (Kibblewhite et al., Reference Kibblewhite, Ritz and Swift2008) and lead to deterioration in soil quality. It has now become evident that the development of better yielding varieties and crop diversity for greater food production cannot overcome poor soil quality problems, so that it has now become indispensable to develop methodologies for monitoring soil quality on landscape basis in every area of the world (Smith et al., Reference Smith, Halvorson and Papendick1993). A logical first step towards developing soil quality is to determine the most limiting factors through appropriate assessment techniques.
The concepts of soil quality and soil health are highly contentious within the soil science community (Karlen et al., Reference Karlen, Tomer, Neppel and Cambardella2008). In the literature, both are often used synonymously, but they represent two distinct concepts. Soil quality is related to soil function (Karlen et al., Reference Karlen, Doran, Weinhold and Andrews2003; Letey et al., Reference Letey, Sojka, Upchurch, Cassel, Olson, Payne, Petrie, Price, Reginato, Scott, Smethurst and Triplett2003), whereas soil health represents soil as a finite non-renewable and dynamic living resource (Doran and Zeiss, Reference Doran and Zeiss2000). Soil quality considers those attributes of soil that may be influenced by management practices and have the capability to enhance or diminish the soil health (Curell et al., Reference Curell, Gross and Steinke2012). However, soil health is best preserved as a holistic term describing the overall status of the soil system itself rather than its quality/condition for delivering a service. Moreover, soil health describes the biological integrity of the soil community, i.e. the balance among organisms within the soil and between soil organisms and their environment. In recent years, soil quality has become a major concern in developing countries, where the intensification of production has become widespread. This intensification is raising concerns about the vulnerability of the productive capacity of agro-ecosystems (AESs) caused by deteriorating soil fertility and soil water regimes (Azam et al., Reference Azam, Zoebisch, Wickramarachchi and Ranamukarachchi2009). Research on soil quality has become increasingly important with regard to the assessment of limiting factors (Wilson and Maliszewska-Kordybach, Reference Wilson and Maliszewska-Kordybach2000). Many definitions of soil quality can be found in the literature (Brejda et al., Reference Brejda, Karlen, Smith and Allan2000; Kleinhenz and Bierman Reference Kleinhenz, Bierman and Fischer2001; Singer and Ewing, Reference Singer, Ewing and Sumner2000), but every definition emphasizes on the soil function. This includes the soil's ability to (1) supply nutrients to plants, (2) create an optimum environment for plant growth, (3) promote and sustain crop production, (4) provide habitat to soil organisms, (5) ameliorate environmental pollution, (6) resist degradation and (7) maintain or improve human and animal health (Wang and Gong, Reference Wang and Gong1998). More explicitly, soil quality can be defined as the capacity of a specific kind of soil to function, within natural or managed ecosystem boundaries, to sustain plant and animal productivity, maintain or enhance water and air quality, and support human health and habitation (Karlen et al., Reference Karlen, Mausbach, Doran, Cline, Harris and Schuman1997).
Agriculture is highly dependent on specific climate conditions and agricultural practices such as crop residue burning, puddling, intensive tillage, and use of fertilizer also affect the climate by emitting greenhouse gases (GHGs). Total GHGs emissions from agricultural sources were about 9800–16 900 megatonnes of carbon dioxide equivalent in 2008 (Vermeulen et al., Reference Vermeulen, Campbell and Ingram2012). Small changes in climate have potential impacts on AESs through changes in both temperature and moisture (Venkateswarlu and Shanker, Reference Venkateswarlu and Shanker2009). One possible effect of the climate change is lower or excessive soil water content during critical periods of the growing season. These GHGs affect the soil's physical, chemical and biological attributes, which relate to functional soil processes and can be used to evaluate the soil quality status (Allen et al., Reference Allen, Singh, Dalal and Singh2011). Hence, there is a need for climate-friendly agricultural practices such as conservation agriculture, farming with perennials, organic farming, reduced tillage or rotational grazing, and minimal/judicial use of chemical fertilizers (responsible for nitrous oxide emissions), which not only reduces the GHGs emission from agricultural land but also improves the soil quality.
The increase in crop yield in the last three decades is due to the intensification of cultivation practices, development of high-yielding crop varieties and an increased use of inputs in agriculture such as chemical fertilizers, pesticides, irrigation and mechanization (Kassie and Zikhali, Reference Kassie and Zikhali2009). However, some unintended consequences of this intensification have been (1) an increase in soil erosion, (2) reduction of soil fertility, quality and biodiversity, (3) increased ground water pollution, (4) eutrophication of lakes and rivers, and (5) an increase in greenhouse gases (Matson et al., Reference Matson, Parton, Power and Swift1997). To counter these effects, soil quality has to be improved through appropriate restorative measures, such as improved organic matter management, adoption of conservation tillage, and use of improved crop rotations that include legumes (Karlen et al., Reference Karlen, Wollenhaupt, Erbach, Berry, Swan, Nash and Jordahl1994; Lal, Reference Lal2002). Soil quality assessment is needed to quantify the current degradation status and to evaluate the restoration effects of various cropping systems and other management practices.
Cropping systems imply a specific pattern of crop succession, component crops, and frequency with which all these interact and affect the entire production system (Hegde, Reference Hegde1996). A better understanding of the impact of continuous cropping systems on physical, chemical and biological soil properties is essential for the quantification of soil quality impacts and thereby enhancing the cropping system sustainability (Aparicio and Costa, Reference Aparicio and Costa2007).
An evaluation of individual physical, chemical and biological properties of soil is one of the ways of studying the impact of cropping systems on soil quality. Baseline values of soil properties have been determined in many parts of the world (Richter et al., Reference Richter, Hofmockel, Callaham, Powlson and Smith2007), including Canada (Zentner et al., Reference Zentner, Campbell, Biederbeck, Miller, Selles and Fernandez2001), China (Ding et al., Reference Ding, Meng, Yin, Cai and Zheng2007; Wu et al., Reference Wu, Schoenau, Li, Qian, Malhi, Shi and Xu2004), Denmark (Munkholm et al., Reference Munkholm, Schjønning, Debosz, Jensen and Christensen2002; Schjønning et al., Reference Schjønning, Christensen and Carstensen1994, Reference Schjønning, Iversen, Munkholm, Labouriau and Jacobsen2005), India (Masto et al., Reference Masto, Chhonkar, Singh and Patra2008), New Zealand (Lilburne et al., Reference Lilburne, Hewitt, Sparling and Selvarajah2002; Murata et al., Reference Murata, Nguyen and Goh1995), Nigeria (Oluwatosin et al., Reference Oluwatosin, Adeyolanu, Idowu and Taiwo2008), Sweden (Gerzabek et al., Reference Gerzabek, Haberhauer and Kirchmann2001, Reference Gerzabek, Antil, Kögel-Knabner, Knicker, Kirchmann and Haberhauer2006; Kirchmann et al., Reference Kirchmann, Haberhauer, Kandeler, Sessitsch and Gerzabek2004), Switzerland (Birkhofer et al., Reference Birkhofer, Bezemer, Bloem, Bonkowski, Christensen, Dubois, Ekelund, Fließbach, Gunst, Hedlund, Mäder, Mikola, Robin, Setälä, Tatin-Froux, Van der Putten and Scheu2008; Fließbach et al., Reference Fließbach, Oberholzer, Gunst and Mäder2007) and the United States (Khan et al., Reference Khan, Mulvaney, Ellsworth and Boast2007; Varvel et al., Reference Varvel, Riedell, Deibert, McConkey, Tanaka and Schwartz2006). These studies have shown that the management of inputs, crop rotation and tillage practices can bring changes in the physical, chemical and biological properties of soil (Singer and Ewing, Reference Singer, Ewing and Sumner2000). However, an individual soil property may not be an adequate measure of total soil quality. The status of soil quality could be better reflected by integrating several soil quality indicators – minimum data set (MDS) – into a single index value (Marzaioli et al., Reference Marzaioli, D'Ascoli, Pascale and Rutigliano2010), based on the combination of soil properties (Amacher et al., Reference Amacher, O'Neil and Perry2007). Many workers (Amacher et al., Reference Amacher, O'Neil and Perry2007; Andrews et al., Reference Andrews, Karlen and Mitchell2002; Diack and Stott, Reference Diack, Stott, Stott, Mohtar and Steinhardt2001; Doran and Parkin, Reference Doran, Parkin, Doran, Coleman, Bezdicek and Stewart1994; Glover et al., Reference Glover, Reganold and Andrews2000; Karlen and Stott, Reference Karlen, Stott, Doran, Coleman, Bezdicek and Stewart1994; Karlen et al., Reference Karlen, Tomer, Neppel and Cambardella2008; Larson and Pierce, Reference Larson, Pierce, Doran, Coleman, Bezdicek and Stewart1994; Mohanty et al., Reference Mohanty, Painuli, Misra and Ghosh2007; Sharma et al., Reference Sharma, Mandal, Srnivas, Vittal, Mandal, Grace and Ramesh2005; Zornoza et al., Reference Zornoza, Mataix-Solera, Guerrero, Arcenegui, García-Orenes, Mataix-Beneyto and Morugán2007) have tried to establish various relationships among soil quality indicators, in order to create indices for the characterization of management effects. In continuation to this, the present study was undertaken to (i) determine the MDS for soil quality evaluation for three AESs of India, (ii) evaluate the soil quality under different cropping systems within three AESs in India by developing an SQI. This may help in the selection of an appropriate cropping system for a given environment in terms of its sustainability.
MATERIALS AND METHODS
Site description
Research sites representing three AESs in India (i.e. sub-humid, Pantnagar; semi-arid, Ludhiana; and arid, Hisar) were selected for this study. The geographical coordinates of these sites are Pantnagar (28°97′ N, 79°41′ E), Ludhiana (30°91′ N, 75°85′ E) and Hisar (29°5′ N, 75°45′) with altitudes of 243.3 m, 262 m, 212 m from mean sea level, respectively. The general description of soil characteristics of the study sites is given in Table 1.
Table 1. Description of soil characteristics at the three sites.

Experimental details
Soil samples were collected from three centres of the Project Directorate for Farming System Research (PDFSR) at the above-mentioned locations. For each centre, the sampled cropping systems had been followed for more than ten years. Each crop was grown with normal irrigation practices and recommended fertilizer application under no-stress condition. In rice, puddling was followed, whereas in wheat, conventional tillage was followed. Samples were collected from each treatment (cropping system) at the end of the Rabi season (mid-April to mid-May), i.e. the completion of one cropping cycle, at surface layer, i.e. 0–15 cm, with three replications. The soil samples were analysed for their physical, chemical and biological indicators of soil quality. The cropping systems followed at three locations (AESs) are presented in Table 2.
Table 2. Description of the cropping system at the three sites.

Rice (Oryza sativa), vegetable pea (Pisum sativum), wheat (Triticum aestivum), green gram (Vigna radiata), rapeseed (Brassica napus), mustard (Brassica juncea), potato (Solamum tuberosum), artimesia (Artemisia vulgaris), maize (Zea mays), cotton (Gossypium spp.), African sarson (Brassica carinata), gobhisarson (Brassica napus var. napus), groundnut (Arachis hypogaea), Bajra (Pennisetum americanum), cluster bean (Cyamopsis tetragonoloba), broccoli (Brassica oleracea), onion (Allium cepa), kasni (Cichorium intybus) and cowpea (Vigna unguiculata).
Selection of MDS
Keeping the sustainable agricultural production as the major goal for SQI development, the soil functions considered were water and solute dynamics, physical stability, nutrient cycling and crop growth. In order to characterize the studied soil and to consider the impact of human activities (agricultural) on the study area, soil properties representing, these functions were selected as soil quality indicators. These included four soil physical properties (bulk density, total porosity, mean weight diameter and saturated hydraulic conductivity), seven soil chemical properties (pH, electrical conductivity, organic carbon, available potassium, available phosphorous, nitrate nitrogen and ammonical nitrogen) and two soil biological properties (microbial biomass carbon and dehydrogenase activity). These soil indicator values were experimentally determined for each soil sample. Soil indicator, viz. pH and EC, bulk density (BD), mean weight diameter (MWD), hydraulic conductivity (HC), organic carbon (OC), ammonical (NH4) and nitrate (NO3) nitrogen (N), available phosphorous (P), available potassium (K), dehydrogenase activity and soil microbial biomass (MBC) were determined using 1:2.5 soil–water suspension (Jackson, Reference Jackson1973), core method (Blake and Hartge, Reference Blake, Hartge and Klute1986), wet sieving (Yoder, Reference Yoder1936), constant head (Klute and Dirksen, Reference Klute, Dirksen and Klute1986), chromic acid oxidation (Walkley and Black, Reference Walkley and Black1934), Kjeldahl method (Kjeldahl, Reference Kjeldahl1883), sodium bicarbonate extraction (Olsen et al., Reference Olsen, Cole, Watanabe and Dean1954), ammonium acetate extraction (Hanway and Heidel, Reference Hanway and Heidel1952), Casida method (Casida et al., Reference Casida, Klien and Sohotro1964) and chloroform incubation fumigation method (Alef and Nannipieri, Reference Alef and Nannipieri1995), respectively.
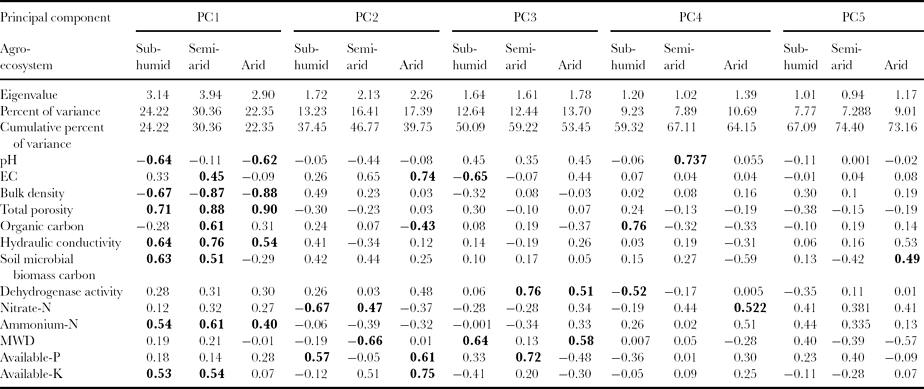
A principal component analysis (PCA) was performed for extracting MDS from measured soil properties. There are many documented strategies for using PCA to select a subset from a large data set (Andrews et al., Reference Andrews, Karlen and Mitchell2002). The idea of the PCA is to reduce the dimensionality of a data set while limiting the loss of information. This is achieved by creating new variables, called principal components (PCs), which are uncorrelated, hold contribution from all the raw variables, and are ordered so that the first few PCs retain most of the variance of the original data set (Armenise et al., Reference Armenise, Redmile-Gorden, Stellacci, Ciccarese and Rubino2013). PCs that received high eigenvalues were assumed to best represent the variation in the system. Therefore, only the PCs with eigenvalues >1 were considered in this study. Under a particular PC, each variable was given a factor loading that represents the contribution of the variable to the composition of the PC. Only the variables with high factor loading were retained from each PC for soil quality indexing (Table 3). When more than one variables were retained under a single PC, a multivariate correlation analysis was employed to determine if some of the highly weighted variables could be considered redundant and, therefore, eliminated from the SQI (Andrews et al., Reference Andrews, Karlen and Mitchell2002). If the highly loaded factors were not correlated (assumed to be correlation coefficient <0.80), then each was considered important and, thus, retained in the SQI. Among well-correlated variables, the one with the highest factor loading (absolute value) was chosen for the SQI.
Table 3. Component matrix of different soil attributes at Pantnagar (sub-humid AES), Ludhiana (semi-arid AES, and Hisar (arid AES).

Boldface factor loadings are consider highly weighted.
Development of SQI
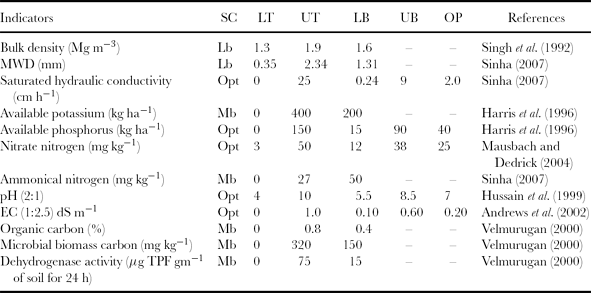
For developing an SQI, first, the raw data of soil quality indicators were transformed into normalized numerical scores ranging from 0 to 1 because different indicators were expressed by different numerical scales. The transformation of an indicator value to a score was achieved with the help of a scoring function (Figure 1). Three types of standardized scoring functions were constructed, namely (1) more is better (upper asymptotic sigmoid curve), (2) less is better (lower asymptotic sigmoid curve) and (3) optimum curve (Gaussian function) (Andrews et al., Reference Andrews, Karlen and Mitchell2002; Karlen and Stott, Reference Karlen, Stott, Doran, Coleman, Bezdicek and Stewart1994). These curves were constructed using Curve Expert v.1.3. The shapes of the curves generated for various indicators were determined by their critical values (Table 4). The critical values include threshold limits and baseline values. Threshold values are soil property values where the score equals one (upper threshold, UT) when the measured soil property is at an optimum level, or equals zero (lower threshold, LT) when the soil property is at a lowest level below which the soil is so much degraded that plant growth almost ceases. Baseline values are soil property values where the scoring function equals 0.50; it may or may not be the mid-points between the two threshold values. The measured values of indicators were transformed to linear and non-linear scores based on linear or non-linear scoring functions.
Table 4. The critical values and scoring functions for soil indicators.

SC: scoring curve; LT: lower threshold; UT: upper threshold; LB: lower baseline; UB: upper baseline; OP: optimum value; Mb: more is better curve; Lb: less is better curve; Opt: optimum curve.
.

Figure 1. Linear and non-linear scoring function of 12 soil quality indicators.
Two types of single-value indices were developed using simple or weighted additive methods of the integration of scores. These are:
Simple soil quality index (SSQI):
 \begin{equation*}
{\rm SSQI} = \frac{1}{n}\sum\limits_{i = 1}^n {S_i } \end{equation*}
 \begin{equation*}
{\rm WSQI} = \frac{1}{n}\sum\limits_{i = 1}^n {W_i * S_i } ,\end{equation*}
\begin{equation*}
{\rm WSQI} = \frac{1}{n}\sum\limits_{i = 1}^n {W_i * S_i } ,\end{equation*}When linear scores are used, the index is either a simple linear index (SLI) or a weighted linear index (WLI). Similarly, with non-linear scores, the indices are termed as either a simple non-linear index (SNLI) or weighted non-linear index (WNLI). For weighted indices, the weights were assigned based on PCA. Each PC explained a certain amount (%) of the variation in the total data set. This percentage, standardized to unity, provided the weight for variables chosen under a given PC (Andrews et al., Reference Andrews, Karlen and Mitchell2002).
Statistical analysis
The coefficient of variation (CV; which explains the variability of soil indicators and SQI) and Duncan multiple-range test (DMRT) for multiple comparisons among treatments were carried out using SPSS statistical packages. Scoring functions generation and transformation of indicator values to scores were done using Curve Expert V 1.3 and PCA were carried out using SAS V 9.1 software.
RESULTS AND DISCUSSION
Result of PCA
Knowledge of soil properties is the key in making agronomic and environmental decisions (Obi et al., Reference Obi, Awonuga and Umeojiakor2010). Variability in soil properties has been observed due to various anthropogenic management practices and the soil-forming factor. Soil properties under all cropping systems for three AESs were separately included for PCA and results show that the first five PCs for Pantnagar, four PCs for Ludhiana and five PCs for Hisar (with eigenvalue >1) were selected for further analysis (Table 3). From the selected PCs, highly weighted variables (loading factor >0.40; Wander and Bollero, Reference Wander and Bollero1999) were selected in the present study. Out of 13 initially selected variables, which were chosen on the basis of soil function, 12 variables were finally selected as MDS after PCA analysis for soil quality assessment. The final PCA-chosen MDS for all three experiment sites are pH, EC, BD, OC, HC, MBC, dehydrogenage activity, nitrate-N, ammonium-N, MWD, available-P, and available-K. Porosity was excluded from this study as it shows high correlation with BD in all AESs (r = 0.81 for Pantnagar, r = 0.92 for Ludhiana and r = 0.95 for Hisar).
Variability of soil indicators due to cropping systems
The variability of soil indicator data due to cropping systems can give valuable insight into the dynamic nature of soil properties within a field's boundary. Management of this variability for improvement in soil quality is worthwhile if the amount is high enough to justify the cost of obtaining the information or if this management could increase profit (Cox et al., Reference Cox, Gerard, Wardlaw and Abshire2003).
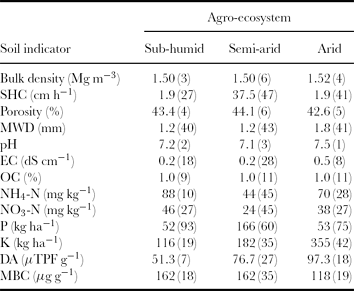
The variability of a soil indicator with respect to eight cropping systems in the sub-humid AES (Pantnagar) was examined based on its CV value, which is an index of assessing variability among treatments. It was found that maximum variability was exhibited by the available-P and minimum variability by pH followed by BD and porosity (less than 10%). All other properties such as HC, mean weight diameter and available-K showed moderately high variability at both the depth layers (Table 5).
Table 5. Experimentally determined soil indicators of the cropping systems at Pantnagar (sub-humid AES), Ludhiana (semi-arid AES), and Hisar (arid AES).

Values in parenthesis indicate coefficient of variation (CV).
In the semi-arid AES (Ludhiana), highest CV was depicted by available phosphorous and lowest variability was shown by pH, followed by porosity and bulk density (less than 10%; Table 5). MWD, nitrate-N and ammonical-N, available-K and MBC showed moderately high variability in this AES. The rest of the indicators showed moderate variability.
In the arid AES (Hisar), the variability of soil indicators for the two soil layers as influenced by cropping systems is shown in Table 5. In the surface layer, the highest variation among all the 13 indicators was observed in available-P and minimum variation was observed in pH followed by BD and porosity (less than 10%). However, available-P, available-K and HC showed high variability. Both forms of nitrogen, i.e. ammonical and nitrate N, were identified to have moderately high variability. The other indicators were moderately variable among the cropping systems.
Under all the three AESs, very low values of CV were observed for both pH and EC. Since the changes in pH of soil are attributed to the parent material and climate under which the soil formation takes place, generally very little changes in pH were observed within an area of few hectares. As in this study, all the plots of various cropping systems were adjacent to each other; so, logically there should not be any variability in pH. Similar observations were reported by Cox et al. (Reference Cox, Gerard, Wardlaw and Abshire2003) and Shukla et al. (Reference Shukla, Lal and Ebinger2004). The low variability in EC may be due to the fact that the soils were non-saline and the quality of irrigation water was good.
The variability of HC among different cropping systems was high (27–47%) under all the AESs. The tillage practices followed for the cultivation of various crops significantly affected the pore size distribution (Dexter and Richard, Reference Dexter and Richard2009); hence, HC showed higher variability. It had also been reported that the HC gets affected by the previous crop cultivated in the field (Aparicio and Costa, Reference Aparicio and Costa2007; Pierret et al., Reference Pierret, Doussan, Capowiez, Bastardie and Pagès2007). Furthermore, macro- and micro-porosity of the soil profile are influenced by the rooting pattern of the previous crop (Lesturgez et al., Reference Lesturgez, Poss, Hartmann, Bourdon, Noble and Ratana-Anupap2004), which causes sufficient variability in HC in surface as well as subsurface soil layers.
The variability in BD under different cropping systems was very low (2.83–6.26%). The data also indicated that there was a non-significant difference in BD variability under the three AESs. This observation is in agreement with findings of Anken et al. (Reference Anken, Weisskopf, Zihlmann, Forrer, Jansa and Perhacova2004), Lampurlanes and Cantero-Martinez (Reference Lampurlanes and Cantero-Martinez2003) and Jabro et al. (Reference Jabro, Sainju, Stevens, Lenssen and Evans2008). As the BD was studied at the end of the Rabi (winter) crop season, the field soil settled to their natural BD and hence the impact of tillage almost got vanished.
The mean value of available-K in the arid region was significantly higher than other regions. Generally, available-K in the soil solution varied from 2 to 5 mg K L−1 for normal agricultural soils of humid regions and was higher than that in arid region soils (Haby et al., Reference Haby, Russelle, Skogley and Westerman1990). In addition to this, arid regions have a large amount of weatherable K-containing minerals. Usually the requirement of K by the crops follows the order: fruit crops > vegetables > pulses and oil seeds > cereals and cropping is more diversified in the arid AES; thus, the variability of available-K in the soil was found to be very high under the arid AES than under other AESs. Under the arid AES, available-K was almost double (686 kg ha−1 in the surface layer and 580 kg ha−1 in the sub-surface layer) in the treatment T4 (cluster bean—broccoli–onion) compared with other cropping systems, where it varied from 234 to 350 kg ha−1. Since onion is not the heavy feeder of potassic fertilizer, it gradually builds up over the years under this cropping system. In the sub-humid AES, all the cropping systems were rice-based systems, in which the average available-K was much lower than those under other two AESs. A study reported by Singh et al. (Reference Singh, Singh, Imas and Xie2004) showed that there was heavy removal of potassium from soil in rice-based cropping systems. The present results also indicated lower CV, exhibiting less variability of K in rice-based systems.
The observations on total OC (%) and MBC showed that variability in MBC was higher than OC under different cropping systems for all AESs. Organic matter is closely related to soil biological properties such as soil MBC and dehydrogenase activity (Kanchikerimath and Singh Reference Kanchikerimath and Singh2001). Soil and crop management practices greatly influence soil biological activity through their effects on the quantity and quality of organic matter added to the soil (Bucher, Reference Bucher2002). The soil systems with the highest organic matter input also tended to have the greatest microbial biomass and activity (Yang et al., Reference Yang, Zhu, Zhang, Yan and Sun2010). The higher variability of MBC than OC could be explained by the fact that since the microbial fraction changes rapidly and these differences are detectable in MBC before they can be measured in total organic matter (Nannipieri et al., Reference Nannipieri, Ascher, Ceccherini, Landi, Pietramellara and Renella2003; Powlson et al., Reference Powlson, Brookes and Christensen1987).
The soil aggregation as represented by MWD was highly influenced by the various cropping systems under the three AESs (CV between 40 and 50%). Since the formation of soil aggregate is influenced by abiotic and biotic factors, soil organic matter plays an important role in the stabilization of soil aggregates (Aparicio and Costa, Reference Aparicio and Costa2007). Quiroga et al. (Reference Quiroga, Buschiazzo and Peinemann1999) reported a strong influence of soil organic matter on changes in mean weight diameter for soils in the semi-arid and humid Pampas. In this study, the variation in organic carbon was less. The variability in the MWD of soils under various cropping systems could be due to the different management practices followed for each cropping system. Another important factor affecting MWD could be the different rooting pattern of each crop, which has also been reported by Six et al. (Reference Six, Bossuyt, Degryze and Denef2004).
The present study showed a high variability of available-P among cropping systems under all AESs (Table 5). Nahas (Reference Nahas, Siqueira, Moreira, Lopes, Guilherme, Faquin, Furtini and Carvalho1999) had reported that legume crops increase the solubilization of phosphorous as a consequence of the soil enrichment by the nitrogen. Root nodules of leguminous crops require adenosine triphosphate (ATP) for fixing the atmospheric nitrogen into ammonical form. To generate ATP, root nodule rhizobia solublize the native insoluble phosphorous into the available form. In this study, out of 25 cropping systems, 13 included leguminous crops where phosphorous solublization was more than the other systems, leading to higher available phosphorous in these cropping systems. This resulted in high variability in available phosphorous among the cropping systems.
The CV of nitrate and ammonical N (Table 5) indicated that the variability was much higher in the non-rice cropping system under the arid and semi-arid AESs than in rice-based systems under the sub-humid AES. Similar variability in nitrate and ammonical-N has been reported by Pettygrove et al. (Reference Pettygrove, Jiayou, Williams, Wick, Hafez and deBoer1990) in rice fields. As the more homogeneous condition of soil water existed under the rice field, the variability of mineral nitrogen is expected to be low compared with the more heterogeneous conditions of soil water under non-rice crop cultivation. This could be the major cause of observed high variability of nitrate- and ammonical-N among all the cropping systems.
Selection of SQI
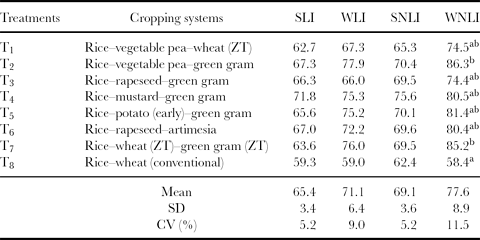
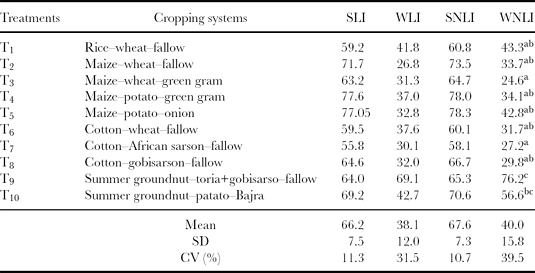
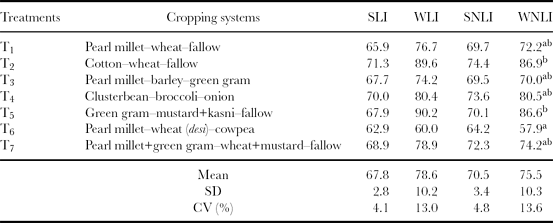
The integration of indicator scores can be achieved by either additive or multiplicative procedures (Ansoms et al., Reference Ansoms, Verdoodt and Van Ranst2010). Andrews and Carroll (Reference Andrews and Carroll2001), Andrews et al. (Reference Andrews, Mitchell, Mancinelli, Karlen, Hartz, Horwath, PettygraveStuart, Saw and Muck2002) and Sinha (Reference Sinha2007) compared several SQIs and found that the additive procedure was superior to the multiplicative procedure. Hence, the additive procedure was followed to compute SQI in this study. The simple (linear and non-linear) indices as well as weighted (linear and non-linear) additive indices were computed from the scored values of indicators are shown in Tables 6–8 along with their mean and CV for all the 25 cropping systems. The sensitivity of these indices was quantified in terms of CV for different cropping systems. The higher value of CV is indicative of higher sensitivity of the index to soil quality, because it shows higher response of the index for the same change in soil quality caused due to given cropping systems. It was found that weighted indices showed higher sensitivity to changes in soil quality than simple additive indices. The tables also indicated that the effects of linear and non-linear scoring methods on the soil quality indices were comparable. However, the WLNI showed highest CV in all the cases; hence, a non-linear weighted additive index was selected for comparing the soil quality under different cropping systems.
Table 6. Soil quality indices for sub-humid (Pantnagar) ecosystem.

Note: Same letters (a, b and c) between the two treatments indicate a non-significant difference. For example, T2 (b) is non-significant with T1 (ab), T3 (ab), T4 (ab), T5 (ab), T7 (b). Furthermore, T2 (b) is significantly different from T8 (a).
SLI: simple linear index; WLI: weighted linear index; SNLI: simple non-linear index; WNLI: weighted non-linear index.
Table 7. Soil quality indices for the semi-arid (Ludhiana) ecosystem.

Note: Superscript letters are as explained in Table 6.
SLI: simple linear index; WLI: weighted linear index; SNLI: simple non-linear index; WNLI: weighted non-linear index.
Table 8. Soil quality indices for the arid (Hisar) ecosystem.

Note: Superscript letters are as explained in Table 6.
SLI: simple linear index; WLI: weighted linear index; SNLI: simple non-linear index; WNLI: weighted non-linear index.
Comparison of soil quality under different cropping systems
In the sub-humid AES, the soil quality index (WLNI) was highest under rice–vegetable–pea–green gram (T2) and was comparable with rice–wheat (ZT)–green gram (ZT) (T7) (Table 6). The inclusion of leguminous crops in cereal-based cropping systems promoted favourable soil chemical indicators (Porpavai et al., Reference Porpavai, Devasenapathy, Siddeswaran and Jayaraj2011) and had beneficial effects on enhancing aggregate stability and other physical properties of soil (Subbian et al., Reference Subbian, Lal and Subramanian2000). Lowest soil quality in this AES was observed in T8 (the conventional rice–wheat system). Traditionally, rice is transplanted after puddling in continuously flooded field and wheat is sown after pulverizing the soil under aerobic conditions, which indicates a divergence in the conventional tillage system for rice and its consequent effects on the soil properties for the succeeding wheat crop (Singh et al., Reference Singh, Sharma, Singh, Singh, Singh, Gill, Jat, Sharma, Malik, Josan and Gupta2005). Soil puddling in rice has several benefits related with yield, weed suppression and resource use efficiency (Farooq et al., Reference Farooq, Basra and Asad2008). However, several studies reported the destructive effects of puddling on soil physical properties for the performance of the subsequent non-rice crop (McDonald et al., Reference McDonald, Rihaa, Duxbury, Steenhuis and Lauren2006). The soil quality under T2 was 32% better than under T8. The cropping systems under T2 and T7 are in the same sub-group and affect the quality of soil in a most beneficial way, whereas the quality was comparable in the T1, T3, T4, T5 and T6 systems and was poorer (low WLNI) in these treatments. This implied that in the sub-humid AES with clay loam soil texture, T2 and T7 maintain better soil quality, which will significantly contribute to the long-term sustainability of yields.
The effects of cropping systems on the quality of soil through SQI in semi-arid AESs of Ludhiana are presented in Table 7. The soil quality was highest in T9 (summer groundnut–toria+gobisarson–fallow system). Groundnut is soil-enriching legume, which fixes nitrogen and solubilizes phosphorus, giving high score values for these properties and resulting in the highest index value. The soil quality under T9 was 68% better than T3 (maize–wheat–green gram). According to DMRT, T1, T2, T4, T5, T6 and T8 are in the low index value sub-group, indicating poorer soil quality than T9 and T10 cropping systems, which are in high index value sub-group, in both the soil layers. This indicated that in the semi-arid AES, T9 and T10 are the most suitable cropping systems for sandy clay loam which maintain better soil health than other cropping systems. The subsurface soil quality in T1, T2, and T3 was poorer by 68%, 68% and 64% than in T9, respectively.
The soil quality was compared under seven cropping systems at Hisar (arid AES) using the weighted non-linear index (WNLI) at the surface layer (Table 8). The maximum value of the index was found under T2 and T5 (cotton–wheat–fallow and green gram–mustard+kasni–fallow). This implied that the soil quality was best under these two cropping systems compared with other cropping systems. The cotton–wheat cropping system on clay loam soil generally does not deteriorate the physical, chemical and biological soil quality indicators’ scores. These systems affect and retain the values of soil quality indicators in the desired range for their best performance except in the case of MWD, MBC and nitrate nitrogen, where the values were outside the desirable range and 10 out of 13 soil indicators remained in the best performing range. Hulugalle et al. (Reference Hulugalle, Weaver and Finlay2006) also reported minimum deterioration in soil properties under the cotton–wheat–fallow system. Similarly, in T5 (green gram–mustard+kasni–fallow), all the scores are either in the higher range or medium range of performance, resulting in good soil quality. The poorest soil quality was under T6 (pearl millet–wheat (desi)–cowpea). This could be due to the fact that this system adversely affected the soil aggregation and MBC. Cowpea is generally used as an erosion resistant crop and promotes the soil aggregation and its stability. As the scoring function for soil aggregate, which is characterized by MWD, is “lower is better” function, the higher MWD values decreased the MWD score and thus decreased the index value. In other cropping systems, the soil quality was moderately good, having an index value of 70 or above. This implied that these cropping systems do not deteriorate the soil quality much. The soil quality under T2 was 33% better than T6. The cropping systems of T1, T3, T4 and T7 are in the low index value sub-group, whereas T2 and T6 cropping systems constituted the high index value sub-group in the surface layer according to DMRT.
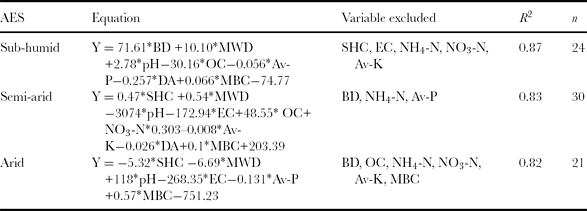
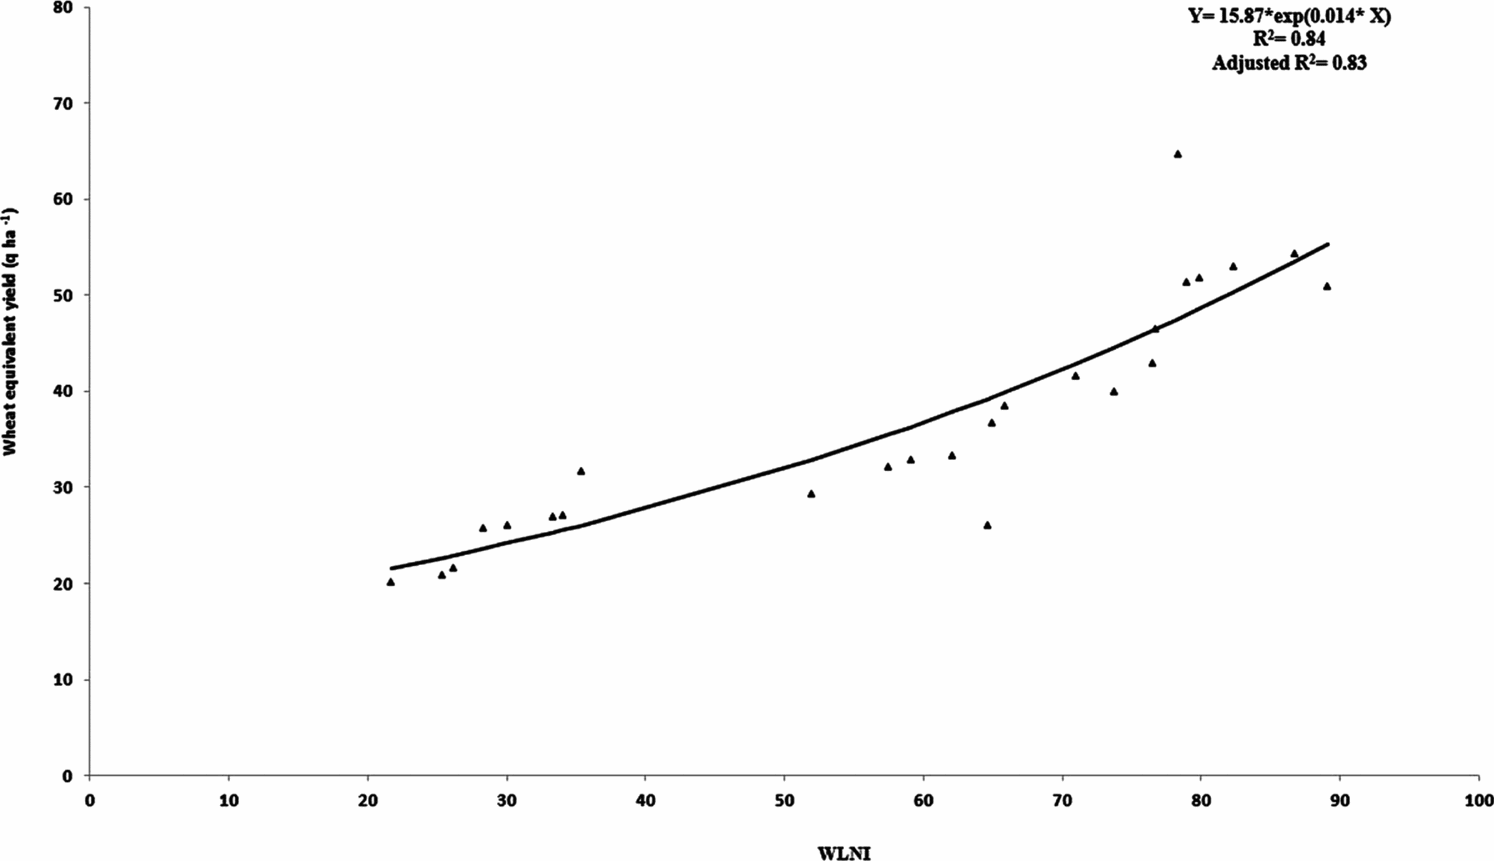
During the recent past, soil quality has received great attention from soil scientists. However, their focus has been on defining the concept of soil quality rather than evaluating soil quality (Fernandes et al., Reference Fernandes, Gamero, Rodrigues and Miras-Avalos2011). Crop productivity is one of the reliable ways to evaluate the soil quality (Mohanty et al., Reference Mohanty, Painuli, Misra and Ghosh2007). In the present investigation, a high and significant (p < 0.01) correlation has been observed between index values and wheat equivalent yield (Figure 2). A positive correlation between index values and yield implies that the index may have utility for quantifying the soil quality under the mentioned cropping systems. Furthermore, stepwise regression analyses were used to explore the relationship between individual indicator and crop yield in all the AESs (Table 9). The results showed that BD, MWD, pH, OC, available-P, DA and MBC were highly correlated with the crop yield in the sub-humid AES, whereas in the semi-arid AES, SHC, MWD, pH, EC, OC, NO3-N, available-K, DA and MBC are the main determinants of crop production. In the arid AES, soil properties such as SHC, MWD, and pH, EC, available-P and MBC have shown high correlation with the crop yield. The high correlation between soil properties and crop yield is indicative of higher influence of these soil properties on crop production than other soil properties in MDS (Table 9). Measuring the MDS of soil indicators and using the WLNI to assess the cropping system may allow producers/farmers to identify the cropping system that improves soil quality, resulting in improved crop yield over time.
Table 9. Stepwise linear regression equation of wheat equivalent yields as a function of soil attributes for AESs.


Figure 2. Correlation of WLNI and wheat equivalent yield for three agro-ecosystems.
CONCLUSION
Soil indicator variability can provide a valuable insight into the dynamic nature of soil properties within the field. The sensitivities of 13 soil indicators were assessed based on their variability among cropping systems in terms of their CV. The higher sensitivity of an indicator influenced the SQI more dominantly. The study showed higher variability of available phosphorous among cropping systems in all AESs. It also indicated that the variability of nitrate and ammonical nitrogen was much higher in the non-rice cropping system under the arid and semi-arid AESs than in rice-based systems under sub-humid AESs. However, bulk density, pH and porosity did not respond to cropping system treatments and remained practically constant under all the AESs. Among all the four SQIs developed, the non-linear weighted index (WNLI) showed maximum response to the cropping system impacts on soil quality changes. Based on WNLI, the rice–pea–green gram (T2) cropping system maintained better soil quality under the sub-humid AES, whereas it was summer groundnut–toria+gobhi sarson–fallow, which showed the highest index value under the semi-arid AES. In the arid AES, cluster bean–broccoli–onion (T4) was comparatively better than others from the quality point of view. This study provides a framework of soil quality quantification based on the variability observed in 13 soil quality indicators across the 25 cropping systems treatments in three AESs and also helps in identifying the better cropping system among the existing cropping systems followed in a particular AES. There is scope of further refinement in proposed indices after investigating the effect of individual soil quality parameter on the productivity of crops under variable agro-climatic situations.


