INTRODUCTION
The volcanic history of Southeast Alaska is very complex. With more than 32 volcanic centers, ranging in age from 6 Ma to <110 yr old (Karl et al., Reference Karl, Baichtal, Calvert and Layer2013), there is still much to learn about eruptive dynamics in this area. This complexity is amplified by the complicated accreted terrane bedrock in the region, which consists of volcanic, sedimentary, carbonate, metamorphic, and intrusive rocks (Gehrels and Berg, Reference Gehrels and Berg1992, Reference Gehrels, Berg, Plafker and Berg1994). The recognition and characterization of tephra deposits can provide regional isochrons as well as insight into magmatic processes (Lowe, Reference Lowe2011). By linking accurately dated tephra deposits with potential source locations, the volcanic history of the region can be pieced together and provide an invaluable tool for geochronological analysis.
Most attention has been focused on the volcanic history surrounding the Mt. Edgecumbe volcanic field (MEVF) (Fig. 1), especially late Pleistocene tephra deposits ranging in age from 14,600 to 13,100 calibrated years before present (cal yr BP) (Riehle et al., Reference Riehle, Mann, Peteet, Engstrom, Brew and Meyer1992; Begét and Motyka, Reference Begét and Motyka1998; Addison et al., Reference Addison, Begét, Ager and Finney2010; Praetorius et al., Reference Praetorius, Mix, Jensen, Froese, Milne, Wolhowe, Addison and Prahl2016). These tephras provide unique geochronological constraints during an important time period, when the Cordilleran Ice Sheet was actively retreating (Taylor et al., Reference Taylor, Hendy and Pak2014), and when human migration is hypothesized to have occurred along coastal Alaska (Lesnek et al., Reference Lesnek, Briner, Lindqvist, Baichtal and Heaton2018). Additionally, the timing of these deposits during deglaciation of the Cordilleran Ice Sheet provides initial clues as to the eruption mechanism, possibly driven by ice sheet retreat itself (Praetorius et al., Reference Praetorius, Mix, Jensen, Froese, Milne, Wolhowe, Addison and Prahl2016). However, there is currently no widely accepted geochronological marker during this important time period in southernmost Southeast Alaska.

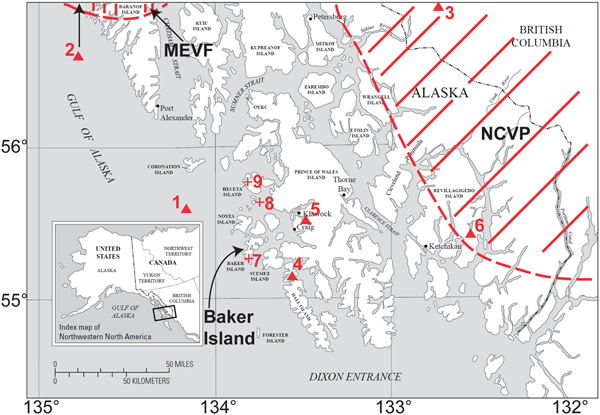
Figure 1. Location of Baker Island in Southeast Alaska's Alexander Archipelago as well as location of volcanic/tephra sites described in text. Mt. Edgecumbe volcanic field (MEVF) and northern Cordilleran volcanic province (NCVP) volcanic regions are shown by dashed red lines. Red triangles represent possible source locations for tephra deposits from Baker Island, Gulf of Esquibel, and Leech Lake. Red crosses represent tephra site locations described in text. (1) Addington vent. (2) Mt. Edgecumbe (20 km north of map boundary). (3) Hoodoo Mountain volcano. (4) Dall Island lava flows. (5) Prince of Wales Island lava flows. (6) Ketchikan lava flows. (7) Baker Island site. (8) Gulf of Esquibel site. (9) Leech Lake site. (For interpretation of the references to color in this figure legend, the reader is referred to the web version of this article.)
South of the MEVF, there is virtually no information regarding late Pleistocene volcanic eruption activity. Karl et al. (Reference Karl, Baichtal, Calvert and Layer2013) provides initial details of lava flows in this region and recognizes them as western components of the northern Cordilleran volcanic province (NCVP) (Fig. 1), but there is no evidence of eruptive activity during the Pleistocene-Holocene deglacial transition. Barron et al. (Reference Barron, Bukry, Dean, Addison and Finney2009) describes tephras found in the Gulf of Esquibel and in Leech Lake on Heceta Island (Fig. 1) that were deposited during this time interval but without interpretations of eruptive history or source location of the tephras. In other words, there is still a critical lack of information about the volcanic history of southernmost Southeast Alaska.
In this article, we report a previously undescribed tephra present in a sediment core from a lake on Baker Island, in southernmost Southeast Alaska (Fig. 1). Accelerator mass spectrometry (AMS) radiocarbon dates of a wood macrofossil and palynomorphs from a horizon 20 cm above the tephra indicate that it was deposited during the late Pleistocene, prior to the onset of the Younger Dryas. Additionally, we provide unreported glass major-oxide geochemistry data from Gulf of Esquibel and Leech Lake to make a robust comparison to the tephra from Baker Island. The tephras presented in this study represent evidence of volcanism in an area that is poorly understood and provide more clues to the hypothesis that deglaciation may have triggered eruptions. Identification of these tephras also provides a much-needed regional marker during the late Pleistocene that will facilitate accurate dating in other records.
MATERIAL AND METHODS
Lake sediment cores were obtained in August 2014 from two sites (BBL4 and BBL6) in an unnamed lake, informally named Bonsai Lake, on Baker Island (55° 16′ 52.44″ N, 133° 38′ 15.21″W; 107 m above sea level) (Figs. 1 and 2). Both BBL4 and BBL6 are composite cores, with BBL4 consisting of six cores, totaling 5.18 m in length and BBL6 consisting of four cores, totaling 3.6 m in length (Fig. 3). Cores were collected from a modular raft using a Livingstone piston corer. The lake is in a granitic basin (Ayuso et al., Reference Ayuso, Karl, Slack, Haeussler, Bittenbender, Wandless, Colvin, Haeussler and Galloway2005) with no potential for a carbonate reservoir effect. The black tephra occurs near the base of both cores, initially identified by a spike in magnetic susceptibility (Fig. 3). The tephra is found immediately above a blue-gray clay interpreted as a glacial deposit (Fig. 3).

Figure 2. (color online) Bathymetric map of Bonsai Lake on Baker Island at 3 m intervals. Elevation contours are provided by the U.S. Geological Survey and are in feet.

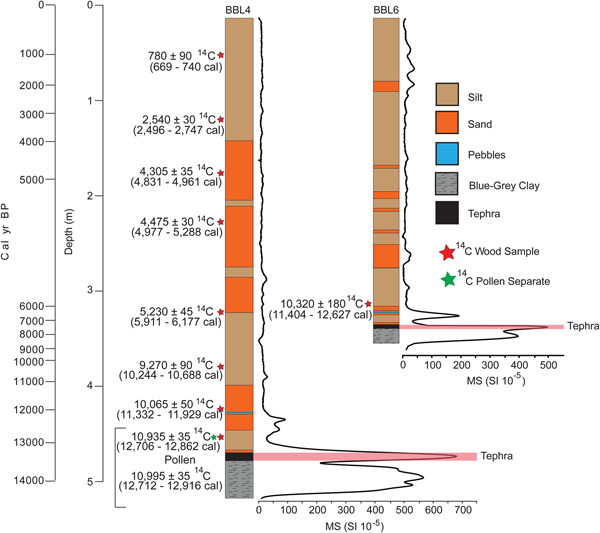
Figure 3. (Color online) Baker Island core stratigraphy with tephra unit highlighted in red, where magnetic susceptibility spikes. Note that at 455 cm, there are both pollen and wood macrofossil accelerator mass spectrometry ages.
Chronology
The chronology of the Baker Island sediment cores is based on radiocarbon dates (Table 1) of one pollen separate and eight wood macrofossils from BBL4 and one wood macrofossil from BBL6. Wood fragments that were selected for radiocarbon dating were cleaned with de-ionized water and submitted to Lawrence Livermore National Laboratory for AMS dating. Processing of the pollen separate followed a procedure modified from Brown et al. (Reference Brown, Nelson, Mathewes, Vogel and Southon1989): sieving with a 250 μm mesh; treatment with 10% HCl, 10% KOH, 48% HF, and 12M H2SO4; and sieving again at 20 μm, resulting in an organic residue consisting primarily of bisaccate pollen. The AMS dating was conducted on an HVEC 10 MV Model FN Tandem Van de Graaff Accelerator. AMS ages were calibrated using the IntCal13 calibration curve via CALIB 7.0 software with a 2σ range (Stuiver and Reimer, Reference Stuiver and Reimer1993; Reimer et al., Reference Reimer, Baillie, Bard, Bayliss, Beck, Blackwell and Ramsey2009). Median calibrated ages were calculated from CALIB 7.0 software. The age of the tephra was determined by extrapolating the age-depth model produced in clam, version 2.2, with 2σ errors (Blaauw, Reference Blaauw2010) (Fig. 4).

Figure 4. (A) Age-depth model fit in the clam package in R (Blaauw, Reference Blaauw2010), based on simple linear interpolation between calibrated ages and extrapolation to a depth of 475 cm, the tephra unit (highlighted in red). (B) Linear sedimentation rates between control points based on age model in panel A. (For interpretation of the references to color in this figure legend, the reader is referred to the web version of this article.)
Table 1. List of radiocarbon ages used for chronology on Baker Island.

Note: LLNL, Lawrence Livermore National Laboratory.
aCalibrated ages and median ages were calculated using 2σ range from CALIB 7.0 software (Stuiver and Reimer, Reference Stuiver and Reimer1993; Reimer et al., Reference Reimer, Baillie, Bard, Bayliss, Beck, Blackwell and Ramsey2009).
Analytical methods
We analyzed tephra particles from three different 1-cm-thick horizons in BBL4 (475.5, 480.5, and 481 cm) for major elemental composition of glass (calculated as oxides) (Fig. 5, Supplementary Table 1). Tephra was extracted from sediment cores and made into thin sections by epoxying the tephra grains to glass mounts and polished to expose grains. VG-2, a basaltic glass from the Juan de Fuca Ridge (Jarosewich et al., Reference Jarosewich, Nelen and Norberg1980), was used as a working standard to test for instrument drift. Compositional analyses of the Baker Island tephra were acquired with a JEOL JXA-8530F field emission electron microprobe (EPMA) at the University of Alaska Fairbanks (UAF) Advanced Instrumentation Laboratory (AIL). Analytical conditions were chosen to minimize Na loss and include a beam energy of 15 keV, a beam current of 6 nA, and a beam diameter of 10 μm. System calibration standards were Scapolite (Meionite), USNM R6600-1 for Cl ka, OR10 CT for K ka, Fe2O3 (Haematite) for Fe ka, Wollastonite (CaSiO3) for Ca ka and Si ka, MgO for Mg ka, Tiburon Albite for Al ka and Na ka, and ilmenite (68ILM) for Ti ka. Each tephra grain was analyzed three times. Mean values for each grain are presented in Table 1. Analyses were conducted with Probe for EPMA version 5.1 (probesoftware.com). Individual data are presented in Supplementary Table 1 in raw form, with analytical totals normalized to 100 wt% on a volatile-free basis.

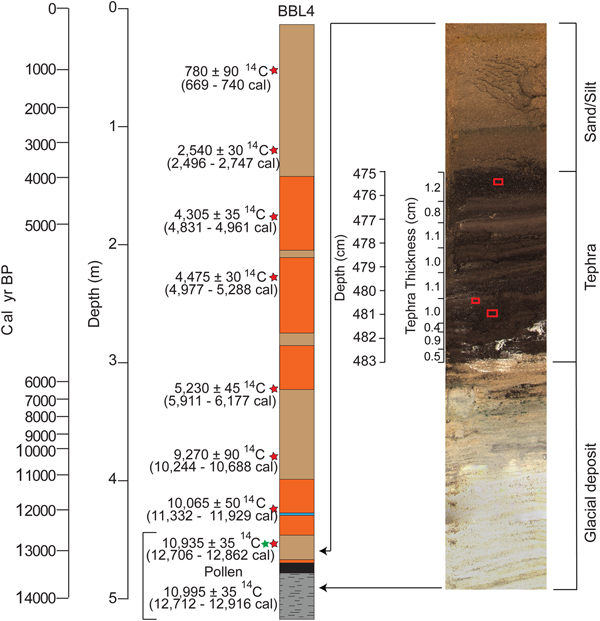
Figure 5. High-resolution photo of sediment core BBL4 from Baker Island at selected depth to highlight abrupt shift from glacial deposit to tephra and abrupt termination of tephra deposition. Tephra thickness on photo of core illustrates the multiple graded beds observed in the tephra. Red boxes indicate sample locations at 475.5 cm, 480.5 cm, and 481 cm. (For interpretation of the references to color in this figure legend, the reader is referred to the web version of this article.)
Reference samples
The Baker Island tephra glass geochemical major oxide compositions are compared against reference samples from adjacent Southeast Alaska locations described in Barron et al. (Reference Barron, Bukry, Dean, Addison and Finney2009). Marine sediment core EW0408-11JC (55° 37′ 36.12″N, 133° 30′ 39.6″W; water depth 183 m; hereafter referred to as 11JC) was recovered from the Gulf of Esquibel, 38 km north of Baker Island (Fig. 1). This core contains a 4-cm-thick black tephra located between 1295 and 1298 cm below seafloor that was sampled at 1-cm-thick intervals. A sediment core from Leech Lake on nearby Heceta Island (55° 45′ 25.2″N, 133° 37′ 40.8″W; Fig. 1) contains a 5-cm-thick black tephra that was homogenized during sampling. The grain size of the black tephra in both the 11JC and Leech Lake sediment cores is coarse sand. Both tephras have sharp lower contacts and diffuse upper contacts, suggesting these deposits are primary tephra-fall deposits. Samples from the 11JC and Leech Lake tephras were prepared for EPMA analysis following the procedures described in Addison et al. (Reference Addison, Begét, Ager and Finney2010). Major-oxide glass geochemistry was analyzed in 2006 using a Cameca SX-50 microprobe at the UAF-AIL facility. Individual data are presented in Supplementary Table 1 in raw form.
Compositional and statistical analysis
Tephra samples were initially classified according to the International Union of Geological Sciences total alkali-silica (TAS) classification system (Le Bas et al., Reference Le Bas, Le Maitre, Streckeisen and Zanettin1986) (Fig. 6). The EPMA major-oxide compositions of the Baker Island tephra were then compared to the 11JC and Leech Lake tephra compositions using three different multivariate statistical techniques. The SIMAN similarity coefficient (Borchardt et al., Reference Borchardt, Aruscavage and Millard1972) is widely used for tephra comparisons, and here we implement the error-weighted version of Borchardt (Reference Borchardt1974) that incorporates both population means and standard deviations from the EPMA analysis. For all SIMAN calculations, the user-defined ERLEV function was minimized on a sample-to-sample basis to reduce the weight of oxide measurements that had large relative standard deviations (e.g., Cl). Natural-log-transformed oxide concentrations of individual shard compositions (Aitchison, Reference Aitchison1982) were then compared using both hierarchical cluster analysis (HCA) and canonical discriminant function analysis (DFA) implemented in IBM SPSS Statistics v.24. The HCA was calculated using Ward's minimum linkage method with Euclidean distances and Z-score normalization following the practice of Preece et al. (Reference Preece, Westgate, Stemper and Péwé1999). For the DFA technique, three a priori groups were established using the SIMAN coefficient results and then were analyzed using the Mahalanobis distance method (Shane and Froggatt, Reference Shane and Froggatt1994) with step-wise inclusion of variables.

Figure 6. (color online) (A) Total alkali-silica (TAS) of tephra from Baker Island, Gulf of Esquibel, Leech Lake, and Mt. Edgecumbe, as well as whole rock geochemistry from samples from the Addington volcanic field. (B) Zoomed-in frame of TAS plot. (C) CaO wt% versus FeOt wt% of Baker Island tephra and tephra from Gulf of Esquibel, Leech Lake, Mt. Edgecumbe, and Addington volcanic field.
Grain size and imaging
Grain-size analyses were conducted on samples of the Baker Island tephra from BBL4 at 475.5 cm and 476 cm (Fig. 5) using a Beckman Coulter Counter LS 320 and classified based on the Wentworth grain-size scale (Wentworth, Reference Wentworth1922). Samples were added directly to the Beckman Coulter Counter with no defloculating agents. Grains of tephra from 480.5 cm in BBL4 (Fig. 5) were mounted on a sample stub and imaged on a FEI Quanta 200 Environmental Scanning Electron Microscope (SEM).
RESULTS
In the core from site BBL4, the Baker Island tephra is 8 cm thick (475–483 cm) (Fig. 5). In the core from site BBL6 the tephra is 4 cm thick (320–324cm) (Fig. 3). The 8-cm-thick tephra is composed of nine distinct, normally graded beds that range from 0.4 cm to 1.2 cm thick (Fig. 5). Median grain sizes within these beds range from medium silt to very fine sand (25 μm to 120 μm) in gray- and black-colored beds, respectively. Extrapolation from the lowermost dated macrofossil (12,790 ± 78 cal yr BP at 455 cm) to the upper contact of the tephra at 475 cm using the age-depth model produced in clam results in an age of 13,492 ± 237 cal yr BP (Fig. 4) for the Baker Island tephra.
Major-oxide glass geochemistry results indicate that the Baker Island tephra composition varies from tephrite to trachybasalt and basalt, with most results falling in the trachybasalt range (Fig. 6, Table 2). Tephra compositions from the 11JC from Gulf of Esquibel and Leech Lake reference samples also range between tephrite, trachybasalt, and basalt (Fig. 6). SEM images of the Baker Island tephra show angular, moderately vesicular to vesicular fragments, with microlites in the glassy matrix (Fig. 7).

Figure 7. Scanning electron microscope image of Baker Island tephra from 480.5 cm revealing angular, vesicular fragments.
Table 2. Tephra compositions from Baker Island, Leech Lake, and Gulf of Esquibel. Total number (n) of glass shards analyzed for each tephra sample is shown. Mean and estimated error to 1 standard deviation are shown for each sample. All data are normalized to 100 wt% on a water-free basis. Water content is calculated by difference from analytical total. Total iron oxide concentration is expressed as FeO. Individual analyses are contained in Supplementary Table 1. International Union of Geological Sciences (IUGS) classification according to Le Bas et al. (1986).

DISCUSSION
Potential source locations
Potential source locations of the Baker Island tephra are from the MEVF, the NCVP, volcanic vents near Baker Island, and the Addington volcanic field (AVF). Widespread distal ash beds of the Cascades, Wrangells, and Aleutians are not a potential source as there are no known basaltic tephras from these eruptions that are within the age range of this study (Riehle et al., Reference Riehle, Mann, Peteet, Engstrom, Brew and Meyer1992; Clague et al., Reference Clague, Evans, Rampton and Woodsworth1995; Fierstein and Hildreth, Reference Fierstein and Hildreth2001).
Postglacial tephra deposits from the MEVF near Sitka, Alaska (Fig. 1), have been well studied in both terrestrial and marine environments (Riehle et al., Reference Riehle, Mann, Peteet, Engstrom, Brew and Meyer1992; Begét and Motyka, Reference Begét and Motyka1998; Addison et al., Reference Addison, Begét, Ager and Finney2010; Praetorius et al., Reference Praetorius, Mix, Jensen, Froese, Milne, Wolhowe, Addison and Prahl2016). At least 12 postglacial tephra deposits have been identified from the MEVF with compositions ranging from basalt to rhyolite (Praetorius et al., Reference Praetorius, Mix, Jensen, Froese, Milne, Wolhowe, Addison and Prahl2016) and thereby represent a potential source for the Baker Island tephra. Older basaltic tephras of the MEVF (14,600–14,000 cal yr BP; Fig. 6) have low silica contents similar to the Baker Island tephra but contain ~1–2% less alkali and lower FeO concentrations than the Baker Island tephra (Fig. 6). Therefore, older MEVF tephras are not geochemically correlative with the Baker Island tephra. Younger MEVF tephras, such as the well-dated MEd dacitic tephra at 13,130 ± 90 cal yr BP (Begét and Motyka, Reference Begét and Motyka1998), have higher silica compositions (Fig. 6). Thus, these tephras are also not compositionally correlative to the Baker Island trachybasaltic tephra. Furthermore, the Baker Island tephra lies 200 km south of the documented limit of fallout from the MEd dacitic eruption, the largest known MEVF late Pleistocene eruption (Riehle et al., Reference Riehle, Mann, Peteet, Engstrom, Brew and Meyer1992; Begét and Motyka, Reference Begét and Motyka1998). Therefore, we conclude that the MEd and Baker Island tephras are the product of separate volcanic sources.
The NCVP (Fig. 1) comprises more than 100 mapped occurrences of volcanic rocks within northwestern British Columbia, producing phonolitic-trachytic-basaltic material (Edwards and Russell, Reference Edwards and Russell2000), and therefore represents another potential source for the Baker Island tephra. A more specific candidate for a source within the NCVP is the Hoodoo Mountain volcano, located 220 km northeast of Baker Island (Fig. 1). Eruptive material from Hoodoo Mountain volcano was produced between 9000 and 28,000 cal yr BP, which is within the time frame of the Baker Island tephra but ranges between phonolitic and trachytic compositions and therefore is not consistent with the trachybasalt found on Baker Island. Furthermore, the Hoodoo Mountain volcano deposits during this period have only been identified to the north, northwestern, and southeast directions from Hoodoo Mountain (Edwards et al., Reference Edwards, Russell and Anderson2002), which are in opposing directions to Baker Island.
Dated lava flows from volcanic vents near Baker Island were also evaluated to determine whether they are correlative with the Baker Island tephra. Basalt flows from western Prince of Wales Island, 20 km east of Baker Island; Dall Island, 32 km south of Baker Island; and near Ketchikan,122 km east of Baker Island (Fig. 1), yield 40Ar/39Ar ages of 21.5 ± 3.8, 6.7 ± 3.3, and 42–44 ka, respectively (Karl et al., Reference Karl, Baichtal, Calvert and Layer2013). Despite the large errors associated with the 40Ar/39Ar dates, these ages lie well outside the timing of the Baker Island tephra at 13,492 ± 237 cal yr BP and thus do not appear to be correlative with the Baker Island tephra.
The AVF (Greene et al., Reference Greene, O'Connell and Brylinsky2011), located 38 km west of Baker Island (Fig. 1), is another potential source. High-resolution multibeam seafloor surveys of the continental shelf west of Baker Island reveal a well-defined depression (possibly a volcanic crater) at a depth of ~74 m (Greene et al., Reference Greene, O'Connell and Brylinsky2011). As no dates are available from the AVF, a direct correlation with the Baker Island tephra cannot currently be tested. However, two rock samples collected from the crater from Delta submersible dives 6515 and 6516 and analyzed for whole-rock geochemistry reveal mugearite and basalt compositions, respectively (Fig. 6, Supplementary Table 1) (Greene et al., Reference Greene, O'Connell and Brylinsky2011; Clague, D., personal communication, 2018). The geochemistry is therefore broadly similar geochemistry to the Baker Island tephra.
Morphology of grains from the Baker Island tephra (Fig. 7) is indicative of a subaerial eruption, rather than from an underwater source (Liu et al., Reference Liu, Oliva, Antoniades, Giralt, Granados, Pla-Rabes, Toro and Geyer2016). The abundance of microlite-rich grains with vesicles indicates slow ascent (allowing time for crystallization, bubble growth, and coalescence) or rapid ascent accompanied by a period of arrest and cooling at shallow depths prior to eruption (Cashman and Blundy, Reference Cashman and Blundy2000). However, these data do not rule out the AVF as a potential source. An eruption at 13,492 ± 237 cal yr BP would have likely been subaerial because of its timing during maximum glacial forebulge development, when regional sea level was as much as 165 m below present (Hetherington et al., Reference Hetherington, Barrie, Reid, MacLeod, Smith, James and Kung2003; Baichtal and Carlson, Reference Baichtal and Carlson2010). Further evidence of lower regional sea level is found in marine sediment core EW0408-11JC in the Gulf of Esquibel (Fig. 1). The marine core records a diatom assemblage shift from brackish to full marine conditions prior to ~11,500 cal yr BP (Barron et al., Reference Barron, Bukry, Dean, Addison and Finney2009), and because this transition requires lowered sea level and/or vertical relief change to limit the Pacific Ocean connection to the Gulf of Esquibel, it suggests subaerial conditions may have been present at the AVF during the late Pleistocene. The AVF, therefore, is a potential candidate source for the Baker Island tephra.
Correlation to regional tephras with unknown sources
Black tephras of similar age from the Gulf of Esquibel (38 km north of Baker Island) and Leech Lake on Heceta Island (15 km to the northwest of the Gulf of Esquibel) (Fig. 1) are geochemically similar (Barron et al., Reference Barron, Bukry, Dean, Addison and Finney2009) and potentially correlative with the Baker Island tephra. The tephras from Leech Lake and the uppermost Gulf of Esquibel (1295 cm) have a tephrite composition, and Gulf of Esquibel samples between 1296 and 1298 cm have a hawaiite (trachybasalt) composition (Fig. 6, Table 2). The range of compositions exhibited by the Leech Lake and Gulf of Esquibel tephras is thus comparable to that of the Baker Island tephra. However, the Baker Island tephra has slightly more silica (~1–2%) compared with the tephras from Leech Lake and the Gulf of Esquibel (Fig. 6, Table 2).
Multivariate statistical comparisons of the geochemical composition of the Baker Island tephra and that of the two basaltic tephras from Leech Lake and the Gulf of Esquibel indicate less relationship between these units than from the TAS comparison. Samples from Baker Island have high SIMAN similarity coefficient values with one another (>0.95; Table 3), but not with any of the Leech Lake or Gulf of Esquibel tephra samples. The uppermost Gulf of Esquibel sample (1295 cm) has a very high SIMAN coefficient value (>0.98) with the Leech Lake sample, whereas the remainder of the Gulf of Esquibel samples (1296–1298 cm) have high SIMAN values only with one another (>0.96).
Table 3. (color online) SIMAN similarity coefficient analysis (Borchardt et al., Reference Borchardt, Aruscavage and Millard1972; Borchardt, Reference Borchardt1974). Bold numbers have high SIMAN similarity coefficients and shaded blue, yellow, and orange values highlight correlations found in or between tephra units from Baker Island (BIT), Leech Lake (NFA), and the Gulf of Esquibel (NFA and GoE).

aHierarchical cluster analysis (HCA) identified three subpopulations.
bCompared against HCA population 2.
HCA clusters of the individual major oxides from the tephra shards in the Baker Island, Leech Lake, and Gulf of Esquibel samples show three major groups that closely correspond with those identified by the SIMAN analysis (Supplementary Fig. 1), although 14 shards from the Baker Island samples are grouped with Leech Lake/Gulf of Esquibel samples. Similarly, DFA results show distinct clusters with little overlap between the Baker Island and Leech Lake/Gulf of Esquibel groups, corroborating the SIMAN coefficients (Fig. 8).

Figure 8. (color online) Multivariate statistical comparison of BIT, NFA, and GoE tephras from Southeast Alaska.
Applying HCA to the glass shard geochemical populations within the Baker Island tephra sample from 475.5 cm reveals two chemical subpopulations that can be distinguished based on minor differences in the Na2O + K2O content (high-alkali population 1 = 5.71 ± 0.30 wt%; low-alkali population 2 = 5.25 ± 0.30 wt%). Comparison of the mean oxide compositions for these two subpopulations against the full set of samples and reference compositions described herein finds that (i) population 2 has very high SIMAN values with the other Baker Island tephra samples (>0.97); and (ii) population 1 has slightly lower SIMAN values with the other Baker Island tephra samples (0.94–0.96), but it also has high SIMAN coefficient values (0.93–0.94) with the Leech Lake/Gulf of Esquibel samples. Despite its greater geochemical heterogeneity, these differences are not sufficient to distinguish the 475.5 cm sample from the other Baker Island tephra samples.
In summary, we conclude that the samples from Baker Island were derived from a single, distinct eruptive event. The resulting tephra is provisionally named the Baker Island tephra (BIT) until the source vent is discovered and a formal name can be established. Samples from lowermost tephra (1296–1298 cm depth) in the Gulf of Esquibel represent a separate eruptive event and will provisionally be known as the GoE tephra. The sample from Leech Lake is geochemically correlative with the uppermost Gulf of Esquibel sample at 1295 cm. These two samples represent the first regional occurrence of a basaltic tephra in the southernmost sector of Southeast Alaska; this tephra is provisionally named the NFA tephra.
The NFA tephra is the result of an eruptive event that took place approximately 14,609 ± 343 cal yr BP based on the age of pollen residue directly overlying the tephra in Leech Lake (Barron et al., Reference Barron, Bukry, Dean, Addison and Finney2009). This is considerably older (~1100 yr) than the BIT, which dates to 13,492 ± 237 cal yr BP. The radiocarbon age of the GoE tephra is unknown. Barron et al. (Reference Barron, Bukry, Dean, Addison and Finney2009) argue that it likely has the same age as the NFA tephra based on similar geochemistry. However, our analyses identify significant geochemical differences between the NFA and GoE tephras (the lowermost tephra from the Gulf of Esquibel). Given that the NFA tephra immediately overlies the GoE tephra in the Gulf of Esquibel core, the GoE tephra may have been deposited by the same eruptive event that deposited the NFA tephra.
Relative to the BIT, the NFA tephra appears to be the product of an older eruption from one of the numerous volcanic vents in the region, potentially the same vent as the younger BIT. Given Heceta Island's limestone geology (Soja, Reference Soja1990), the older age of the NFA could be attributed to a reservoir effect, but statistical analyses (Fig. 8) support the conclusion that the BIT, NFA, and GoE tephras are products of separate eruptions.
Possible eruption mechanism
Proximity of the Mt. Edgecumbe MEd, GoE, NFA, and BIT tephras in both time and space may indicate a shared eruptive trigger. Based on the coeval onset of Bølling-Allerød interstadial warmth, disappearance of ice-rafted detritus, and rapid vertical land motion associated with regional isostatic rebound, Praetorius et al. (Reference Praetorius, Mix, Jensen, Froese, Milne, Wolhowe, Addison and Prahl2016) hypothesize that ice sheet deterioration is responsible for volcanic activity at Mt. Edgecumbe. Ice sheet retreat may thus have promoted regional volcanism through decompression melting in the shallow mantle or a reduction in crustal magma storage time (Praetorius et al., Reference Praetorius, Mix, Jensen, Froese, Milne, Wolhowe, Addison and Prahl2016). The BIT overlies a blue-gray clay interpreted as a glacial deposit (Fig. 5), supporting a causal relationship between ice sheet deterioration and the onset of volcanism. The hypothesis that rapid unloading of the crust resulted in isostatic rebound and increased volcanic activity (Praetorius et al., Reference Praetorius, Mix, Jensen, Froese, Milne, Wolhowe, Addison and Prahl2016) is further supported by evidence for a regional glacial forebulge in Southeast Alaska. Based on shell-bearing raised marine deposits (Baichtal and Carlson, Reference Baichtal and Carlson2010), estimates of minimum uplift on this forebulge between 16,700 and 11,100 cal yr BP range from 45 to 60 m. The BIT (13,492 ± 237 cal yr BP),and the NFA tephra (14,609 ± 343 cal yr BP)were deposited during this time. The GoE tephra was also likely deposited during this time.
CONCLUSIONS
The BIT, NFA, and GoE are new tephro-chronological markers in late Pleistocene deposits in Southeast Alaska. Although similar in age to the widespread MEd of Mt. Edgecumbe, the BIT, NFA, and GoE tephras are geochemically distinct from MEd and are found 200 km south of the known extent of MEd. The Addington volcanic field is considered a potential source for the BIT, NFA, and GoE tephras, but additional samples from the submerged field must be collected and analyzed in order to test this hypothesis.
Regardless of source, similarity in the timing of the Mt. Edgecumbe eruption and the event that produced the BIT, NFA, and GoE tephras suggests that these eruptions share a trigger. The hypothesis that ice sheet retreat promoted regional volcanism (Praetorius et al., Reference Praetorius, Mix, Jensen, Froese, Milne, Wolhowe, Addison and Prahl2016) is supported by the Baker Island stratigraphy, which indicates that deglaciation immediately preceded deposition of the BIT.
ACKNOWLEDGMENTS
Research reported in this manuscript was supported by the National Geographic Society Committee for Research and Exploration Award Number 9541–14 and the National Institute of General Medical Sciences of the National Institutes of Health under Award Numbers UL1GM118991, TL4GM118992, and RL5GM118990. JA was supported by the U.S. Geological Survey Land Change Science Program. The content is solely the responsibility of the authors and does not necessarily represent the official views of the National Institutes of Health. The authors gratefully acknowledge use of the UAF-AIL electron microprobe acquired with support from the National Science Foundation, Major Research Instrumentation Program Award Number 1126898. The authors thank the Tongass National Forest for logistical support and Dr. Tom Ager for providing invaluable insight on proposals and manuscripts. The authors also thank David Clague for providing geochemical data from the Addington volcanic field. Reviews by associate editor Peter Langdon, Takehiko Suzuki, Kristi Wallace, and an anonymous reviewer greatly improved this manuscript. Any use of trade, firm, or product names is for descriptive purposes only and does not imply endorsement by the U.S. Government.
SUPPLEMENTARY MATERIAL
The supplementary material for this article can be found at https://doi.org/10.1017/qua.2018.154