


Introduction
Five centuries ago, the first European mariners rounding the Cape of Good Hope encountered Khoekhoe-speaking people who occasionally supplied beef and mutton in return for iron, tobacco, alcohol and other exotic goods. The origin of their livestock, as well as of the Khoekhoen themselves, continues to intrigue academics. We now know that the first livestock were introduced over 2000 years ago (Robbins et al. Reference Robbins, Campbell, Murphy, Brook, Srivastava and Badenhorst2005; Pleurdeau et al. Reference Pleurdeau, Imalwa, Détroit, Lesur, Veldman, Bahain and Marais2012; Bousman et al. Reference Bousman, Mauldin, Zoppi, Higham, Scott and Brink2016; Scott & Plug Reference Scott and Plug2016). The presence of Y-chromosome E3b1f-M293 and lactase persistence allele −14010*C among the Khwe (Kxoe) and the Nama of Namibia indicate that some contemporary Khoe-speakers are distantly related through the male lineage to pastoralists in East Africa (Henn et al. Reference Henn, Gignoux, Lin, Oefner, Shen, Scozzari, Cruciani, Tishkoff, Mountain and Underhill2008; Barbieri et al. Reference Barbieri, Güldemann, Naumann, Gerlach, Berthold, Nakagawa, Mpoloka, Stoneking and Pakendorf2014; Macholdt et al. Reference Macholdt, Lede, Barbieri, Mpoloka, Chen, Slatkin, Pakendorf and Stoneking2014), a conclusion that is supported by linguists who locate the origins of proto-Khoe languages in that part of the continent (e.g. Güldemann Reference Güldemann2008). It remains unclear, however, whether the earliest livestock in southern Africa arrived with immigrant Khoe-speakers, or whether the Khoe-speakers arrived later: the first livestock may have been traded down the line or otherwise infiltrated among southern African San hunter-gatherers (e.g. Sadr 2015).
The relationship between subsistence economies, genetics and languages is complex. At the scale of language families, and at smaller scales in certain parts of the world such as in Europe, the boundaries between languages and populations match well (e.g. Cavalli-Sforza et al. Reference Cavalli-Sforza, Piazza, Menozzi and Mountain1988; Barbujani & Sokal Reference Barbujani and Sokal1990). In other parts, such as in the Americas and Melanesia, linguistic differentiation is more evident than biological differentiation (e.g. Ward et al. Reference Ward, Redd, Valencia, Frazier and Pääbo1993; Hunley et al. Reference Hunley, Dunn, Lindström, Reesink, Terrill, Healy, Koki, Friedlaender and Friedlaender2008). In Africa, genetic variation is structured geographically and, to a lesser extent, linguistically, while languages and economies show little correlation (Scheinfeldt et al. Reference Scheinfeldt, Soi and Tishkoff2010; Uren et al. Reference Uren, Kim, Martin, Bobo, Gignoux, Van Helden, Möller, Hoal and Henn2016). Here, one cannot assume that languages, genes and innovations in subsistence, such as livestock herding, spread together in a package (Sagart et al. Reference Sagart, Blench, Sanchez-Mazas, Blench, Sagart and Sanchez-Mazas2005). There are many factors that influence how quickly and successfully an innovation spreads among individuals and communities (Rogers Reference Rogers2003). Such complexities may account for the mosaic of subsistence practices and linguistic and cultural groups in East Africa (Russell & Lander Reference Russell and Lander2015). Furthermore, populations entering new areas must go through a landscape-learning process that can alter their cultural practices (Rockman Reference Rockman, Rockman and Steele2003). Considering the difficulty of clearly distinguishing migration from diffusion in the archaeological record, we have to accept that in southernmost Africa we may never definitively be able to associate Khoe genes and languages with a particular archaeological material signature. Nevertheless, the search to unravel these complex links between Khoe and the earliest livestock has produced much useful archaeological information (Orton Reference Orton2015). In this spirit, we revisit the key archaeological sites that contributed significantly to the debate in order to re-examine the evidence and re-assess its value.
Kasteelberg rockshelter in the Western Cape Province of South Africa
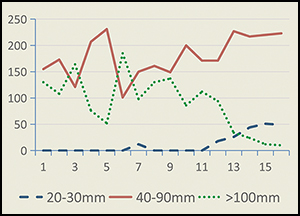
The site Kasteelberg B (KBB; Figure 1) is believed to have been occupied by Khoekhoe pastoralists for at least a millennium before the arrival of European settlers in the seventeenth century AD (e.g. Klein Reference Klein1986; Mitchell Reference Mitchell2002: 237, 239; Smith 2006). The site was first recorded by Jalmar Rudner (Reference Rudner1968), and was excavated during the 1980s by a team led by Andrew Smith (Smith Reference Smith1983, 1987, 1993; Smith & Poggenpoel Reference Smith and Poggenpoel1988; Klein & Cruz-Uribe Reference Klein and Cruz-Uribe1989; Woodborne Reference Woodborne1996). KBB is not a single component site (Smith 2006: 36). Its archaeological deposits show significant changes in the sequence occurring around AD 1000 (Sadr Reference Sadr1998; Sadr & Fauvelle-Aymar Reference Sadr and Fauvelle-Aymar2006). The first- and second-millennium AD components at KBB can be distinguished most clearly by their ceramic vessels: spouted pots with shell-edge stamped decoration characterise the first-millennium AD component (lower KBB), and undecorated lugged pots those of the early second millennium (middle KBB) (Sadr & Smith Reference Sadr and Smith1991: fig. 3). In the 16 stratigraphic levels excavated in squares F4–J7, shell-edge stamped pots dominate the lower ones, and undecorated pots are numerous from around level 12 upwards (Figure 2a). The spouted vessels of lower KBB commonly have a bevelled rim, while flat-top rims are characteristic of the lugged vessels in the middle and upper KBB ceramic assemblage (Figure 2b). Rim diameters of over 100mm are only common in middle and upper components; the tiny rim diameters that characterise spouts are found mainly in the lower occupation (Figure 2c). The sherds associated with middle and upper KBB are, on average, thicker than those associated with the lower occupation (Smith 2006: figs 4−10), but the paste and surface treatment of the potsherds from the three components are visually indistinguishable. Throughout the sequence, ceramic pots were used for rendering seal blubber (Patrick et al. Reference Patrick, Smith and De Koning1985; Copley et al. Reference Copley, Hansel, Sadr and Evershed2004; Stewart Reference Stewart2005).

Figure 1. The location of the hill Kasteelberg on the Vredenburg Peninsula, indicated by the red circle. Inset map shows South Africa.

Figure 2. Changes in material remains as seen in the excavated sequence of KBB (all data from Smith 2006). OES = ostrich eggshell; GBB = grooved grinding stones and bored stones.
There were differences in other cultural practices as well. In the nine spits excavated in squares A2–C4, ostrich eggshell beads are more common in the lower KBB occupation (Smith 2006: fig. 4.27), while bone tools, grooved grinding stones and bored stones are more common in the middle and upper components (Sadr & Fauvelle-Aymar Reference Sadr and Fauvelle-Aymar2006; Smith 2006: figs 4.25 & 4.26) (Figure 2d). In the 19 stratigraphic levels of square A3, black mussel (Choromytilis meridionalis) dominated the marine shell assemblage, but the lower occupation contained a slightly higher ratio of black mussel shells to limpets than middle KBB (Smith 2006: tab. 4.12) (Figure 3a). Finger Plough (Bullia) shells were found in greater quantity than Kalkoentjie (Burnupena pubescens) whelks in lower KBB, while in the middle occupation this was reversed, and in upper KBB they were equally insignificant (Smith 2006: tab. 4.12) (Figure 3b). Of the various terrestrial fauna recovered from the 16 levels of squares F4–J7, only two species show significant variation between the lower and middle KBB components: sheep bones (Ovis aries and Ovis sp.) are generally more numerous in lower KBB (Smith 2006: tab. 4.11), while Cape grey mongoose (Galerella pulverulenta) is relatively more common in middle KBB (Figure 3c).

Figure 3. Further changes in material remains as seen in the excavated sequence of KBB (all data from Smith 2006).
From the same excavation squares, lithic raw materials in upper KBB are dominated by quartz, by quartzite in the middle occupation, and by other raw materials in lower KBB (Smith 2006: tab. 4.10) (Figure 3d). In general, the density and diversity of material remains are greater in the middle and upper components, and the dates that are described below suggest that the rate of accumulation of archaeological deposits was faster during this time. Among other noteworthy differences are the dozens of grooves ground into the bedrock around KBB, which are associated with the middle and upper occupations (Sadr & Fauvelle-Aymar Reference Sadr and Fauvelle-Aymar2006).
What explains these material differences between the components at KBB? Two decades ago, it was suggested that the pre- and post-AD 1000 occupations at KBB were by people of two different cultures, and that the presence of lugged ceramics—associated with Cape herders at the time of European contact (Bollong et al. Reference Bollong, Smith and Sampson1997)—in the post-AD 1000 layers indicated that the occupants of middle and upper KBB were probably Khoekhoen (Sadr Reference Sadr1998). Whether they were descended from the occupants of lower KBB depended to some extent on how much time had elapsed between the lower and middle occupations. If the middle occupation had followed immediately upon the lower, then the scale of material change could indeed indicate a population replacement. This would reduce the likelihood that the Khoekhoen were the first herders at KBB. The 11 radiocarbon dates that were available from KBB in the late 1990s (for details see Smith 2006: tab. 4.8) did not furnish a precise estimate of how much time had elapsed between the lower and middle KBB occupations; a larger series of dates were needed to reduce this uncertainty (Sadr Reference Sadr1998: 117).
As a by-product of a parallel project concerning sea-surface temperatures, 78 marine shells covering the entire sequence of occupation at KBB were collected from the excavated material stored at the Iziko Museum in Cape Town. We have dated 25 of these shells. The 11 original dates taken by Smith (2006) were mostly from terrestrial samples (Table 1). The new dates are from the 1m2 excavation unit A3 and cover the entire sequence of occupation, with denser sampling from the lower and middle components. Unit A3 was excavated in natural layers and bulk-collected for sorting at the University of Cape Town.
Table 1. All radiocarbon assays from excavated contexts at KBB. The CAMS dates are the new series of AMS dates, and the PTA series are the original dates as reported in Smith (2006: tab. 4.8).

It was necessary to calibrate the marine and terrestrial dates in order to make them comparable. The calibration of marine dates must take into account the age of carbon that circulates in the oceans. Although Dewar et al. (Reference Dewar, Reimer, Sealy and Woodborne2012) provide the necessary data to correct the carbon reservoir effect of seawater in this area, the assumption that the reservoir effect remained stable during the millennium of occupation at KBB needs to be tested in the future with a paired-sample approach (e.g. Edinborough et al. Reference Edinborough, Martindale, Cook, Supernant and Ames2016). Such a test is beyond the scope of this study, and, for now, we assume that the weighted mean reported by Dewar et al. (Reference Dewar, Reimer, Sealy and Woodborne2012) (ΔR=146±85) provides an adequate correction of the calibrated marine shell dates from KBB. The original charcoal dates were calibrated with the southern hemisphere correction (Hogg et al. Reference Hogg, Hua, Blackwell, Niu, Buck, Guilderson, Heaton, Palmer, Reimer, Reimer, Turney and Zimmerman2013).
To reconstruct sequences of occupation, it is now widely considered best practice to employ statistical modelling on series of radiocarbon dates (e.g. Wood Reference Wood2015). Several recent publications provide a wide range of case studies showing how to refine the chronologies of occupation sequences and to determine the extent of associated gaps (Riede & Edinborough Reference Riede and Edinborough2012; Wuttmann et al. Reference Wuttmann, Briois, Midant-Reynes and Dachy2012; Allen & Morrison Reference Allen and Morrison2013; Cherkinsky & Di Lernia Reference Cherkinsky and Di Lernia2013; Burley & Edinborough Reference Burley and Edinborough2014; Thakar Reference Thakar2014; Finkelstein & Piasetzky Reference Finkelstein and Piasetzky2015). The use of such techniques on material from previous excavations can often shed new light on old debates (e.g. Wicks et al. Reference Wicks, Pirie and Mithen2014). We tried a range of statistical modelling on the KBB dates. These included stratigraphically constrained calibrations using the Bayesian sequence analysis (Bronk Ramsey Reference Bronk2009), combined with the phase model in OxCal using a Markov chain Monte Carlo (MCMC) analysis; single age model; depth model; and stratigraphic phase model. We obtained the strongest and least ambiguous results in a minimum age model of the sequenced dates.
Sampling and AMS dating methods
For this analysis, Andrew Smith selected from his excavated material three whole shells of the limpet Scutellastra granularis from 26 of the natural stratigraphic layers in square A3 at KBB (Figure 4). All 78 shells were processed by Stephan Woodborne at the Quaternary Dating Research Unit of the South African Centre for Scientific and Industrial Research (CSIR) in Pretoria, where a small sample was extracted from each shell for isotope measurements and radiocarbon dating. The samples from 25 selected shells were then prepared for AMS radiocarbon dating by Kamela Sekonya. To remove contaminants we followed the procedure of Vogel et al. (Reference Vogel, Nelson and Southon1987). The sample preparation and AMS measurements were carried out at the Center for Accelerator Mass Spectrometry (CAMS) in the Lawrence Livermore National Laboratory (California, USA) under the supervision of Tom Brown. CAMS 14C dates are based on 14C/13C atom ratios to obtain specific 14C activities. Southon's unpublished algorithms are used at CAMS, which are similar to those developed at Arizona (Donahue et al. Reference Donahue, Linick and Jull1990). Radiocarbon age data are presented according to the conventions of Stuiver and Polach (Reference Stuiver and Polach1977).

Figure 4. Profiles of the excavation of square A3 at KBB (redrawn from Smith 2006: figs 4.12 & 4.13). Stratum labels in red indicate the contexts of the 25 AMS-dated marine shells. Blue labels indicate deposits from which shell was collected, but that have not been dated.
Results
Here we present and test the minimum age model. Considering that the site had been heavily turbated by Cape dune mole rats (Bathyergus suillus), who are extremely active burrowers (Davies & Jarvis Reference Davies and Jarvis1986), it is highly likely that shells and charcoal samples were stratigraphically displaced by these animals. This suggests that the stratigraphic or depth positions of dates are not strictly sequential. We therefore decided to examine the dates in chronological sequence, un-modelled, and assess whether a single long occupation was represented, or a series of separate occupations. All dates were compared individually to each other using the Combine function in OxCal v4.2.2 (Bronk Ramsey 2013), and temporally homogeneous groups were defined as containing samples that could not be statistically distinguished from the other samples in the group (Figure 5). This procedure resulted in three homogeneous age groups being identified (Groups 1–3), plus two outlying samples around AD 1000 falling between Groups 2 and 3. In view of the clear differences in dates between Groups 2 and 3, a single event model was rejected. Membership of Groups 1 and 2 was less exclusive because some of the overlapping dates could be placed in either group. We opted to place the samples in the group with which they shared the highest combination statistics. Thus there is chronological continuity between Groups 1 and 2, and it is important to note that their two-sigma boundaries are extremely close. In contrast, Group 2 and 3 dates are clearly separate from each other.

Figure 5. Probability density functions (pdf) with two-sigma boundaries of three homogeneous age groups defined using the OxCal Combine function, showing the combined age pdf distributions and the individual assay pdf distributions including two anomalous assays (R_Date Pta-5083 and R_Date RAS(3)). Red pdf distributions refer to individual shell assays; purple pdf distributions refer to individual charcoal assays; and grey pdf distributions are the combined pdf distributions.
Using the un-modelled data, the chi-square tests for Group 1 (χ2 = 0.974; df = 8; CVα0.05 = 15.507), Group 2 (χ2 = 1.915; df = 14; CVα0.05 = 23.685) and Group 3 (χ2 =4.537; df = 8; CVα0.05 = 15.507) support the validity of the groupings. The Acomb, Aoverall, A and C statistics (see Bronk Ramsey 2013), the calibrated ages, and the two-sigma group age boundaries are presented in Table 2. These statistical comparisons all support this three-group model (Figure 6). At two sigmas the combined group ages suggest that the gap between Groups 2 and 3 was probably as much as 143 years or more, but the modelled age boundaries for Groups 1 and 2 overlap by 4 years. A total of 35 assays are included in this analysis, but only 2 dates fall into the gap between Groups 2 and 3. A chi-square goodness of fit test using the amount of time within each group to estimate the number of possible dates that would occur in the duration of each group, and in the gap between Groups 2 and 3, indicates that there were significantly fewer samples selected that date to the gap (χ2 goodness of fit = 12.285, df = 3, p = 0.006). The one charcoal and one marine shell date that relate to this gap suggest infrequent visits to KBB between AD 883 and 1026.
Table 2. Tabulated results of the modelled and un-modelled calibrated dates from KBB.


Figure 6. Group 1, Group 2 and Group 3 probability density function (pdf) distributions with two-sigma probability boundaries and the two anomalous assays (R_Date Pta-5083 and R_Date RAS(3)) between the dates for Groups 2 and 3. Red pdf distribution refers to an individual shell assay; purple pdf distribution refers to an individual charcoal assay; and grey pdf distributions are the combined pdf distributions.
In our minimum age model we therefore propose that these assays resulted from three occupations. This model does not carry any assumption of a stratigraphic sequence of layers, only that there were three occupations that occurred at different times.
Discussion and conclusion
Whether or not the makers of lugged pottery in the south-western Cape were descended from the makers of spouted wares, or from a different population, has proved a longstanding question (Sadr Reference Sadr1998). The answer depends, to some extent, on whether the change from the lower to the middle occupation at KBB was a rapid event, or whether an occupational hiatus existed between them. A hiatus would make room for the possibility that the spouted pottery tradition evolved into the lugged pottery tradition, even though the excavations at KBB had not intercepted the actual transition. This would allow for cultural, linguistic and genetic continuity between the herders who occupied the site during lower KBB, and inhabitants during middle and upper KBB.
The combined analysis of a new series of 25 AMS dates with the older series of 11 dates obtained during excavations at KBB in the 1980s has indicated the high probability that there was indeed a hiatus between lower and middle KBB, as represented by the Group 2 and 3 dates. The dates also indicate that there was no significant hiatus between the middle and upper KBB occupations (Group 1 and 2 dates) and, therefore, that the makers of the lugged vessels in the middle and upper KBB components were closely related in time and culture. The chronological gap and many material changes between the lower and middle components, on the other hand, suggest that their occupants were less closely related. There is no indication, however, of a rapid cultural replacement caused by the arrival of a new population.
Why this part of Kasteelberg was probably abandoned for a century or two around AD 1000, and where the possible cultural evolution from the spouted ware tradition to the lugged ware tradition took place, are questions that remain to be investigated. The transition could have occurred on the hill Kasteelberg but at a location that has not yet been excavated. Or it could have occurred at other locations on the western or southern Cape coasts. We know that there was significant change towards a warmer and (in the winter rainfall zones, such as the south-western Cape) drier climate around AD 1000 (the medieval warming epoch, see e.g. Tyson et al. Reference Tyson, Odada and Partridge2001; Woodborne et al. Reference Woodborne, Hall, Robertson, Patrut, Rouault, Loader and Hofmeyr2015). We also know that there is an increase in the number of radiocarbon dates from this period in coastal areas a hundred or more kilometres to the north of Kasteelberg (Sadr 2014: fig. 8.2), which could be interpreted as a general population increase in that region at around the time that the numbers of radiocarbon dates around Kasteelberg begin to decline. There may be a link between these trends, but all of this remains speculative at this stage. As a signpost for future research, the new series of AMS dates has indicated the need to examine further, and in greater detail, the archaeology of Kasteelberg during the centuries on either side of AD 1000.
Acknowledgements
Permission to collect, export and date the shell samples from KBB was kindly granted by the South African Heritage Resources Agency (Permanent Export permit no. 80/11/05/012/52). Special thanks go to Paula Zermeno for helping Kamela Sekonya with sample preparation and for pressing the graphite targets. 14C analyses were performed under the auspices of the International Atomic Energy Agency South Africa for the scientific visit of Kamela Sekonya to the Center for Accelerator Mass Spectrometry at the Lawrence Livermore National Laboratory, California.


