


I. INTRODUCTION
1-Benzothiophene-2-carboxylic acid (C9H6O2S, BTCA, see Figure 1), also known as thionaphthene-2-carboxylic acid or thianaphthene-2-carboxylic acid, is a heterocyclic sulfur compound which has been reported to exhibit a wide variety of pharmaceutical activities. It is also a starting material for the synthesis of larger bioactive structures since the benzothiophene ring is an important functional group in drug discovery. In a recent review, the benzothiophene scaffold is reported as one of the privileged molecular cores in drug discovery (Keri et al., Reference Keri, Chand, Budagumpi, Balappa Somappa, Patil and Nagaraja2017). Several benzothiophene-based compounds have been used to treat various types of diseases with high therapeutic potency (Keri et al., Reference Keri, Chand, Budagumpi, Balappa Somappa, Patil and Nagaraja2017). In particular, BTCA has been studied as a hypolipidemic (Gronowitz et al., Reference Gronowitz, Herslof, Svenson, Bondesson and Magnusson1978), antihypercalcemic (Robin et al., Reference Robin, Brown, Weinfeld and Dziak1984; Johannesson et al., Reference Johannesson, Onkelinx, Rodan and Raisz1985; Decker et al., Reference Decker, Morrison, Lorenzo, Samour, McCarron and Raisz1989; Nyska et al., Reference Nyska, Nyska, Waner and Wolter1992), and used to treat leukemia (Friberg et al., Reference Friberg, Vigil, Zhao, Daniels, Burke, Garcia-Barrantes, Camper, Chauder, Lee, Olejniczak and Fesik2013). This compound has also been used to prepare carboxylated conducting polymer/CNTs (carbon nanotubes) composite thin films (Netsuwan et al., Reference Netsuwan, Sriwichai, Phanichphant, Baba, Shinbo, Kato and Kaneko2013).

Figure 1. Molecular diagram of 1-benzothiophene-2-carboxylic acid.
To our knowledge, only one study associated with some type of characterization of 1-benzothiophene-2-carboxylic acid has been published in the open literature (Ramos et al., Reference Ramos, Flores, Rojas, Hernández-Pérez, Camarillo and Amador2016). In this report, the thermochemical characterization of this material, which includes the determination of the standard enthalpies of formation, sublimation enthalpies, and other physicochemical parameters from theoretical considerations and experimental work at 298.15 K, are presented along with those of benzofuran and indole derivatives. This study concludes that there are two stable conformers for 1-benzothiophene-2-carboxylic acid, both having a planar structure, and with an anti- or syn-periplanar disposition of the OH group and the heteroatom. These results are similar to 1-benzofuran-2-carboxylic acid (BFCA), an analogous compound with an oxygen atom instead of a sulfur atom in the five-member ring. Based on the sublimation enthalpy of 1-benzothiophene-2-carboxylic acid, it must have stronger intermolecular interactions in the solid phase than 1-benzofuran-2-carboxylic acid, presumably because of an increase of the London dispersion forces due to the presence of the sulfur atom.
A search in the Cambridge Structural Database (CSD) version 5.41 (Groom et al., Reference Groom, Bruno, Lightfoot and Ward2016) did not show any reports on the crystal structure of 1-benzothiophene-2-carboxylic acid. There are only four reports related to this compound. One is for its 2-hydroxy-1,2-diphenylethanaminium salt (Refcode VEKZUI; Hige et al., Reference Hige, Shiota, Kobayashi, Wakabayashi, Sato and Imai2012) and three isostructural coordination complexes with yttrium, dysprosium, and terbium (POXPIE, POXPAW, POXPEA; Biswas et al., Reference Biswas, Mandal, Shen and Yamashita2019). The ICDD PDF-4/Organics database (Gates-Rector and Blanton, Reference Gates-Rector and Blanton2019) contains one entry associated with this material, PDF 00-060-1348. This pattern was submitted by one of us (AR-L) as part of the Grant-in-Aid (GiA) program of the ICDD. At the time, the pattern was indexed with a triclinic unit cell, but no structural information was submitted. Given our interest in the structure of materials involved in pharmaceutical formulations or with potential pharmaceutical applications, it was decided to undertake the structure determination of this compound using the raw data contained in the PDF-4/Organics database.
A recent publication (Sagaama and Issaoui, Reference Sagaama and Issaoui2020) contains a computational study on molecular geometry, vibrational, and electronic properties of the monomeric and dimeric structures of 1-benzothiophene-2-carboxylic acid carried out using DFT. In this publication, there is a mention of a crystal structure of BTCA that was reported to the Cambridge Crystallographic Data Centre (CCDC). The number 950133 was assigned to the data in 2013 (Jarczyk-Jędryka, Reference Jarczyk-Jędryka2013), although it has not been incorporated into the CSD yet. The analysis of the CIF file kindly provided by the CCDC showed that the 950133 partially disordered structure is different from the one described in this contribution, indicating that they are two different polymorphs of 1-benzothiophene-2-carboxylic acid. From now on, the 950133 structure will be referred to as BTCA-Form I, while the structure reported in this study will be referred to as BTCA-Form II.
II. EXPERIMENTAL METHODS
A small portion of the sample, purchased from Aldrich, was ground and mounted on a zero-background holder. The X-ray powder diffraction (XRPD) data were registered at room temperature with an X'PERT PRO MPD diffractometer at the Faculty of Chemistry of the Jagiellonian University. This instrument is equipped with a CuKα source working at 40 kV and 30 mA, a diffracted-beam graphite monochromator, and a PIXcel PSD detector. The data were recorded from 4.10° to 80° in 1 h and processed in steps of 0.02°. The powder pattern was submitted by one of us (AR-L) to the ICDD through the GiA program. The pattern has been included in the Powder Diffraction File™ as entry 00-060-1348.
III. COMPUTATIONAL STUDIES
The crystal structure obtained from XRPD was energy-minimized with the program GRACE (Neumann, Reference Neumann2002), which calls VASP (Kresse and Furthmüller, Reference Kresse and Furthmüller1996) for single-point DFT calculations with the PBE functional (Perdew et al., Reference Perdew, Burke and Ernzerhof1996) to which a dispersion correction (Neumann and Perrin, Reference Neumann and Perrin2005) is added. The method has been extensively validated against about 600 crystal structures and the upper limit for the root-mean-square Cartesian displacement between the structure from the Rietveld refinement, if correct, and the energy-minimized structure was established to be approximately 0.35 Å (van de Streek and Neumann, Reference van de Streek and Neumann2014). Details of the calculations can be found elsewhere (Neumann and Perrin, Reference Neumann and Perrin2005).
A. Hirshfeld surface analysis and energy frameworks
The software CrystalExplorer17 (Turner et al., Reference Turner, McKinnon, Wolff, Grimwood, Spackman, Jayatilaka and Spackman2017) was used to produce “Fingerprint plots” of the intermolecular interactions present in the structure determined in this work and, for comparison analysis, in the reported structure of 1-benzofuran-2-carboxylic acid, BFCA (CSD entry UNOYIH). For both structures, the map of the parameter d norm onto the Hirshfeld surface (Spackman and Jayatilaka, Reference Spackman and Jayatilaka2009) was calculated. This parameter is useful for visualizing the atoms involved in intermolecular contacts and the strength of such contacts. Energy frameworks for the two structures were also calculated with CrystalExplorer17 (Turner et al., Reference Turner, McKinnon, Wolff, Grimwood, Spackman, Jayatilaka and Spackman2017). After a recent publication (Sagaama and Issaoui, Reference Sagaama and Issaoui2020), in which Hirshfeld surface analysis and fingerprint plots were reported, based on the data of a partially disordered crystal structure of 1-benzothiophene-2-carboxylic acid deposited in the Cambridge Crystallographic Data Centre, CCDC, energy frameworks were also calculated for this crystal structure.
IV. RESULTS AND DISCUSSION
Initially, the pattern was indexed with a triclinic unit cell with parameters: a = 7.839(3) Å, b = 19.169(8) Å, c = 5.844(2) Å, α = 98.82(3)°, β = 111.71(5)°, γ = 79.16(5)°, V = 797.9 Å3. After numerous unsuccessful attempts to determine the structure in this cell, it was decided to re-index the powder pattern. The indexing with CONOGRAPH (Esmaeili et al., Reference Esmaeili, Kamiyama and Oishi-Tomiyasu2017) using the first 25 peaks, produced a monoclinic cell with Bravais cell type C and cell parameters: a = 14.529 Å, b = 5.849 Å, c = 19.291 Å, β = 103.886, V = 1591.4 Å3. The figures of merit obtained were M 25 = 13.3 (de Wolff, Reference de Wolff1968) and  $M_{25}^{\rm Wu}$ = 12.9,
  $M_{25}^{\rm Rev}$ = 1.09,
  $M_{25}^{\rm Sym}$ = 14.6, and NN = 25 (Oishi-Tomiyasu, Reference Oishi-Tomiyasu2013). These figures of merit, although low, have the highest values with respect to the other cells obtained (triclinic and primitive monoclinic). It must be noted that the volume of the monoclinic cell obtained is twice the volume reported in entry PDF 00-060-1348 and that its reduced cell is similar to the unit cell reported. DICVOL14 (Louër and Boultif, Reference Louër and Boultif2014), as implemented in the PreDICT graphical-user interface (Blanton et al., Reference Blanton, Papoular and Louër2019), also led to the C-monoclinic cell obtained with CONOGRAPH, with similar low figures of merit. The powder diffraction data obtained are presented in Supplementary Table S1. After the structure determination and validation, the monoclinic unit cell obtained proved to be correct.
A reduced cell search in the CSD (Groom et al., Reference Groom, Bruno, Lightfoot and Ward2016) combined with a chemical elements search having only C, H, O, and S yielded no hits. It is worth noting that the monoclinic primitive cell suggested in the indexing procedure has similar cell parameters as those for 1-benzofuran-2-carboxylic acid, in entry UNOYIH of the CSD (Krishnaswamy et al., Reference Krishnaswamy, Desai, Potla, Suchetan and Arunakumar2016). However, the superposition of the pattern registered and the calculated pattern for entry UNOYIH clearly shows that the two patterns are very different. This figure has been incorporated in Supplementary Figure S1.
The fit of the recorded pattern was carried out with the Pawley algorithm by modeling the background, sample displacement errors, cell parameters, and peak shape parameters (including anisotropic broadening) using TOPAS-Academic (Coelho, Reference Coelho2016). A 20-term Chebyshev polynomial was used to model the background. The intermediate Gaussian–Lorentzian function was employed with a correction for axial divergence as proposed by the program. The Pawley refinement produced a good fitting of all the diffraction maxima recorded with residuals R p = 0.0549, R wp = 0.0742, and GoF = 1.653, confirming the correctness of the unit cell and the single-phase nature of the material. The other two cells found in the indexing procedure were also evaluated using the Pawley refinement. The profile fittings were worse and the discrepancy factors higher. The analysis of the reflection conditions implemented in the CRONOGRAPH software suggests Cc or C2/c as possible space groups. These space groups were also suggested by the Bayesian extinction symbol algorithm in DASH 3.4.5 (Markvardsen et al., Reference Markvardsen, David, Johnson and Shankland2001) and by DAJUST (Vallcorba et al., Reference Vallcorba, Rius, Frontera, Peral and Miravitlles2012).
The initial molecular model, introduced as a .mol file, was built with the MOPAC2016 software (Stewart, Reference Stewart2016) using the PM7 method (Stewart, Reference Stewart2013). With this model and the profile parameters obtained from the Pawley fit, the crystal structure was determined with DASH (David et al., Reference David, Shankland, van de Streek, Pidcock, Motherwell and Cole2006). Initially, without considering preferred orientation, the fitting of the profile led to a χ 2 = 280.70. Using the March–Dollase function as a model for the preferred orientation, in the (1 1 6) plane, the structure was determined satisfactorily with a χ 2 = 69.76 and a March–Dollase parameter of 0.582. After the structure was determined, it was noted that the planar nature of the molecules creates molecular planes which make an angle of approximately 5° from the (116) crystallographic plane, which is consistent with the preferred orientation plane modeled. The refinement of the structure carried out with TOPAS-Academic (Coelho, Reference Coelho2016), using the same preferred orientation plane, produced a reasonably good fit with R p = 0.0977, R wp = 0.1396, and GoF = 3.310. After observing a pronounced preferred orientation effect, a spherical harmonic function was used to model the preferred orientation. Figure 2 shows the final Rietveld refinement plot. The refinement included an overall scale parameter, the background, the peak shapes (including anisotropic broadening), unit-cell parameters, atomic coordinates, an overall B iso parameter, and a spherical harmonics preferred orientation (6th order) model. The bond distances and angles were restrained based on the values of the energy-minimized structure. A planar restraint for the molecule with a standard deviation of 0.01 Å was also established. The isotropic atomic displacement parameters for the hydrogen atoms were 1.2 times the parameter of the C or O atom to which they are attached. Figure 3, drawn with DIAMOND (Brandenburg, Reference Brandenburg1999), depicts the molecular structure of 1-benzothiophene-2-carboxylic acid showing the atom numbering scheme.

Figure 2. Rietveld plot obtained after the structure refinement of BTCA-Form II.

Figure 3. Molecular structure of BTCA-Form II with the labeling scheme for atoms and rings.
In total, 144 parameters were refined with 2776 data points (235 reflections), 54 restraints, and 1 constraint. The final whole pattern fitting converged with good figures of merit: R e = 0.0421, R p = 0.0812, R wp = 0.1137, and GoF = 2.697. Table I shows the crystal data, experimental parameters, and the refinement parameters obtained. The DFT-D calculations of the determined structure led to an RMSCD of 0.19 Å, which is lower than the 0.35 Å value (van de Streek and Neumann, Reference van de Streek and Neumann2014), indicating that the structure determined is correct. Figure 4 shows the comparison between the determined and the DFT-D optimized structures.

Figure 4. Superposition of the experimentally determined (red) and the energy-minimized (blue) structure for BTCA-Form II.
Table I. Crystal data, experimental parameters, and refinement results for 1-benzothiophene-2-carboxylic acid.
A. Molecular and crystal structure
The atomic coordinates and isotropic displacement parameters for all atoms, the bond distances, and the angles are reported in Supplementary Tables S2 and S3. In the statistical analysis performed with the Mogul Geometry Check (Bruno et al., Reference Bruno, Cole, Kessler, Luo, Motherwell, Purkis, Smith, Taylor, Cooper, Harris and Orpen2004), all the 32 distances and bond angles in the structure have z-score below 3.
The asymmetric unit contains one BTCA molecule (see Figure 3). The molecule is essentially planar, as indicated by the low RMSD (0.0641 Å) which compares the idealized Cs symmetry and the determined structure. The benzothiophene unit (rings A/B) is planar and the OH group is anti with respect to the sulfur atom, in agreement with a previous report (Ramos et al., Reference Ramos, Flores, Rojas, Hernández-Pérez, Camarillo and Amador2016). The A/B fragment makes an angle of 9.1(3)° with the best plane through the carboxylic acid group. The whole molecule makes angles with respect to the a-, b-, and c-axes of 16.17(9)°, 28.08(9)°, and 48.17(9)°, respectively.
B. Intermolecular hydrogen bonds
Figure 5 depicts a view of the intermolecular hydrogen bonds present in 1-benzothiophene-2-carboxylic acid where the O and H atoms involved in hydrogen bonds are labeled. The strongest interaction is a cyclic acid–acid dimer homosynthon, represented by the graph set symbol  $\;R_2^2 \lpar 8 \rpar$ (Etter et al., Reference Etter, MacDonald and Bernstein1990; Bernstein et al., Reference Bernstein, Davis, Shimoni and Chang1995) with O2 as the acceptor, O1 as the donor, and H1A as the donated H (motif I). Every dimer is further connected to other dimers by two different hydrogen-bonding motifs, labeled II and III, in which O1 serves both as the acceptor and as the donor. A notation with additional fields as superscripts and subscripts has been proposed to resolve ambiguities and to describe more precisely the atoms which act as acceptors and donors in a particular hydrogen-bonding pattern (Etter et al., Reference Etter, MacDonald and Bernstein1990). Using this notation, motif I may be written as
 $\;\lsqb R_2^2 \lpar 8 \rpar \rsqb _{{\rm O}1}^{{\rm O}2}$ to indicate that O2 acts as the acceptor and O1 as the hydrogen donor. Motif II is represented by the symbol
 $\;\lsqb R_2^2 \lpar {10} \rpar \rsqb _{{\rm C}7}^{{\rm O}1}$ where O1 is the hydrogen bond acceptor, C7 is the donor, and H7 is the donated hydrogen. Similarly, motif III is represented by
 $\;\lsqb R_3^2 \lpar 8 \rpar \rsqb _{{\rm O}1\comma {\rm C}3\comma {\rm C}7}^{{\rm O}2\comma {\rm O}2\comma {\rm O}1}$ with O2 participating as a bifurcated acceptor and O1 participating as an acceptor and as a donor (H1A, H3, and H7 are the hydrogen atoms donated). These interactions result in tapes which alternate at angles of approximately +16° and −16° with the a-axis and +29.5° and −29.5° with the b-axis, producing a pattern similar to the tapes found in the BTCA-Form I structure (see Figure 6) and in 1-benzofuran-2-carboxylic acid.

Figure 5. Graph set analysis of the intermolecular O–H⋯O and C–H⋯O hydrogen bonds in BTCA-Form II. The hydrogen bonded motifs are labeled as I:  $\;\lpar \lsqb R_2^2 \lpar 8 \rpar \rsqb _{{\rm O}1}^{{\rm O}2} \rpar$; II:
 $\;\lsqb R_2^2 \lpar {10} \rpar \rsqb _{{\rm C}7}^{{\rm O}1}$; III:
 $\;\lsqb R_3^2 \lpar 8 \rpar \rsqb _{{\rm O}1\comma {\rm C}3\comma {\rm C}7}^{{\rm O}2\comma {\rm O}2\comma {\rm O}1}$.

Figure 6. Hydrogen-bonding scheme in BTCA-Form I (drawn using data from Jarczyk-Jędryka, Reference Jarczyk-Jędryka2013) seen along the a-axis.
C. π⋯π and C–H⋯π interactions
In addition to hydrogen bonding, π⋯π and C–H⋯π interactions provide connectivity between the molecules (Figure 7). Short face-to-face offset π⋯π interactions (d = 4.385(3) Å) occur between molecules related by symmetry operation 1/2−x, 1/2−y, −z along the c-axis. At the same time, the molecule interacts via a type III (Malone et al., Reference Malone, Murray, Charlton, Docherty and Lavery1997) C–H⋯π contact of 2.711(9) Å with another molecule with symmetry operation 1/2−x, 1/2+y, 1/2−z [Figure 7(a)]. This type of interaction is common for Csp2–H phenyl groups. The π⋯π connected dimers are further connected by C–H⋯π interactions as shown in Figure 7(b). On the other hand, in the BTCA-Form I structure, there are only head-to-head π⋯π interactions between molecules related by translation along the a-axis as can be seen in Figure 7(c). Similarly, in the structure of BFCA, only head-to-head π⋯π interactions are also observed. Figure 8(a) shows the arrangement of π⋯π and C–H⋯π interactions along the a-axis for BTCA-Form II. In BTCA-Form I and in BFCA, there are shorter contacts (d = 3.7257(10) and 3.7160(11) Å, respectively; see Table II) than in BTCA-Form II, and the interactions are between the phenyl and the thiophene rings as shown in Figures 8(b) and 8(c).

Figure 7. (a) Geometry of π⋯π (magenta) and C–H⋯π (cyan) interactions; (b) sequence of head-to-tail π⋯π connected dimers and head-to-tail C–H⋯π connected dimers in BTCA-Form II; and (c) head-to-head π⋯π interactions in BTCA-Form I.

Figure 8. (a) Arrangement of molecules in BTCA-Form II connected by π⋯π (magenta) and C–H⋯π interactions (cyan); (b) head-to-head π⋯π interactions (magenta) in BTCA-Form I; and (c) dimers of BFCA molecules connected by π⋯π interactions (magenta).
Table II. Geometry of hydrogen bonds, π⋯π, C–H⋯π, and C–O⋯π interactions in (a) BTCA-Form II, (b) BTCA-Form I (Jarczyk-Jędryka, Reference Jarczyk-Jędryka2013), and (c) BFCA (Krishnaswamy et al., Reference Krishnaswamy, Desai, Potla, Suchetan and Arunakumar2016).

In summary, the structure of BTCA-Form II, reported in this work, is a complex 3D arrangement of hydrogen bonds, π⋯π, and C–H⋯π interactions as shown in Figure 9. It can be described in terms of two sets of 1D tapes, as depicted in Figure 5, formed by dimers connected by O–H⋯O and C–H⋯O hydrogen bonds, which form an angle of 56.75° and are oriented at angles of approximately +16° and −16° with respect to the a-axis. These tapes are connected by head-to-tail π⋯π and edge-to-face C–H⋯π interactions [Figure 8(a)] in a “chevron” type of pattern. In contrast, the BTCA-Form I and the BFCA structures can be described as 1D tapes of dimers connected only by π⋯π interactions [Figures 8(b) and 8(c)] which form an offset stacking along the a-axis. This offset stacking has been called “γ-motif” (Loots and Barbour, Reference Loots, Barbour, Tiekink and Zukerman-Schpector2012). The differences observed between the BTCA structure reported in this work and the BTCA structure previously reported (Jarczyk-Jędryka, Reference Jarczyk-Jędryka2013) corroborate that they are two different polymorphs of 1-benzothiophene-2-carboxylic acid.

Figure 9. (a–c) Packing arrangement of BTCA-Form II viewed down the a-, b-, and c-axes, respectively.
D. Hirshfeld surface analysis
Fingerprint plots (Turner et al., Reference Turner, McKinnon, Wolff, Grimwood, Spackman, Jayatilaka and Spackman2017) representing d e/d i interactions were calculated for BTCA-Form II, for the major component of BTCA-Form I, and for BFCA. They were compared with the results reported for the disordered structure of BTCA-Form I (Sagaama and Issaoui, Reference Sagaama and Issaoui2020). The interactions with more than 5% contribution for BTCA-Form II and BFCA are shown in Figures 10 and 11, respectively. All the plots are contained in Supplementary Figures S2 and S3. Figure 12 summarizes the contributions of all contacts in BTCA-Form II, disordered BTCA-Form I, major component of BTCA-Form I, and BFCA to the Hirshfeld surface area. As can be seen, there are significant differences between the fingerprint plots of the two polymorphs of BTCA and BFCA. The major contribution to the fingerprint plot in BTCA-Form II is due to H/C interactions (26.1%), followed by H/H (23.9%) and H/O interactions (22.5%). The contribution of H/S interactions is quite significant (14.9%). For BTCA-Form I, as expected, the calculations are affected by the disordered nature of the structure involving the S, C, and H atoms of the thiophene ring. As reported by Sagaama and Issaoui (Reference Sagaama and Issaoui2020), the H/H interactions in BTCA-Form I considering the disordered structure contribute 41.8%. Our calculation for the major disorder component results in a 29.9% contribution, which is higher than for BTCA-Form II (23.9%).
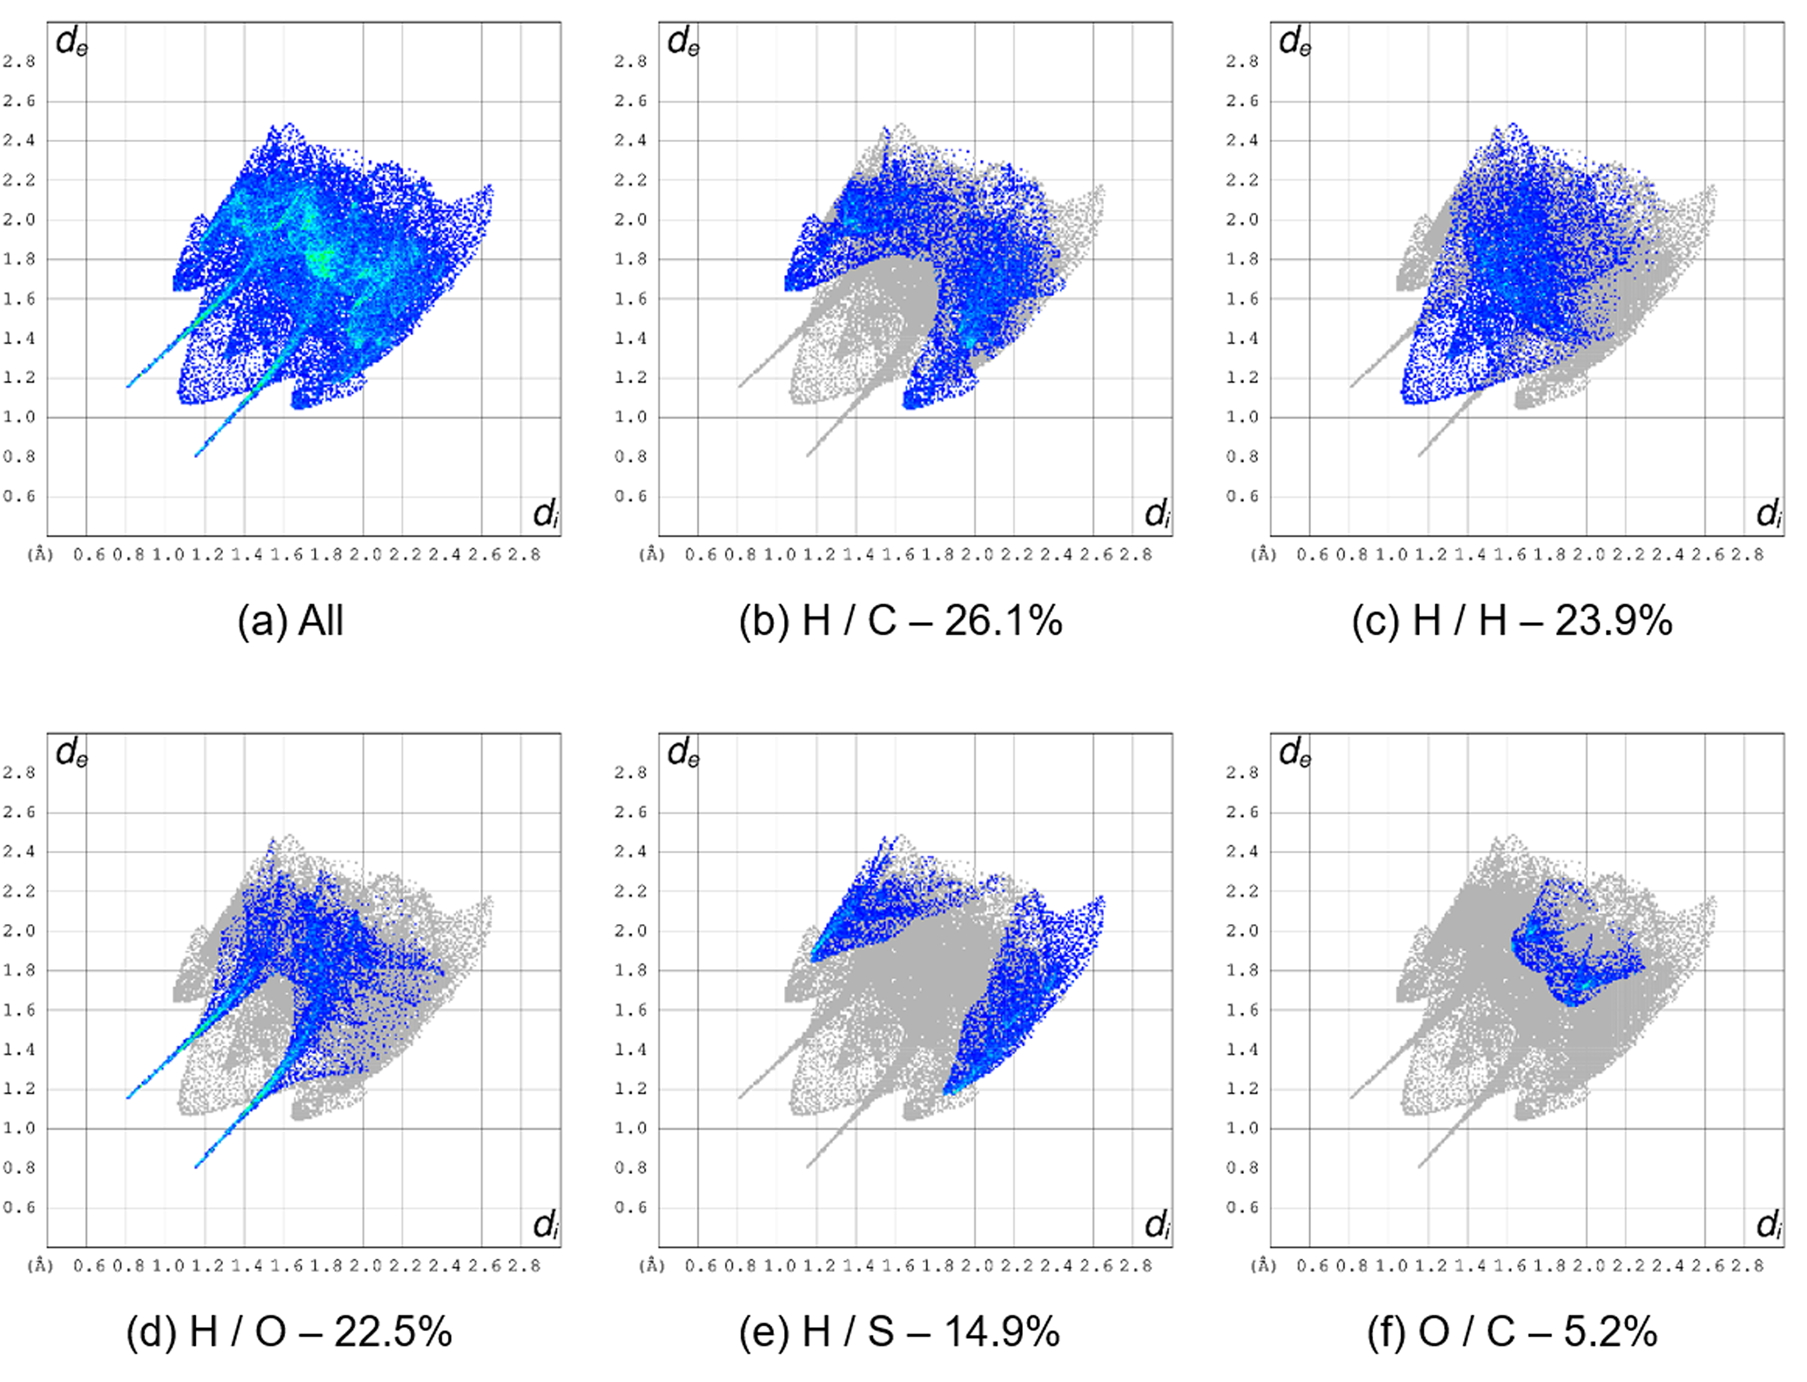
Figure 10. Fingerprint plots for BTCA-Form II. (a) All contacts, (b) H⋯C contacts, (c) H⋯H contacts, (d) H⋯O contacts, (e) H⋯S contacts, and (f) O⋯C contacts. The percent of the surface area included is shown for each plot (99.8%).

Figure 11. Fingerprint plots for BFCA. (a) All contacts, (b) H⋯O contacts, (c) H⋯H contacts, (d) H⋯C contacts, (e) C⋯C contacts, and (f) O⋯C contacts. The percent of the surface area included is shown for each plot (100.0%).

Figure 12. Comparison of the contribution of intermolecular contacts (%) to the Hirshfeld surface area for BTCA-Form II, BTCA-Form I, and BFCA.
The contribution of H/O interactions in BTCA-Form I (23.2% for the disordered structure, 24.5% for the major component only) is similar to Form II (22.5%). However, the contribution of H/C contacts in BTCA-Form I (13.4% and 13.0% for the disordered and major component, respectively) is about half of the observed value in BTCA-Form II (26.1%). In contrast to what is observed for the H/H interactions, the H/S in the disordered structure of BTCA-Form I (3.9%) is smaller than for the major component (12.6%), and these two are smaller than in BTCA-Form II (14.9%). Regarding the C/C interactions, they are less important in BTCA-Form II (4.1%) than in BTCA-Form I (11.2% and 11.6% for the disordered structure and the major component, respectively).
In the case of BFCA, there is a stronger contribution from H/O interactions (34.6%) compared with BTCA Forms I and II. In both forms of BTCA, there is a competition between O and S for interactions with H atoms, while in BFCA, there are three O atoms which can participate in hydrogen bonds. H/H contacts also contribute significantly (30.9%), followed by H/C interactions (18.1%).
Mapping the close contacts with respect to d norm onto the Hirshfeld surface allows better visualization of contacts shorter than the sum of the van der Waals radii. Short contacts appear as strong red spots on a white-blue surface, while longer contacts appear as smaller red areas. Figure 13 shows the d norm parameter mapped for BTCA-Form II and for BFCA. The Hirshfeld surfaces are similar and similar to Figure 6 reported for BTCA-Form I (Sagaama and Issaoui, Reference Sagaama and Issaoui2020). The strongest red areas correspond to the cyclic O–H⋯O acid–acid hydrogen bond (motif I,  $\;\lsqb R_2^2 \lpar 8 \rpar \rsqb _{{\rm O}1}^{{\rm O}2}$) for BTCA-Form II and BFCA). Smaller red areas are related to weaker C–H⋯O interactions, associated with the hydrogen-bonding motifs
  $\;\lsqb R_2^2 \lpar {10} \rpar \rsqb _{{\rm C}7}^{{\rm O}1}$ (II) and
  $\;\lsqb R_3^2 \lpar 8 \rpar \rsqb _{{\rm O}1\comma {\rm C}3\comma {\rm C}7}^{{\rm O}2\comma {\rm O}2\comma {\rm O}1}$ (III). As mentioned earlier, this is consistent with the formation of 1D hydrogen-bonded tapes present in the three structures. The main difference is the C–H⋯π [motif IV in Figure 13(a)] which shows a faint-red area in the top of the surface for BTCA-Form II. The H⋯H contacts in BFCA [motifs IV and V in Figure 13(b)] are more abundant than in BTCA-Form II (motif V), due to the absence in BTCA-Form I and BFCA of C–H⋯π interactions. On the other hand, the H1⋯H2 interactions in BTCA-Form II are arranged in a diagonal fashion, while in BTCA-Form I and BFCA, they are almost perpendicular to the molecular plane.

Figure 13. Mapping of the d norm parameter in the range −0.74 to 1.33 onto the Hirshfeld surface for (a) BTCA-Form II and (b) BFCA. The close contacts with neighboring molecules are shown for each compound.
The Hirshfeld surfaces mapped over the curvedness and shape-index for BTCA-Form II and BFCA, carried out with CrystalExplorer17 (Turner et al., Reference Turner, McKinnon, Wolff, Grimwood, Spackman, Jayatilaka and Spackman2017), are contained in Supplementary Figures S4(a)–S4(h). The supplementary data of BTCA-Form I (Sagaama and Issaoui, Reference Sagaama and Issaoui2020) contains the plots for this polymorph. The curvedness plot for BTCA-Form II [Supplementary Figure S4(a)] shows a large flat surface on the top part of the molecule, consistent with the π⋯π interactions observed. The other side displays a concave area [Supplementary Figure S4(b)] due to the C–H⋯π interaction with a neighboring molecule. The shape-index plots in Supplementary Figures S4(c) and S4(d) display contiguous red and blue triangular regions indicative of the π⋯π interactions, as well as red concave regions associated to the C–H⋯π contacts. On the other hand, the curvedness and shape-index plots of BTCA-Form I (Sagaama and Issaoui, Reference Sagaama and Issaoui2020) and BFCA [Supplementary Figures S4(e)–S4(h)] display flat surfaces and complementary red and blue regions on both sides of the molecule due to the offset π⋯π stacking pattern.
E. Energy frameworks calculations
The electrostatic (E ele), dispersive (E dis), and total energies (E tot) for the intermolecular interactions in BTCA-Form II, BTCA-Form I (Jarczyk-Jędryka, Reference Jarczyk-Jędryka2013), and BFCA (Krishnaswamy et al., Reference Krishnaswamy, Desai, Potla, Suchetan and Arunakumar2016) were calculated with CrystalExplorer17 (Turner et al., Reference Turner, McKinnon, Wolff, Grimwood, Spackman, Jayatilaka and Spackman2017). They are represented in Figure 14. The calculated energy values are summarized in Table III.

Figure 14. Energy frameworks calculated for (a) BTCA-Form II viewed along the a-axis (3 × 3 × 3 unit cells); (b) BTCA-Form I viewed along the b-axis (3 × 5 × 5 unit cells); (c) BFCA viewed down the c-axis (2 × 1 × 3 unit cells). The radii of the cylinders were scaled to 80 arbitrary units with a cut-off value of 10 kJ mol−1. E ele, E dis, and E tot are represented in red, green, and blue, respectively.
Table III. Summary of calculated energies (kJ mol−1) for BTCA-form II (this work), BTCA-form I (Jarczyk-Jędryka, Reference Jarczyk-Jędryka2013), and BFCA (Krishnaswamy et al., Reference Krishnaswamy, Desai, Potla, Suchetan and Arunakumar2016).

As depicted in Figure 14(a), in the structure of BTCA-Form II, the topology of the electrostatic contribution to the energy is different from the topology of the dispersive component. As expected, the cyclic O–H⋯O hydrogen bond is the main contributor to the electrostatic energy. The red cylinders which represent these interactions stack along the b-axis to form columns that alternate along the c-axis with columns related by the 21-screw axis along b, maintaining the γ-motif (Loots and Barbour, Reference Loots, Barbour, Tiekink and Zukerman-Schpector2012) of the packing arrangement. The dispersive component is less important but provides connectivity between the columns and results in a complex topology for E tot. In contrast, the E tot topology for BTCA-Form I is simpler with the red cylinders of the E ele contribution stacked along the a-axis but oriented in only one direction and the strongest dispersive contributions (E dis) are parallel to the a-axis. In the structure of BFCA, E ele makes an important contribution in a manner similar to BTCA-Form II. E dis is also less important, but its contribution occurs as isolated columns. The resulting topology for E tot can be described as isolated columns which stack in a γ-motif [Figure 14(c)]. All views of the energy frameworks are presented in Supplementary Figures S5–S7.
V. CONCLUSION
The crystal structure of a new polymorph of 1-benzothiophene-2-carboxylic acid has been determined from laboratory X-ray powder diffraction data with DASH, refined by the Rietveld method with TOPAS-Academic, and optimized using DFT-D calculations. The new polymorph crystallizes in a monoclinic unit cell (space group C2/c, No. 15), while the previously reported polymorph crystallizes in a triclinic unit cell (space group P  $\bar{1}$, No. 2). The two forms exhibit dimers of BTCA molecules, joined by the hydrogen-bonded acid–acid homosynthon, which interact through C–H⋯O hydrogen bonds to produce tapes. These tapes are further connected through head-to-tail π⋯π and edge-to-face C–H⋯π interactions in BTCA-Form II to create a complex 3D structural arrangement. On the other hand, in BTCA-Form I and in the related furane derivative (BFCA), only π⋯π interactions are present. Energy frameworks analysis proved to be useful in identifying the structural differences between the polymorphs of BTCA and BFCA.
ACKNOWLEDGEMENTS
Access to the Cambridge Structural Database (CSD) for Universidad de Los Andes (Venezuela) was possible through the Frank H. Allen International Research & Education Programme (FAIRE) from the Cambridge Crystallographic Data Centre (CCDC).
SUPPLEMENTARY MATERIAL
The supplementary material for this article can be found at https://doi.org/10.1017/S0885715620000755.


