Introduction
The Antarctic continent can with justification be described as the coldest, highest, driest, windiest and most isolated landmass on Earth. The extreme conditions found in Antarctica not only pose problems for the organisms that live there but also for researchers carrying out fieldwork. One technique that has proved particularly useful when studying vegetation performance is the use of chlorophyll fluorometers. A major advantage of the technique is that it is non-contact and it is possible to measure samples in their natural habitat. The vegetation in Antarctica is, with the exception of the presence of two vascular plants in the Antarctic Peninsula (Convey Reference Convey2013), dominated by lichens and bryophytes all of which are poikilohydric meaning that they are only metabolically active when hydrated. Chlorophyll fluorescence, therefore, offers the possibility to establish when and how often the vegetation and its components are metabolically active. Chlorophyll fluorometers have advanced substantially in recent years and can be operated in the field either by hand in detailed but usually short (weeks) studies (Schlensog et al. Reference Schlensog, Green and Schroeter2013) or automatically over long periods (years) but usually on a small number of samples (Schroeter et al. Reference Schroeter, Green, Pannewitz, Schlensog and Sancho2010). Because ambient environmental conditions can be recorded concurrently with fluorescence parameters it becomes possible to look at links between activity and climate.
Antarctica provides excellent opportunities for investigating links between vegetation and climate. Since the continent spans a large latitudinal range of 26.5° from the South Pole to the extreme northerly point, Trinity Peninsula, of the Antarctica Peninsula at 63.5°S, large gradients exist within it for both climate and vegetation (Wagner et al. Reference Wagner, Trutschnig, Bathke and Ruprecht2017). Temperature and precipitation both change substantially with latitude. Temperature rises and temperature range declines as one moves north from the Dry Valleys (77°40'S; mean: -19.8°C, range: 45°C) to Livingston Island, South Shetland Islands, Antarctic Peninsula (62°39'S; mean: -1.5°C, range: 11.0°C) (Sancho et al. Reference Sancho, Green and Pintado2007). Mean temperatures for the Dry Valleys and Livingston Island for the warmest months are -4.8°C and 1.3°C, respectively, and for the coldest months -30.5°C and -7.0°C, respectively (Sancho et al. Reference Sancho, Green and Pintado2007). Annual precipitation increases from the very dry 50 mm (rain equivalent) in the Dry Valleys to c. 800 mm at Livingston Island (Wagner et al. Reference Wagner, Trutschnig, Bathke and Ruprecht2017).
The terrestrial vegetation also shows three major clines. First, the decline in species numbers (Peat et al. Reference Peat, Clarke and Convey2007), where there is a clear fall in numbers southwards along the Antarctic Peninsula to a species depauperate situation in the Ross Sea. Second, the decrease in vegetation extent from almost complete cover in the South Shetland Islands, north-west of the Antarctic Peninsula, to sporadic patches along the Ross Sea coast as far south as 85°S (Green et al. Reference Green, Schroeter and Sancho2007, Cannone & Seppelt Reference Cannone and Seppelt2008). Third, the growth rate that is almost two orders of magnitude higher in the Antarctic Peninsula than in the McMurdo Dry Valleys for lichens (Sancho et al. Reference Sancho, Green and Pintado2007). All three of these vegetation clines have their maxima in the northern Antarctic Peninsula, an area which, far from being at the physiological limits of survival for vegetation (Robinson et al. Reference Robinson, Wasley and Tobin2003), is probably one of the better environments in the world for lichens and bryophytes as indicated by their high growth rates (Sancho et al. Reference Sancho, Green and Pintado2007). A similar cline in soil fungal diversity appears to be strongly positively linked to surface air temperature along the Antarctic Peninsula (Newsham et al. Reference Newsham, Hopkins, Carvalhais, Fretwell, Rushton, O’Donnell and Dennis2015).
Previous studies using chlorophyll fluorescence to monitor vegetation activity has shown an increase in length of activity as one moves north in Antarctica. Annual activity (% of total time) ranged from 0.2% (Umbilicaria aprina Nyl.) in the Dry Valleys (Raggio et al. Reference Raggio, Green and Sancho2016) through 4.6% for the same species at Botany Bay (77°00'S) (Schroeter et al. Reference Schroeter, Green, Pannewitz, Schlensog and Sancho2011) to 45.6% for Usnea aurantiaco-atra (Jacq.) Bory on Livingston Island (Schroeter et al. Reference Schroeter, Green, Pannewitz, Schlensog and Sancho2010). At Léonie Island (67°36'00''S, 68°21'00''W), over a 21 day summer period, mosses and a liverwort in a flush were active 80–100% of the time, while lichens, which were confined to rocky substrates together with one moss species, achieved between 20% and 40% activity (Schlensog et al. Reference Schlensog, Green and Schroeter2013). Léonie Island lies c. 570 km south of Livingston Island in the southern west side of the Antarctic Peninsula and enjoys a similar Maritime Antarctic climate with mean temperatures in summer months above freezing point. However, Léonie Island lies south of the cloud belt that almost continually covers Livingston Island so that skies there are often clear. This climate means that species hydrated by meltwater can be active under high light levels, for example when a mean photosynthetic active photon flux density (PPFD) of 350–400 µmol m-2 s-1 occurred. Even higher PPFD are reported from Botany Bay with mean levels when active of 880 µmol m-2 s-1 and instantaneous PPFD reaching 2748 µmol m-2 s-1 (Schroeter et al. Reference Schroeter, Green, Pannewitz, Schlensog and Sancho2011). A second consequence of reliance on meltwater is that temperatures when active can be very similar at very geographically distant locations, e.g. c. 2°C at both Livingston Island and Botany Bay although mean annual temperatures were -1.5°C and -18°C, respectively (Schroeter et al. Reference Schroeter, Green, Pannewitz, Schlensog and Sancho2010).
Differences in duration of metabolic activity occur mainly in xeric environments in which activity depends on snow melt plus an increasing contribution from precipitation as one moves north (Green et al. Reference Green, Sancho, Pintado and Schroeter2011). In hydric environments, where hydration remains high because of a substantial and consistent water supply, activity duration is close to or at 100% in summer for long periods and independent of latitude. Therefore, in Taylor Valley where the habitat is so dry that almost no lichens occur, large extents of mosses are found where high and reliable water availability coincides with other site characteristics such as protection from wind (Schwarz et al. Reference Schwarz, Green and Seppelt1992), and these show continual activity for weeks in summer (Pannewitz et al. Reference Pannewitz, Green, Scheidegger, Schlensog and Schroeter2003). There is also a functional type difference between xeric and hydric environments that is driven by a difference in the basic physiology of gas exchange between bryophytes and lichens (Green & Lange Reference Green and Lange1994). In general, lichens dominate in the drier environments whereas habitats in which there are high quantities of liquid water, e.g. flush areas, have only bryophytes present (Schlensog et al. Reference Schlensog, Green and Schroeter2013). High water contents have little effect on the photosynthetic rates of the bryophytes (Proctor Reference Proctor2008) but can cause massive depressions in lichens due to CO2 diffusion limitations brought about by lichen morphology (Green et al. Reference Green, Nash and Lange2008).
In this paper, the comparative chlorophyll fluorescence monitoring studies are expanded further north to Livingston Island. Seven moss species and four lichen species were monitored growing in two main habitats, a continually moist flush area (hydric) and on rock (xeric) surfaces.
Our expectations in comparison with published studies from more southern sites were that:
-
i) The length of time that the cryptogams are metabolically active at Livingston Island in xeric habitats will be longer than at southern sites mainly as a result of more extensive hydration from precipitation.
-
ii) A strong contrast will still be found between hydric and xeric communities in the length of metabolic activity and the potential carbon gain.
-
iii) Life form (e.g. bryophyte versus lichen) will still influence the activity patterns.
-
iv) In contrast to other more southern sites, environmental conditions when active will differ little from the macroclimate because of generally stable temperature and low light.
-
v) Differences in thallus temperature at sites across Antarctica when the organisms are metabolically active are small in comparison to differences in the air temperature and in the length of thallus hydration.
Materials and methods
Location and species
The research site was located in the vicinity of the Spanish Juan Carlos I Station at South Bay, Livingston Island, South Shetland Islands (62°39'46''S, 60°23'20''W; Fig. 1). South Bay is known to be a rich area for vegetation and 187 species of lichen and 59 bryophytes have been reported from the area (Sancho et al. Reference Sancho, Schulz, Schroeter and Kappen1999, Søchting et al. Reference Søchting, Øvstedal and Sancho2004). In addition, both Antarctic phanerogams (Deschampsia antarctica Desv. and Colobanthus quitensis (Kunth) Bartl.) are abundant (Vera Reference Vera2011). At sites with a regular water supply, a lush bryophyte vegetation forms extensive cushions (‘tall moss cushion subformation’ of ‘Antarctic nonvascular cryptogam tundra formation’; Smith Reference Smith1996) with Brachythecium austrosalebrosum (Müll. Hal.) Kindb., Pohlia nutans (Hedw.) Lindb., Bryum pseudotriquetrum (Hedw.) Gaertn., Meyer et Scherb. and Sanionia uncinata (Hedw.) Loeske. Dry habitats on rock and scree are mainly dominated by fruticose and foliose lichens (Usnea spp. and Umbilicaria spp.), occasionally interspersed with mosses of the short cushion form such as Andreaea gainii Card., and can be assigned to the ‘fruticose and foliose lichen subformation’ of the ‘Antarctic non-vascular cryptogam tundra formation’ (Smith Reference Smith1996). Further details are shown in Table I.
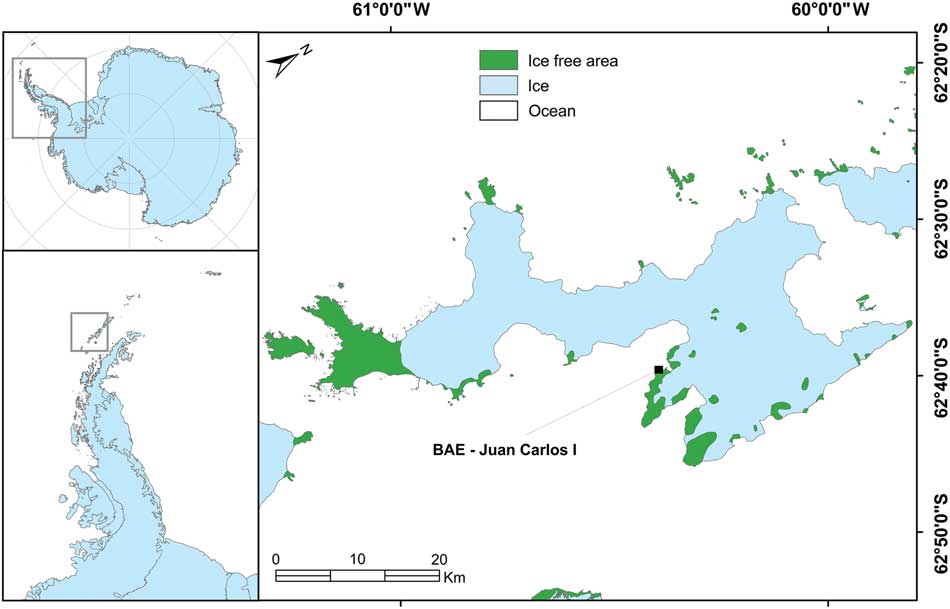
Fig. 1 Map showing the location of the research site adjacent to the Juan Carlos I Station on Livingston Island in the South Shetland Islands to the west of the Antarctic Peninsula.
Table I Site details for 21 samples at the research site at South Bay, Livingston Island, South Shetland Islands, Maritime Antarctica. Sites details include percentage of active time during the measuring period, surface (rock, rock crevice or scree), height above ground (cm), aspect (compass degrees), light conditions (open or shady) and an estimate of the environmental water status (dry or moist).

The research area was divided into two sites that were on opposite sides of the station and c. 50 m distant from it. The ‘hydric site’ was a flush at the side of a meltwater stream sourced on nearby Mount Reina Sofia. The meltwater flowed continuously but showed a daily rhythm with maximal volumes in the late afternoon and minima in the early morning. The vegetation was composed mainly of moss species forming large cushions (Fig. 2a). The ‘xeric site’ was the surface of a free-standing rock, c. 2 m in height which did not receive any meltwater, was hydrated by precipitation (snow or rainfall) and was covered in mainly fruticose and foliose lichens (Fig. 2c). Details of the actual samples are given in Table I. Twenty-one samples were selected. Six samples (A–F) were from the hydric site and were made up of two samples of Brachythecium austrosalebrosum and one each of Bryum pseudotriquetrum, Bryum archangelicum Bruch & Schimp., Bartramia patens Brid. and S. uncinata. Fifteen samples (G–U) were studied at the xeric site made up of four lichen and three moss species. Five samples were selected of the common lichen Usnea aurantiaco-atra, one each of Usnea antarctica Du Rietz and Umbilicaria antarctica Frey & I.M. Lamb, and two of the foliose species Parmelia saxatilis (L.) Ach. (Table I). The three moss species were A. gainii (two samples), Bartramia patens (two samples) and Hymenoloma crispulum (Hedw.) Ochyra (one sample). For the rock sites, details were also recorded for height above ground (cm), aspect (compass degrees), surface (rock, rock crevice or scree), a summary of light conditions (open or shady) and an estimate of the environmental water status (dry or moist) (Table I). Permits for the research came from the Spanish Polar Committee (reference number: CPE-EIA-1999B).
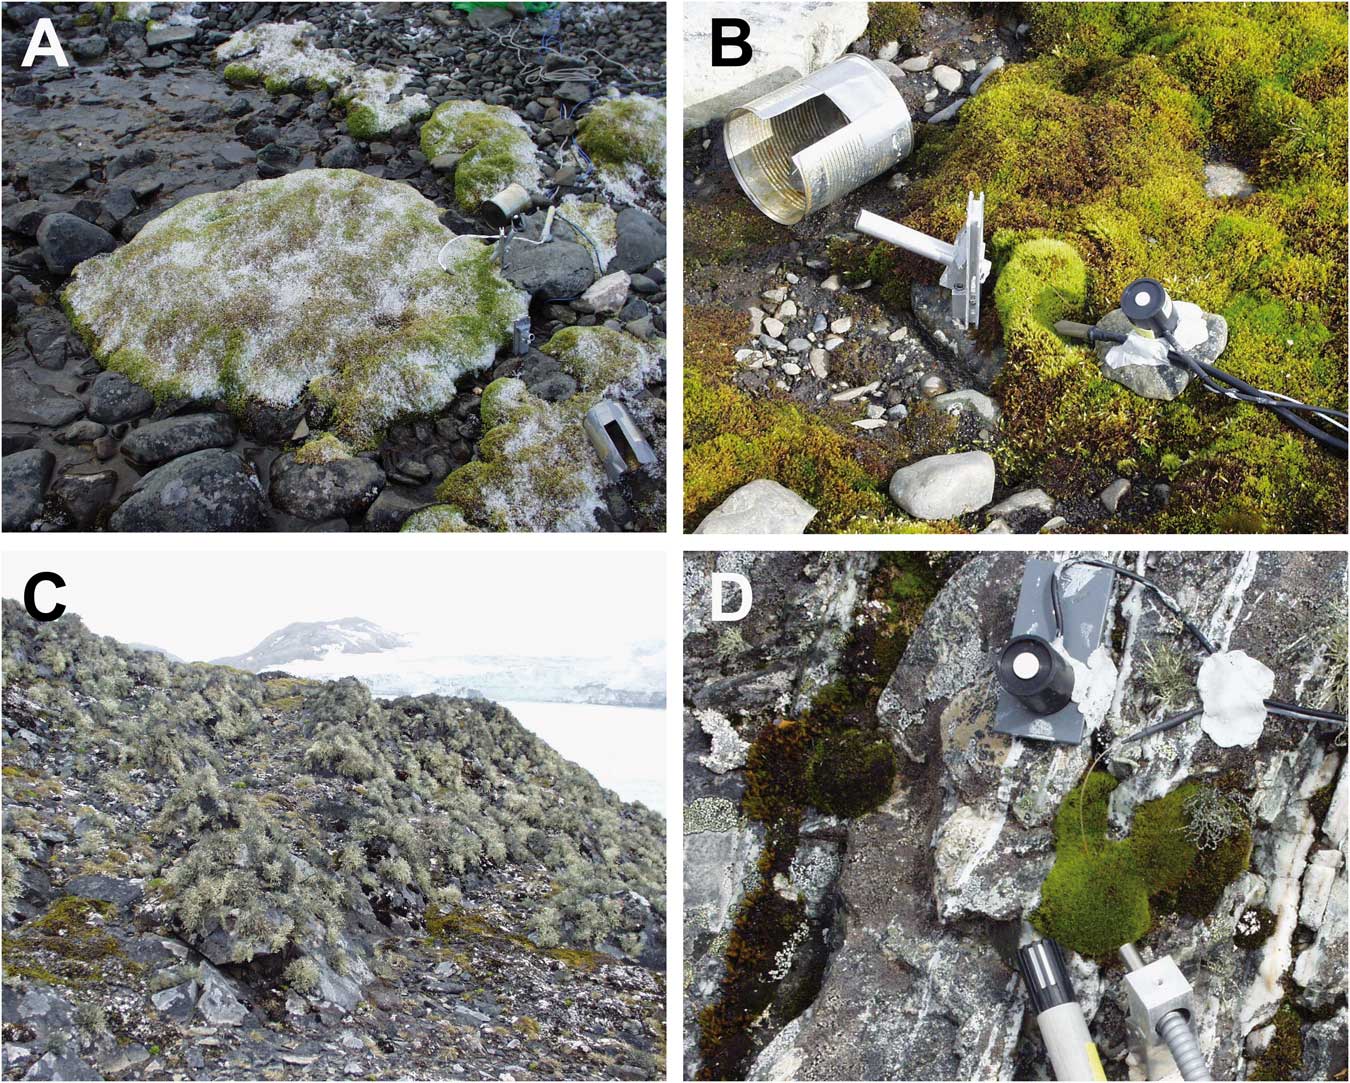
Fig. 2a Flush site by stream dominated by mosses. b. A measuring site in the flush showing the holder for the fibre optic when making measurements, the tin used to darken the sample immediately after effective yield had been measured in ambient light and the temperature and light sensors. c. The rock on which samples G to U were growing. d. Close up of the moss Hymenoloma crispulum growing on the rock and showing light, temperature and relative humidity sensor locations.
Chlorophyll a fluorescence measurements
Diel measurements of the chl a fluorescence of Photosystem II (PSII) were made for 18 days (6–23 February 2003, inclusive) at 2–3 h intervals using a pulse-amplitude modulated fluorometer Mini-PAM (Walz, Germany). Specially designed fibre optic locators that are fully described in Schlensog & Schroeter (Reference Schlensog and Schroeter2001) were installed beside each sample (Fig. 2b) and this ensured that all measurements were made at exactly the same point, and at exactly the same distance from the thalli. The measuring procedure was identical to that of Schlensog et al. (Reference Schlensog, Green and Schroeter2013). First, the effective fluorescence yield of PSII of all samples in sequence (A–U) at ambient light were measured using the standard machine protocol that measured minimal fluorescence (F) with a dim modulated light followed by maximal fluorescence (Fm’) by applying a pulse of saturating light. Effective quantum yield of PSII (ΦPSII) was then calculated as:
 $$\Phi _{{{\rm PSII}}} \, {\equals}\, \left( {{\rm Fm}’ -{\rm F}} \right)/{\rm Fm}’ \, {\equals}\, \Delta {\rm F}/{\rm Fm}’ .$$
Immediately after this measurement each sample was darkened for at least 20 min using modified cans (Fig. 2b), followed by determination, in the same order, of the maximal quantum efficiency of PSII (Fv/Fm) in the dark-adapted state. The special fibre holders meant that the measurements could be made without removing the cans. Although not specifically checked, we believe that the low insolation coupled with the generally high air humidity meant that the brief darkening periods necessary to determine Fv/Fm had minimal to no effect on the drying of the thalli.
The experimental setup meant that both Fm (maximal yield after dark adaptation) and Fm’ (maximal yield in the light) could be calculated with the fibre optic at a constant distance from the sample. This allows non-photochemical quenching (NPQ=(Fm – Fm’) – 1) to be calculated. This is an indicator of the amount of energy being removed from the chlorophyll antenna and acts to protect the integrity of the photosystems (Müller et al. Reference Müller, Li and Niyogi2001).
Microclimate measurements
Microclimatic conditions, i.e. air and thallus temperatures, light and relative air humidity, were measured over the same period as the chlorophyll fluorescence. Microthermistors (diameter 0.6 mm) and thermocouple probes were used for the thallus temperature measurements. The small diameter of the probes and their location within the thallus mass of the samples minimized warming from incident radiation; microthermistors used for air temperature measurements were also shielded from direct radiation. The PPFD (µmol m-2 s-1) was measured with PPFD sensors calibrated against a LiCOR 190 SB probe (LiCOR, USA) using an optical calibration unit (LiCOR Li 1800; see Pontailler Reference Pontailler1990). Previous studies had shown that these probes retained their calibration for more than 1 year. The PPFD sensors were always fixed adjacent to, and at the same exposure angle as, the investigated cryptogam thallus (Fig. 2b & d). Limitations in the data logger meant that PPFD was recorded only over the range 0–2000 µmol m-2 s-1. Air humidity was measured using Vaisala capacity probes (HMP35A; Vaisala, Finland). The microclimatic data were logged at 30 minute intervals using Squirrel data loggers (Grant, UK).
Other macroclimate data, air temperature and relative humidity were obtained from the meteorological station at the Juan Carlos I Station (www.aemet.es BAE Juan Carlos I. WMO 89064). Unfortunately, no data for incident radiation were available for this research period.
Data handling
The datasets from the chl a fluorescence and microclimate data loggers were aligned to give thallus and air temperatures, relative humidity and incident PPFD for each fluorescence determination. The chl a fluorescence can provide a measure for activity of the thalli as poikilohydric organisms give no chl a fluorescence yield signal when they are desiccated. The decline in absolute signal strength combined with normal signal variability means that low Fv/Fm values for the ratio are unreliable. However, the relatively rapid transition in Fv/Fm when thalli were wetting or drying meant that an Fv/Fm of 0.2 could be selected as the lowest reliable value. An active thallus is, therefore, defined as having an Fv/Fm of ≥ 0.2 (Schlensog et al. Reference Schlensog, Green and Schroeter2013). Activity, defined as the proportion (%) of the time that the thalli were active, was calculated as active time/total time of measurements. Livingston Island lies just outside the Antarctic Circle, so the length of the night (time between sunset and sunrise) was c. 7.5 h and PPFD parameters were calculated only for diurnal values (PPFD of ≥ 1 µmol photons m-2 s-1).
Statistical analysis
XLStat (Addinsoft) was used to carry out most statistical testing; the standard options used were nonparametric tests of two groups or by pairs (Wilcoxon–Mann–Whitney test), Pearson correlations, factor analysis and principle components analysis.
Results
Macroclimate
Over the experimental measurement period (6–23 February, 2003) the cloud cover was complete (8/8; Fig. 3, inset) for 78.4% of the time and with 50% or less cloud cover for only 7%. Rain occurred during 30% of the readings and fell on 11 of the 18 days; even so, there was a 4 day dry period from 14–17 February inclusive (Fig. 3). Consequently, the macroclimate at the research site was very stable. Mean air temperature from the Juan Carlos I climate station over January and February was 2.68±0.8°C (±s.e.) with a maximum daily mean of 5.06°C (1 January) and a minimum of 1.45°C (15 February) (Fig. 3). Over the research period, mean daily air temperature of samples was 2.39±0.13°C. Mean daily relative humidity (%) was also stable and high with a mean for January and February of 80±1.6%, and a maximum and minimum of 89.2% and 64.7% (20 February and 27 January, respectively; Fig. 3). Incident light was only available for the measurement period from the probes adjacent to the samples. The stream site is relatively flat and the light sensors there would be expected to give the best indication of incident global light. Mean incident light for the six stream sites over the measurement period was 265.8±12.2 µmol m-2 s-1 with the highest mean values >400 µmol m-2 s-1 (9 and 24 February) and the lowest 56.5 µmol m-2 s-1 on 18 February (Fig. 3). The median for the incident light was 143.0 µmol m-2 s-1 (54% of the mean) showing the large effect of the occasional high light events when calculating the mean (Table II).
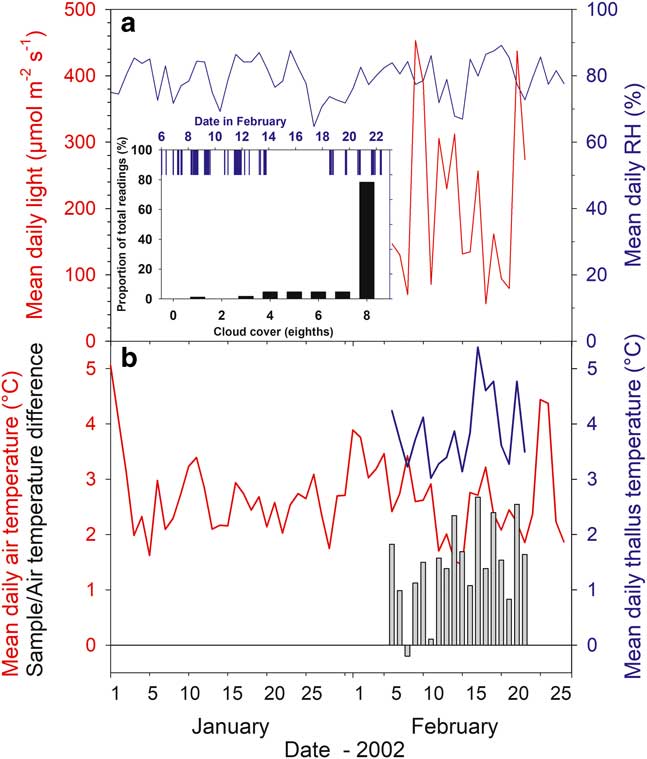
Fig. 3 Climate (meteorological station, Juan Carlos I Station) and microclimate data from the measuring period. a. Mean daily relative humidity (RH) (%, blue line) and mean daily incident light (µmol m-2 s-1, red line). Inset: bar height indicates proportion of the readings (%) at different cloud cover (black; 8 is full cover) and rain fall (blue). b. Mean daily air (°C, red line) and thallus temperatures (°C, blue line), and difference between mean daily air temperature and mean daily thallus temperature (°C, vertical bars). Data from sample T (Hymenoloma crispulum).
Table II Incident light (µmol m-2 s-1) and temperature (°C) data for all samples at Livingston Island, Léonie Island and Botany Bay, and hydric and xeric sites include data from Livingston and Léonie islands.
a From Schlensog et al. (Reference Schlensog, Green and Schroeter2013) for 4 weeks from 21 January 1998 to 17 February 1998.
b From Schroeter et al. (Reference Schroeter, Green, Pannewitz, Schlensog and Sancho2011) for active periods in February and December 2001.
Microclimate
Mean temperatures of the 21 samples ranged from 2.68°C (moss, Brachythecium austrosalebrosum by the stream) to 5.26°C (moss, A. gainii on rock). Over the measurement period the mean temperature for all samples was 3.51±0.14°C, which was 1.12±0.22°C warmer than the mean air temperature for the same period. Mean temperatures were also significantly warmer for samples on the rock compared to the stream (3.69±0.14°C and 3.23±0.16°C, respectively, P≤0.0001; see Table S1 found at http://dx.doi.org/10.1017/S095410201700027X). There was a small but highly significant difference between mean and median temperatures (overall the medians were 0.24 K lower than means; P≤0.00001; pair comparison). There was no significant difference between median temperatures of bryophytes and lichens, but medians for samples on the rock were significantly higher than at the stream (P=0.026; 3.75±0.17°C and 3.15±0.12°C, respectively).
Mean incident light for samples at the stream was significantly higher than samples on the rock (P=0.001; 265.8± 12.2 µmol m-2 s-1 and 147.9±10.7 µmolm-2s-1, respectively). Medians for incident light for each sample were significantly lower than the means (P≤0.00001; 107.0 and 204.7 µmol m-2 s-1, respectively) indicating again that the occasional occurrences of high incident light, reaching 2000 µmol m-2 s-1, have a marked effect when calculating the mean values (Table II).
Photosystem II activity
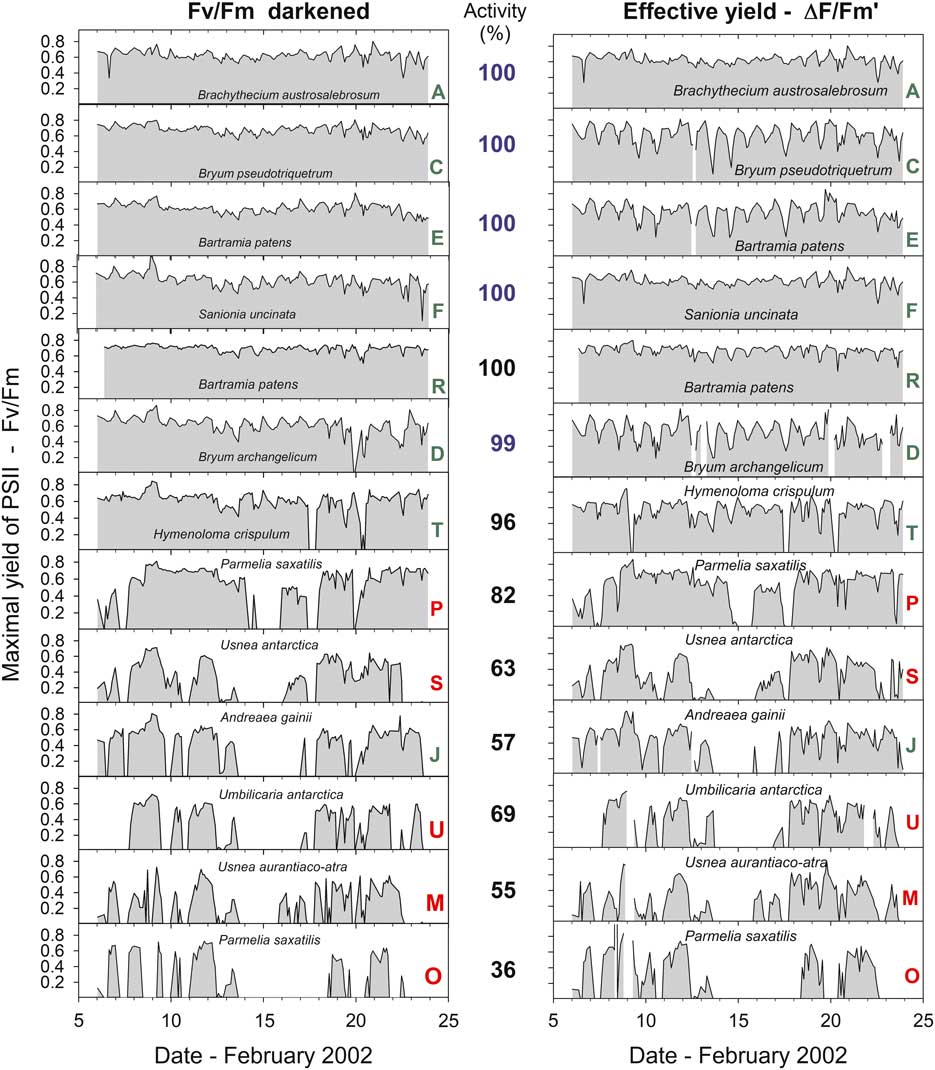
Sample activity (% of total measurements active) over the 18 day period of measurements ranged from 100% to 32.7% (Table I). The daily patterns of activity are shown in Fig. 4 and the high activity rates were observed for the first six samples (A–F), which are the mosses at the stream site. Lichens and mosses on the rock (samples F–U) showed lower activity, except for the three samples that were in rock crevices (R and I, Bartramia patens, a moss, and P, Parmelia saxatilis, a lichen), which also had very high activity (82.1–100.0%, Table I). Three main habitats can be distinguished: the stream, the rock surface and rock crevices. Mean activity of the stream samples was significantly higher than samples on the rock (98.8±0.20% and 65.95±5.43%, respectively; P=0.001). Mosses at all sites were more active than lichens (91.0±4.4% and 55.1±5.1%, respectively; P=0.001) and this was also true for mosses and lichens on the rock (82.2±7.4% and 55.1±5.1%, respectively; P=0.022).

Fig. 4 Maximal yield of Photosystem II (Fv/Fm) measured after dark adaptation and effective yield of PSII (measured in ambient light) for 13 of the 21 samples measured over the entire study period from 6–24 February 2002. Green letters indicate a moss and red indicate a lichen. The mean activity (% of total time active) is shown between the two panels. Numbers in blue indicate the stream area and black the rock surface (samples R and P were in a crevice).
Microclimate when active and inactive
The distribution of temperatures, when active and inactive, are shown for 1°C categories (i.e. data for 2.5°C is the number of readings >1.5°C up to 2.5°C) in Fig. 5a. The largest categories are 3.5°C and 4.5°C with the single exception of A. gainii with 5.5°C. Despite these low values out of a total of c. 3400 data points for all samples only 22 are below 0°C with an absolute minimum of -0.65°C (sample F). Only two subzero data points occur for samples on the rock. Box plots of the distribution of median temperatures when active in the light are given in Fig. 6a and emphasize the generally low temperatures with 75% of all readings <6°C. Mean temperatures when active (for all samples) was 0.55°C and significantly lower than when inactive (3.48±0.19°C vs 4.04±0.31°C, respectively). In the light, mean temperatures were slightly warmer when inactive (4.22±0.34°C) compared to when active (3.61±0.19°C; P=0.002). Mean temperatures when active in the dark were 0.67 K lower than when active in the light (2.93±0.21°C vs 3.61±0.19°C; P=0.000). The constancy of the thermal environment is indicated by the small, all <1 K, differences in the temperature comparisons which were, however, all very highly significant.
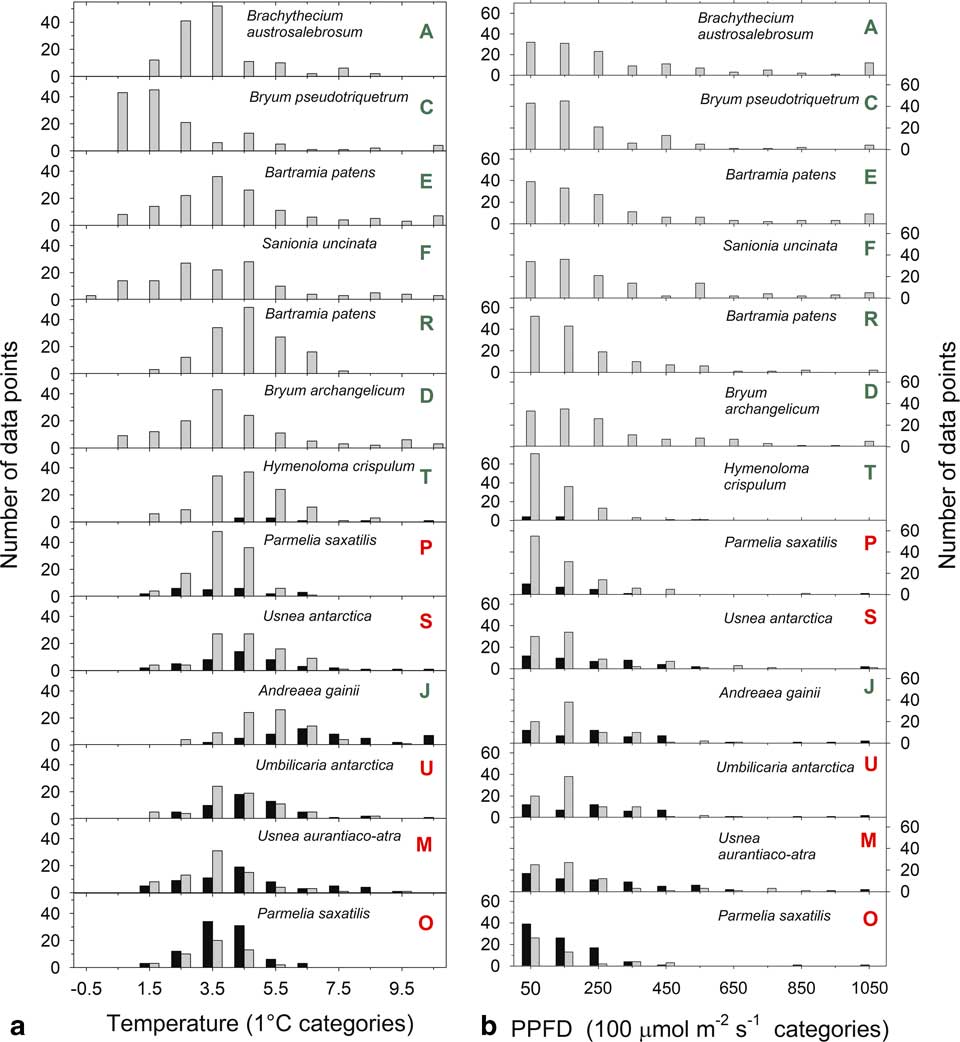
Fig. 5 Distribution of a. thallus temperatures (in 1°C categories starting at up to -0.5°C) and b. light (in 100 µmol m-2 s-1 categories) while active (grey bars) or inactive (black bars) for 13 of the 21 samples measured over the entire study period from 6–24 February 2002. The bars represent the number of measurements within each band. Green letters indicate a moss and red indicate a lichen.
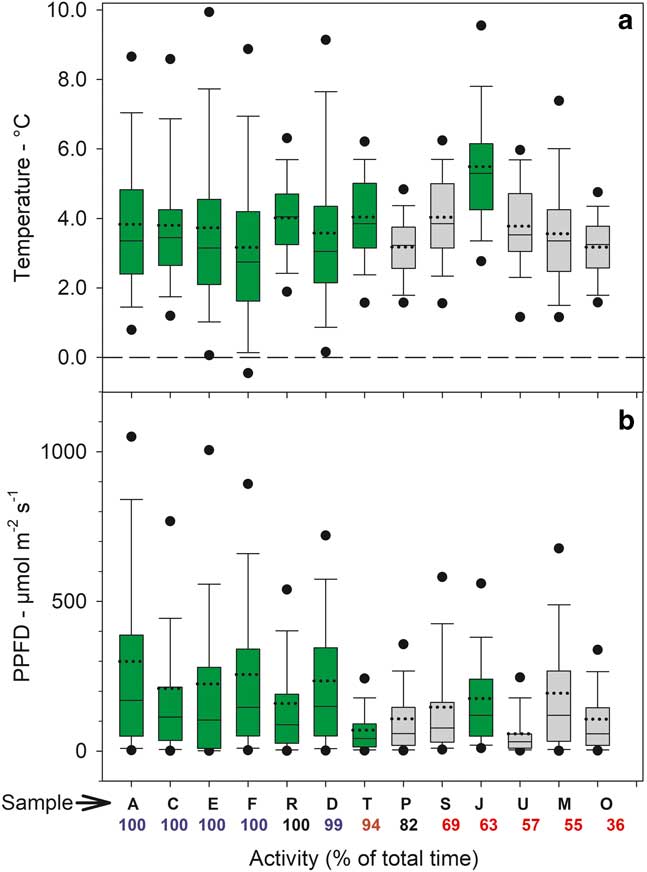
Fig. 6 Box plots of sample a. temperature in the light and b. incident light (zero values not included) for 13 of the 21 samples measured over the entire study period from 6–24 February 2002. Green bars=mosses, grey bars=lichens. Sample site and activity are given below each bar (see Table I and Fig. 4). The ends of the boxes define the 25th and 75th percentiles, the dotted line is the mean and solid line the median, the error bars define the 10th and 90th percentiles and the dots indicate the 5th and 95th percentiles.
The distribution of incident light when active and inactive are shown in Fig. 5b. Data are presented in 100 µmol m-2 s-1 categories (except for the first category which is 0–50 µmol m-2 s-1) and most data are concentrated <250 µmol m-2 s-1. Only 210 out of 1856 (11%) readings were >450 µmol m-2 s-1 and only 2.5% were >1050 µmol m-2 s-1. The overall low light levels are emphasized by box plots of incident light levels when active (Fig. 6b) with all medians lying <200 µmolm-2s-1. For those samples which were not 100% active mean light levels are lower when active (127.9±11.2 µmol m-2 s-1) than when inactive (169.2±18.5 µmol m-2 s-1; P=0.013). There is a significant positive relationship between mean light level when active and activity (% time active; P=0.0079) (Fig. 7).
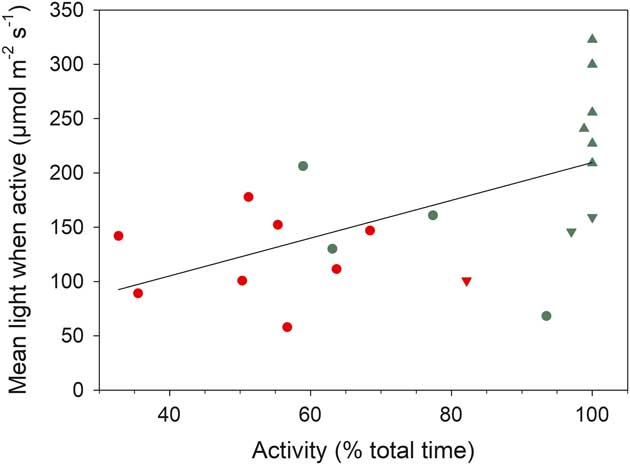
Fig. 7 Relationship between mean light when active (µmol m-2 s-1) and activity (% of total time active) for all samples. Red represents lichens and green represents mosses. Circles=rock (xeric) site, triangles=stream (hydric) site, upside down triangles=rock crevice. Fitted line is significant, P=0.0079, r 2 =0.317.
Factor analysis
A factor analysis was carried out using the mean values for activity, light and temperature (Fig. 8). Together, factor 1 (66.7%) and factor 2 (23.3%) accounted for 90.2% of variation. All temperature variables correlated strongly with factor 1 (r>0.930 for all variables) and two specimens of A. gainii were also differentiated as might be expected from their high mean temperatures (Table I). Activity correlated with factor 2 (r=0.566), as did all light variables (all temperatures in light, r=0.804; light level when active, r=0.873). Lichens and moss specimens are also mainly separated on this axis, as is substrate type, stream from rock with crevices being intermediate (Fig. 8).
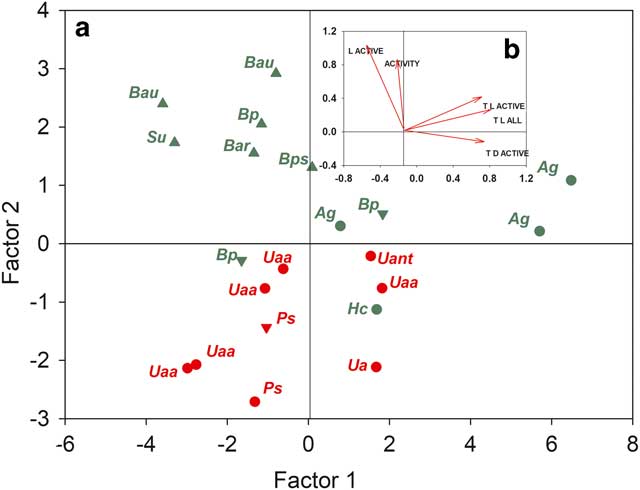
Fig. 8a Factor analysis of the 21 samples (note different scales for factors). b. Mean values for all samples of the factors ACTIVITY (% of full time active), L ACTIVE (light level when active), T L ACTIVE (temperature in light when active), T L ALL (all temperatures in light) and T D ACTIVE (temperatures when active in the dark) plotted against factor 1 and factor 2 which together accounted for 92.23% of total variability. Abbreviations: Ag=Andreaea gainii, Bar=Bryum archangelicum, Bau=Brachythecium austrosalebrosum, Bp=Bartramia patens, Bps=Bryum pseudotriquetrum, Hc=Hymenoloma crispulum, Ps=Parmelia saxatilis, Su=Sanionia uncinata, Ua=Umbilicaria antarctica, Uaa=Usnea aurantiaco-atra, Uant=Usnea antarctica. Triangles represent the stream, upside down triangles represent a crevice on the rock, circles represent the surface of the rock. Red represents lichens and green represents mosses.
Chlorophyll a fluorescence parameters: Fv/Fm, non-photochemical quenching
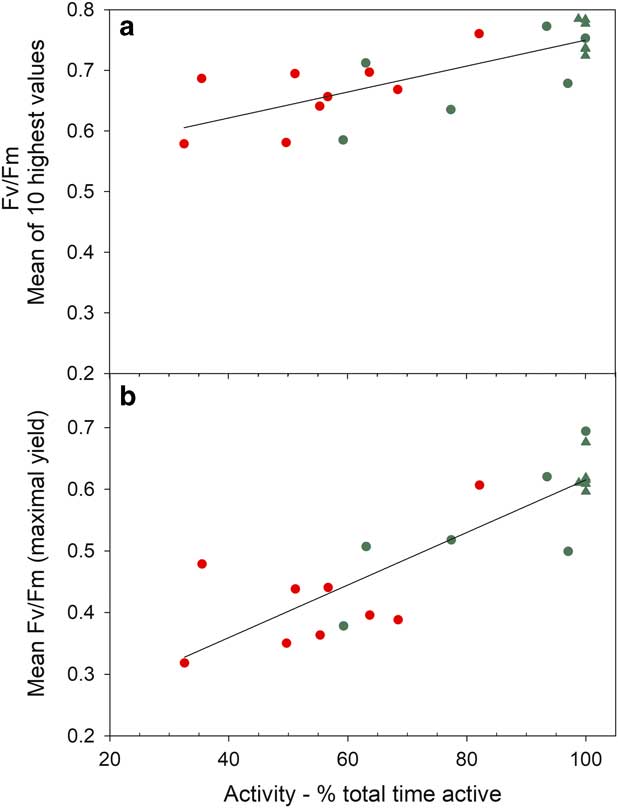
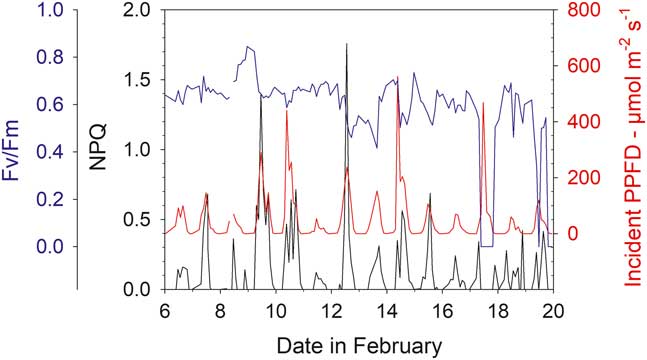
Mean Fv/Fm calculated for the entire measurement period show a wide range from 0.694 (sample R, Bartramia patens) to 0.318 (sample H, Usnea aurantiaco-atra) and have a strong linear relationship with the mean activity (Fig. 9; P<0.0001, r 2=0.721). This relationship is maintained if the means of the ten highest Fv/Fm are used for each sample (Fig. 9; P<0.0001, r 2=0.550). The highest values are for the stream samples, which are all mosses, and the lower values are for lichens on the rock. However, samples on the rock contribute the highest (100%) and lowest mean activities while both mosses and lichens are also spread along the relationship (Fig. 9). There was no significant relationship between mean Fv/Fm and mean incident light when active or mean temperature when active (data not shown). The NPQ tracks incident light and is highest at times of high light and zero during the night (Fig. 10). Values for NPQ are within the range normally found for higher plant leaves (0–1.5).

Fig. 9 Mean of a. ten highest values for Fv/Fm (P<0.0001, r 2 =0.550) and b. all Fv/Fm (P<0.0001, r 2 =0.721) plotted against activity (% total time) for each sample. Circles represent samples on the rock and triangles are samples in the flush area. Red represents lichens and green represents mosses.

Fig. 10 Maximal yield (Fv/Fm, blue), non-photochemical quenching (NPQ, black) and incident light (PPFD, red) for sample T (moss, Hymenoloma crispulum) for the measuring period 6–20 February 2002.
Discussion
Overview
The north-west Antarctic Peninsula and associated islands (South Shetland Islands) have a climate that is very different from the rest of the Antarctic, being characterized by a strong maritime influence, high cloud cover and greater precipitation often as rain in summer (Wagner et al. Reference Wagner, Trutschnig, Bathke and Ruprecht2017). The presented results, activity and concurrent environmental data for a variety of species at Livingston Island, extend our knowledge of biodiversity and performance across Antarctica and allow for comparisons to be made with other sites extending as far south as the Dry Valleys in southern Victoria Land (78°02'S). Activity periods are longer as one moves north and this is particularly true for xeric environments as colonization of open sites where activity is supported by precipitation rather than by snow melt processes is an important feature of the vegetation as one moves north along the peninsula (Green et al. Reference Green, Sancho, Pintado and Schroeter2011). Similar relationships between hydration duration and activity have been found for nematodes in the Dry Valleys (Treonis et al. Reference Treonis, Wall and Virginia2000). Growth form is also of great importance (Schlensog et al. Reference Schlensog, Green and Schroeter2013). Mosses dominate the very wet areas where water flows occur from glacier or snow pack, while lichens predominate in the xeric environments. However, in the north, mosses with a cushion growth form that allows water storage and the capture of precipitation appear on rocks. Cushions are known to improve water relations for mosses (Zotz et al. Reference Zotz, Schweikert, Jetz and Westerman2000). Similarly, locations within xeric sites where precipitation can be concentrated, e.g. rock crevices, are sites of high activity for both mosses and epiphytic lichens.
High light is potentially a major stress for active vegetation within Continental Antarctica as meltwater becomes confined to periods of high insolation (Table II). Temperature when active, despite the obvious extremes known for Antarctica, are very similar at all sites and typically in the range 2–5°C. This is a consequence of the entire vegetation being poikilohydric with activity requiring liquid water, which only becomes available in quantity above the freezing point. However, as one moves south greater temperature extremes occur while active, both warmer (up to 26°C at Léonie Island) and colder (-9.1°C at Botany Bay), although at Livingston and Léonie islands the lowest temperatures are still >-1°C indicating that actual freezing does not occur (Table II).
Activity duration
It has been proposed that one of the determinants of overall terrestrial productivity across Antarctica is the length of the activity period, which is suggested to increase from south to north in line with improved climate (Green et al. Reference Green, Sancho, Pintado and Schroeter2011). Information is now available for metabolic activity duration from long-term monitoring studies at Livingston Island (this site), Botany Bay (Schroeter et al. Reference Schroeter, Green, Pannewitz, Schlensog and Sancho2011) and the Dry Valleys (Raggio et al. Reference Raggio, Green and Sancho2016), and a study similar to the present one is available for Léonie Island (Schlensog et al. Reference Schlensog, Green and Schroeter2013). The present study for c. 3 weeks in summer gives an overall activity of 75.6% for 21 samples consisting of four lichen and seven moss species (Footnote Table I). This falls to 61.2% at Léonie Island for 15 samples composed of five lichen, seven moss and three liverwort species (Schlensog et al. Reference Schlensog, Green and Schroeter2013). It is difficult to calculate mean activity for the single lichen species, Umbilicaria aprina, monitored at Botany Bay (Schroeter et al. Reference Schroeter, Green, Pannewitz, Schlensog and Sancho2011) because of the very high interannual variability. For example, December 2002 and 2003 had activities of 8.0% and 80.2%, respectively, while in February 2001 and 2002 the active periods were 28.7% and 0%, respectively. Typically, in most months, activity is well below 10%. In Garwood Valley (78°02'S) summer activity was 0.2% for Umbilicaria aprina and 1.7% for Caloplaca sp. (Raggio et al. Reference Raggio, Green and Sancho2016).
Comparisons of individual species also show that Livingston Island has higher activities than Léonie Island. The respective activities are for lichens: 56.7/25.2% (Umbilicaria antarctica), 68.5/32.7% (Usnea antarctica); and for mosses: 100.0/100.0% (Bryum pseudotriquetrum), 100.0/96.5% (S. uncinata), 100.0/85.8% (Brachythecium austrosalebrosum), and 74.1/37.0% (A. gainii).
The overall trend that activity increases northward in Antarctica is strongly supported.
Life form
Schlensog et al. (Reference Schlensog, Green and Schroeter2013) in their study at Léonie Island drew attention to the importance of life form in determining water relations and activity. In particular, they showed the major contrast between mosses, which are the only plants in the hydric areas, and lichens, which dominate in the xeric sites. This difference was confirmed here and almost certainly reflects the different abilities of lichens and mosses to handle high hydration levels. Most mosses show little effect of high hydration on photosynthetic rates, whereas for many lichens photosynthesis at high thallus water contents is often strongly depressed due to increased CO2 diffusion resistances (Cowan et al. Reference Cowan, Lange and Green1992, Green & Lange Reference Green and Lange1994).
There are also examples of growth forms that make use of the increasing precipitation at Livingston Island. Most obvious is the very extensive growth of the Usnea lichens whose fruticose form allows them to benefit from both rain, snow and fog (Rundel Reference Rundel1978). Within the mosses, A. gainii and H. crispulum are able to achieve high activities by growing as clumps on the rock surface and storing water from precipitation, and A. gainii is much warmer than other species because of its darker colour (Figs 5 & 6). Bartramia patens is active for 100% of the time at its flush site but also achieves 100% and 97% when growing in crevices on the rock, again being able to benefit from precipitation collected from a larger area and probably also from lower evaporation rates. Similarly, the lichen P. saxatilis has an activity of 82.1% when growing in a rock crevice but only 35.5% on the rock surface. At Léonie Island the two liverworts studied had substantial activity by growing epiphytically on a moss. Improved water relations have been demonstrated for the foliose lichen Peltigera rufescens (Weiss) Humb. when growing epiphytically on a moss (Colesie et al. Reference Colesie, Scheu, Green, Weber, Wirth and Büdel2012).
Hydric/xeric contrasts
In the Antarctic Peninsula, hydric sites are those where the water supply is predominantly from snow melt, in the case of Livingston Island by a small stream, whereas activation at xeric sites is predominantly by precipitation. Activities at both hydric and xeric sites were higher in this study than found in the earlier study at Léonie Island (Schlensog et al. Reference Schlensog, Green and Schroeter2013) being 99.8% (five out of six species had 100%) and 57.4%, respectively, compared to 95.4% (two out of five species had 100%) and 31.8%. Sample limitations prevent hydric versus xeric comparisons for Botany Bay and Garwood Valley. At Botany Bay, hydration was predominantly by meltwater from a local snow cap and additional melt from winter snow produced the longer activity periods (Schroeter et al. Reference Schroeter, Green, Pannewitz, Schlensog and Sancho2011). While at Garwood Valley, hydration was by melt from rare light snow falls. A moss flush at Canada Glacier in Taylor Valley, Dry Valleys, is maintained by melt from the Canada Glacier, i.e. a hydric site, and the single available study in summer (January) found the moss Henediella heimii (Hedw.) Zand. to be continuously active (Pannewitz et al. Reference Pannewitz, Green, Scheidegger, Schlensog and Schroeter2003). Wherever hydric and mesic sites have been monitored their activity levels are always much higher than at xeric sites.
Macroclimate linkage
Schlensog et al. (Reference Schlensog, Green and Schroeter2013) showed that as duration of activity falls then the mean PPFD while active becomes progressively lower than mean incident PPFD, i.e. the lichen or moss becomes uncoupled from the macroclimate. We found the same phenomenon so that the lichens with the lowest activity had a mean PPFD while active that was about half that of species with 100% activity. This is a good example of the avoidance strategy shown by poikilohydric organisms, with higher light they dry out more rapidly and become dormant and highly resistant to environmental extremes (Kappen Reference Kappen1988, Kappen & Valladares Reference Kappen and Valladares2007). It is, however, not the only strategy in use as mosses in the Antarctic Peninsula and mosses and lichens in the Dry Valleys are continuously active and must tolerate whatever light or temperature level the environment imposes.
Environmental drivers and stressors, pan-continental comparisons
The main parameters of light and temperature of samples when active are summarized in Table II for three sites that span the major Antarctic environments: Botany Bay in Continental Antarctica, Léonie Island in the southern maritime of the Antarctic Peninsula, and Livingston Island in the north-western Antarctic Peninsula and in the cloud belt. It appears that the main potential stressor for the vegetation when active is incident light with means, medians and the 90% upper distribution value all increasing as one moves south (Table II). Mean PPFD when active at Livingston Island is only c. 25% of that at Botany Bay, where meltwater only occurs when the sun shines and, as a result, the hydrated lichens and mosses must tolerate very high incident light when hydrated. At Botany Bay, the mean light level when active for the lichen Umbilicaria aprina was 880 µmol m-2 s-1 with a maximum of 2743 µmol m-2 s-1, and it is perhaps no surprise that the mosses appear to continuously maintain the protective xanthophyll cycle as well as inducible mechanisms against high UV (Green et al. Reference Green, Kulle, Pannewitz, Sancho and Schroeter2005, Schroeter et al. Reference Schroeter, Green, Kulle, Pannewitz, Schlensog and Sancho2012). Hydric sites always face incident PPFD while active but mean levels are still lower at Livingston Island compared to Léonie Island (Table II), again reflecting the high cloud cover in the north.
In contrast, mean temperatures when active show little difference within Antarctica with Léonie Island being the warmest site with 5.1°C compared to 3.5°C and 3.2°C at Livingston Island and Botany Bay, respectively. The much higher maximal temperatures at Léonie Island and Botany Bay (26.0°C and 21.5°C when active, respectively) compared to 10.1°C at Livingston Island reflect the higher incident PPFD. Temperature ranges were also much higher (c. 26°C vs 10.8°C). The constancy of the environment at Livingston Island is also shown by the small differences in temperature, for instance between the means and medians it is <1 K, being very highly significant. Although having similar low mean temperatures Livingston Island is also very different from the lichen habitats in the European Alps where, in summer, there are large diel changes in temperature and light coupled with high precipitation (Reiter et al. Reference Reiter, Höftberger, Green and Türk2008).
Overall, although water availability across Antarctica is apparently related to mean temperature, the main stressor for the lichens and bryophytes south of the north-western cloud belt would appear to be incident light. The lower mean light levels at Livingston Island combined with moderate temperatures through the year certainly make it an excellent habitat for lichens and mosses with the lower stress allowing growth strategies to be pursued with the consequence that the lichen growth rates are the highest in Antarctica and also on a world comparison (Sancho et al. Reference Sancho, Green and Pintado2007).
Chlorophyll a fluorescence – non-photochemical quenching and Fv/Fm
The techniques used in this project meant chlorophyll fluorescence measurements could be made under both incident light and then after darkening. Therefore, it was not only possible to monitor effective yield of PSII (ɸPSII) but also optimal yield of PSII (Fv/Fm), and NPQ could be calculated. The latter parameter is rarely available for poikilohydric organisms. Laboratory studies suggest that NPQ in mosses can be much higher than in vascular plants (Marschall & Proctor Reference Marschall and Proctor2004) but, in this study, the values fell within the normal expected range of c. 0–1.5 (Fig. 10). The Fv/Fm provided an enigmatic result in that there was a very strong and highly significant positive linear relationship between mean activity (as % total time) and both the mean Fv/Fm and the mean for the highest ten values of Fv/Fm (Fig. 9). Declines in Fv/Fm are normally suggested to be due to photoinhibition from high light but this is certainly not the case here as the higher values of Fv/Fm were for samples with highest activity duration and highest incident PPFD, also NPQ was not excessive. There was no significant relationship between mean temperature and Fv/Fm. One possible explanation is that the samples with the lower activity will have lower Fv/Fm simply because they have more low values as they desiccate more often. We think this is not the case as means and medians for all samples were not significantly different indicating a similar distribution of low and high values for each sample. Our suggested explanation is that those samples that dry out regularly (low activities) install some form of protection for the photosystems against desiccation that leads to lower apparent efficiency. It is well known in the literature that lichens rarely have Fv/Fm levels that approach the maximal value of 0.83 found in vascular plants (Schreiber et al. Reference Schreiber, Bilger and Neubauer1995). Lower Fv/Fm are found if lichens are challenged with high sugar alcohol solutions (Hájek et al. Reference Hájek, Barták and Dubová2006) and it is possible that this is a dehydration effect rather than a perturbation of the carbohydrate metabolism. At present there is no definitive explanation for this phenomenon.
Conclusions
During the summer months at Livingston Island it is apparent that conditions are highly suitable for the growth of lichens and bryophytes, which is little surprise considering both the biodiversity and biomass in the area. The main driver is the water availability which activates the lichens, in particular, much longer than in more southern sites. The increased precipitation as one moves north allows lichens and bryophytes to colonize previously unavailable habitats especially exposed rock surfaces. Temperatures when the lichens and mosses are hydrated and metabolically active are similar at all monitored sites in Antarctica and reflect the need for liquid water, i.e. temperatures above freezing. Temperature range when active is substantially higher at more southern sites due to both higher maxima and lower minima. In contrast, incident light when hydrated and active increases as one moves south. This is due to a combination of extreme cloudiness at Livingston Island and hydration by snow/ice melt at more southern sites. Consequently, when considering adaptation strategies it is important to distinguish between conditions when hydrated and dormant. Carbon gain must be substantially higher as one moves north and this not only drives increased productivity but also allows different life strategies such as a change from stress tolerance to growth.
Acknowledgements
BS gratefully acknowledges financial support by Deutsche Forschungs-Gemeinschaft (DFG SCHR 473/4-7) and by Spanish MCI (CTM2009-12838-C01). LGS and AP were supported by Spanish MCI (CTM2015-64728-C2-1-R), we also thank the staff of the Spanish Antarctic Station, Juan Carlos I, for their support. TGAG was supported by Ramon y Cajal Fellowship at Biología Vegetal II, Farmacia, Universidad Complutense, Madrid, Spain, and by a FRST grant (Understanding, valuing and protecting Antarctica’s unique terrestrial ecosystems: predicting biocomplexity in Dry Valley ecosystems) during the writing of this paper. The authors would like to thank two anonymous reviewers for their contribution in particular in focussing the manuscript. Permits: all required permits for fieldwork and plant experimentation were obtained from the appropriate Antarctic authorities.
Author contribution
BS and TGAG conceived and designed the experiments. BS, TGAG, LGS, AP and RT collaborated in organizing and carrying out the field experiments. BS and TGAG collaborated in preparing the manuscript.