Introduction
The general formula of the pyrochlore-supergroup minerals is A 2B 2X 6Y. The names are composed of two prefixes and one root name (identical to the name of the group). The first prefix refers to the dominant anion (or cation) of the dominant valence (or H2O or □) at the Y site. The second prefix refers to the dominant cation of the dominant valence (or H2O or □) at the A site. The root names are elsmoreite, pyrochlore, microlite, roméite, betafite, ralstonite and coulsellite, depending on the nature of the predominant B cation and X anion (Atencio et al., Reference Atencio, Andrade, Bastos Neto and Pereira2017). The dominant cations of the dominant valence at the B site are, respectively, W, Nb, Ta, Sb, Ti, Al and Mg. For elsmoreite, pyrochlore, microlite, roméite and betafite groups, the dominant anion of the dominant valence at the X site is O2–. For ralstonite and coulsellite groups, the dominant anion of the dominant valence at the X site is F– (Atencio et al., Reference Atencio, Andrade, Christy, Gieré and Kartashov2010, Reference Atencio, Andrade, Bastos Neto and Pereira2017; Christy and Atencio, Reference Christy and Atencio2013).
When the nomenclature scheme was approved (Atencio et al., Reference Atencio, Andrade, Christy, Gieré and Kartashov2010), 20 names referring to existing minerals were listed, which needed a more complete description in order to be approved as valid species; among them is the mineral kenoplumbomicrolite, which involves Y = □ and A = Pb. Indeed, although several ‘plumbomicrolite’ occurrences are quoted in the literature, the status as a mineral species approved by the International Mineralogical Association (IMA) is still lacking (Atencio et al., Reference Atencio, Andrade, Christy, Gieré and Kartashov2010).
Following the formula-calculation procedures, the ‘plumbomicrolite’ specimens previously described from Borborema Pegmatitic Province, Brazil (Beurlen et al., Reference Beurlen, Soares, Thomas, Prado-Borges and Castro2005), from Urubu pegmatite, Itinga, Minas Gerais, Brazil (Uher et al., Reference Uher, Černý and Chapman2008) and from Manono, Shaba, Democratic Republic of Congo (Uher et al., Reference Uher, Černý and Chapman2008), should be named ‘kenomicrolite’, a still undescribed species that exhibits predominantly vacant A and Y sites.
Old chemical data refer to wet-chemical analyses and typically may represent a mixture of minerals, as indicated for data obtained by Voloshin et al. (Reference Voloshin, Bukanov and Polezhaeva1981) and Stepanov et al. (Reference Stepanov, Bukanov and Bykova1982) for Ploskaya ‘plumbomicrolite’. The chemical data obtained by Stepanov et al. (Reference Stepanov, Bukanov and Bykova1982) are similar to those presented in this work. It is not possible to decide if the sample studied by Chukanov (Reference Chukanov2014), from Ploskaya, is kenoplumbomicrolite, ‘oxyplumbomicrolite’, or ‘hydroxyplumbomicrolite’.
Safianikoff and van Wambeke (Reference Safiannikoff and van Wambeke1961) obtained wet-chemical data for samples from Mumba, Kivu, Democratic Republic of Congo, which correspond to ‘kenomicrolite’, but microprobe data published by Ercit (Reference Ercit1986) correspond to kenoplumbomicrolite. For additional ‘plumbomicrolite’ occurrences and data see Raade (Reference Raade2010).
With the aim of defining the status of IMA-approved species for one of these ‘orphan’ minerals of the pyrochlore supergroup, we describe here the new mineral kenoplumbomicrolite. This mineral has been studied already from a structural point of view by Bindi et al. (Reference Bindi, Zoppi and Bonazzi2006). For this reason, additional chemical data, physical properties and optical data were obtained from new fragments coming from the same locality.
Both the description and name (IMA2005-007a) were approved by the Commission on New Minerals, Nomenclature and Classification of the IMA. Type material is deposited in the collections of the Museu de Geociências, Instituto de Geociências, Universidade de São Paulo, Rua do Lago, 562, 05508-080 São Paulo, São Paulo, Brazil, registration number DR980.
Occurrence
The mineral occurs as an accessory mineral in an amazonite pegmatite from Ploskaya Mountain (67°37'60''N, 36°42'0''E), Western Keivy Massif, Kola Peninsula, Murmanskaja Oblast, Northern Region, Russia. The occurrence of ‘plumbomicrolite’ was described by Stepanov et al. (Reference Stepanov, Bukanov and Bykova1982), who identified the mineral for the first time in 1975, in the quarry number 1 of the Ploskaya amazonite pegmatite vein on southwest slopes of the Keivy Range. The mineral in quarry number 1 was an irregularly shaped single-crystal grain of 15 cm × 15 cm × 12 cm with induced faces at the contact with biotite and microcline. At the biotite contact, it exhibits some octahedral and cubic faces. In 1976, several more ‘plumbomicrolite’ specimens were detected in the quarry number 5 of the same vein, as octahedra to 3 cm overgrowing cleavelandite flakes. The Mount Ploskaya vein that was being worked for amazonite was 270 m long. It has been traced downdip for 70 m and, in the central part, it had a thickness of 25 m. The vein is confined to the contact between gneiss and schist of the Keivy series of Proterozoic age and genetically related to an alkaline granite pluton. The contact zone consists of fine-grained albite and is succeeded nearer the centre by an indistinct zone of blocks of amazonite, as large as 2.5 m and partly replaced by blocks and saccharoidal or flaky aggregates of albite. The central pegmatite has a quartz core with galena pockets as large as 0.4 m, coarse biotite flakes and contains ‘cleavelandite’ inclusions.
Associated minerals are microcline (var. amazonite), albite (var. cleavelandite), quartz, biotite, ‘zinnwaldite’, anglesite, bastnäsite-(Ce), bismite, bismuth, bismuthinite, bismutite, cassiterite, caysichite-(Y), churchite-(Y), columbite-(Mn), emplectite, fergusonite-(Y), fluorite, gadolinite-(Y), gahnite, galena, hingganite-(Y), hingganite-(Yb), kainosite-(Y), kamphaugite-(Y), kasolite, keiviite-(Y), keiviite-(Yb), kuliokite-(Y), lanarkite, leadhillite, löllingite, incompletely studied pyrochlore-supergroup minerals, monazite-(Ce), pyromorphite, scotlandite, sillénite, sphalerite, tengerite-(Y) , thalénite-(Y), thorite, uraninite, vyuntspakhkite-(Y), wulfenite, xenotime-(Y), xenotime-(Yb) and zavaritskite. Kenoplumbomicrolite has uraninite inclusions.
The Ploskaya massif in the Kola Peninsula (Russia) is the type locality for five other minerals: hingganite-(Yb), keiviite-(Y), keiviite-(Yb), kuliokite-(Y) and vyuntspakhkite-(Y).
Both the specimen studied by Bindi et al. (Reference Bindi, Zoppi and Bonazzi2006) and the one used for the present study were supplied by the late Victor I. Stepanov, of the Fersman Museum, to Roy Kristiansen in 1979.
Appearance and physical properties
Kenoplumbomicrolite (Fig. 1) forms yellowish brown octahedral, cuboctahedral and massive crystals, up to 20 cm (Anthony et al., Reference Anthony, Bideaux, Bladh and Nichols1990). It exhibits a white streak, a greasy lustre and is translucent. It is non-fluorescent under long wavelength (365 nm) ultraviolet radiation. The Mohs hardness is ~6. The mineral is brittle, cleavage was not observed and the fracture is uneven. The measured density is 7.523 (7.310–7.832) g.cm–3 (mean of five measurements using the pycnometer method), whereas the calculated density is 7.122 g.cm–3 (for the crystal used for the structural study), using the empirical formula and X-ray data from single-crystal study. The discrepancy between the observed and calculated datum is due to the ubiquitous presence of inclusions of uraninite. Kenoplumbomicrolite is optically isotropic. Reflectance values (relative to a cubic zirconia standard) were measured in air and in an immersion oil with refractive index of 1.515 (Table 1 and Fig. 2). They were obtained using a J & M TIDAS diode array spectrophotometer attached to a Zeiss Axioplan reflected-light microscope on a homogeneous area of a grain of kenoplumbomicrolite. No internal reflections were visible within the area of measurement.
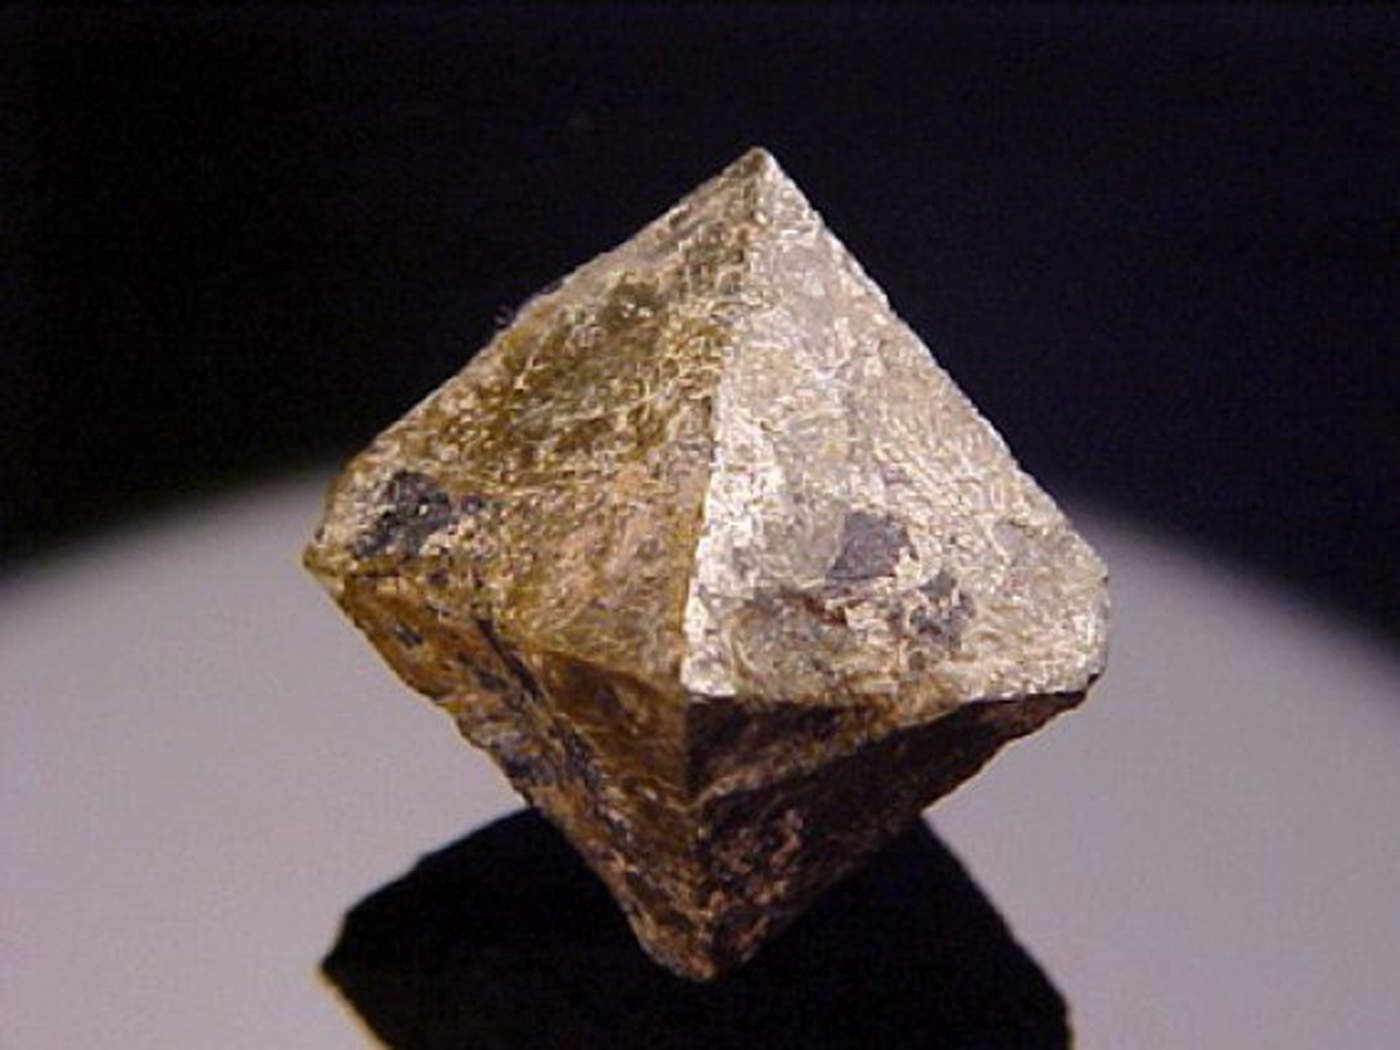
Fig. 1. Kenoplumbomicrolite from Ploskaya, Kola Peninsula, Russia. The crystal size is 2 cm × 1.94 cm × 1.5 cm. Photo by Jasun McAvoy (http://www.mineralman.com). Authorized reproduction. This is not the type specimen.
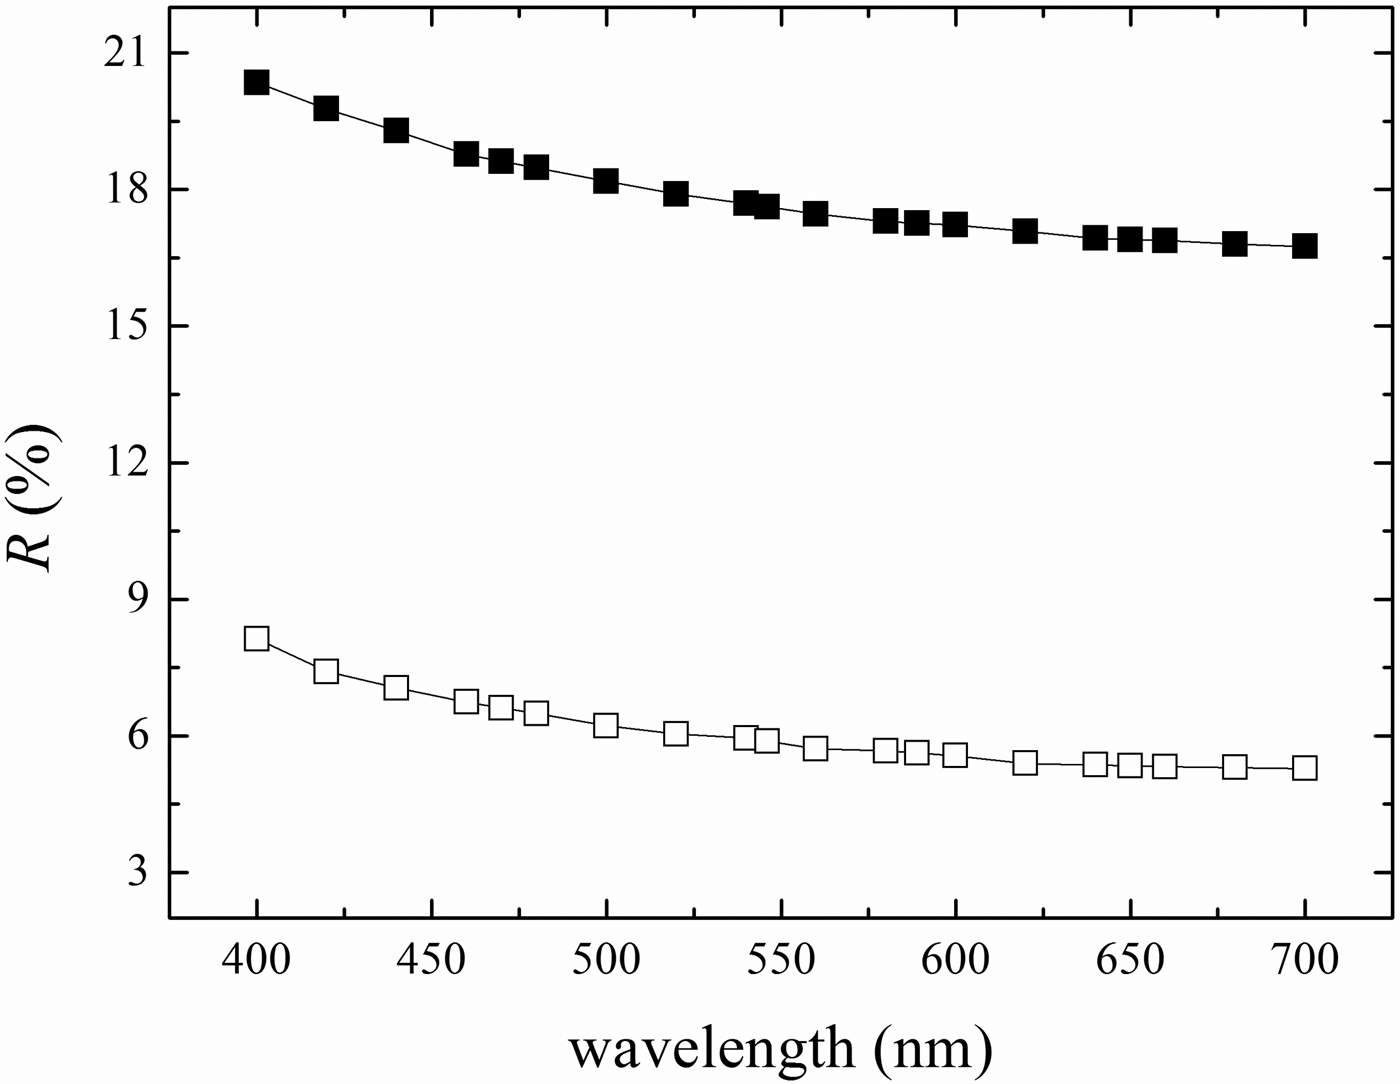
Fig. 2. Reflectance data for kenoplumbomicrolite. Filled and empty squares refer to measurements taken in air and oil, respectively.
Table 1. Reflectance values for kenoplumbomicrolite (R in %).
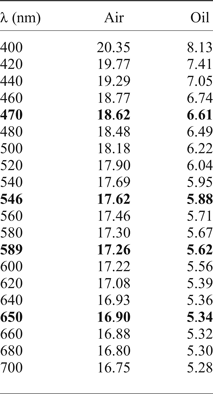
The values required by the Commission on Ore Mineralogy are given in bold.
Voloshin et al. (Reference Voloshin, Bukanov and Polezhaeva1981) presented the following data for kenoplumbomicrolite from Ploskaya (their sample 2): Density (meas.) = 7.69(7) g.cm–3; VHN = 610 (40 g load); and R (nm, %) = 486, 21.6; 553, 21.2; 586, 21.7; 656, 20.1. The data from Voloshin et al. (Reference Voloshin, Bukanov and Polezhaeva1981) are for a crystal slightly more enriched in Pb, thus the observed density is slightly higher than that calculated for the crystal studied by Bindi et al. (Reference Bindi, Zoppi and Bonazzi2006).
Chemical data
Chemical data (Table 2) were obtained for two samples: (1) the crystal used for the structural study (Bindi et al., Reference Bindi, Zoppi and Bonazzi2006); and (2) additional fragments.
Table 2. Chemical data (wt.%) for kenoplumbomicrolite.
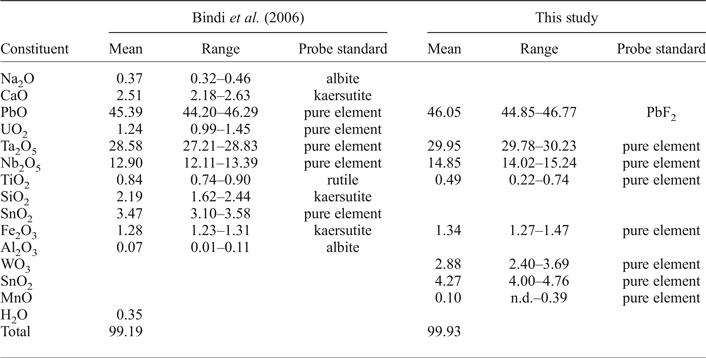
Four chemical analyses were carried out on the crystal used for the structural study, using a Jeol JXA-8600 electron microprobe (wavelength dispersive spectroscopy mode, 15 kV, 20 nA and 30 s counting time). The crystal was found to be homogeneous within analytical error. H2O was calculated from the crystal structure. All Fe was assumed to be Fe3+ and all Sn to be Sn4+. Mn, Sr, Sb, Ba, La, Ce, Pr, Nd, Tl and Th were sought but found to be below the detection limit. The empirical formula, based on 2 cations at the B site, is (Pb1.30□0.30Ca0.29Na0.08U0.03)Σ2.00(Ta0.82Nb0.62Si0.23Sn4+0.15Ti0.07Fe3+0.10Al0.01)Σ2.00O6[□0.52(OH)0.25O0.23]Σ1.00. The simplified formula is (Pb,□)2Ta2O6[□,(OH),O].
Seven chemical analyses were carried out on additional fragments (then used for density and reflectance measurements and powder X-ray diffraction investigations) using a LEO440 electron microscope equipped with Si-Li detector (EDS mode, 20 kV, 1.5 nA and 100 s counting time). The empirical formula, based on 2 cations at the B site, is (Pb1.33□0.66Mn0.01)Σ2.00(Ta0.87Nb0.72Sn4+0.18Fe3+0.11W0.08Ti0.04)Σ2.00O6[□0.80(OH)0.10O0.10]Σ1.00. Mn was assumed as divalent. In this formula O and OH are in equal proportions at the Y site by analogy to the sample studied structurally. In the absence of H2O analysis [which is compensated by the crystal-structure determination study (Bindi et al., Reference Bindi, Zoppi and Bonazzi2006)], the Y site occupancy could be expressed in different ways, for example: [□0.70(OH)0.30] or [□0.85O0.15]. But, in any case, the vacancy will be dominant and the amount of O and/or (OH) pfu will be small.
Uraninite inclusions in kenoplumbomicrolite crystals from Ploskaya were already noted by Voloshin et al. (Reference Voloshin, Bukanov and Polezhaeva1981). As is evident from Fig. 3, radiating cracks can be observed around uraninite. They can be interpreted as the result of micro-fracturing caused by radioactivity. Uraninite usually undergoes intense self-irradiation which can lead to amorphization, which, in turn, induces a volume increase and the formation of cracks.
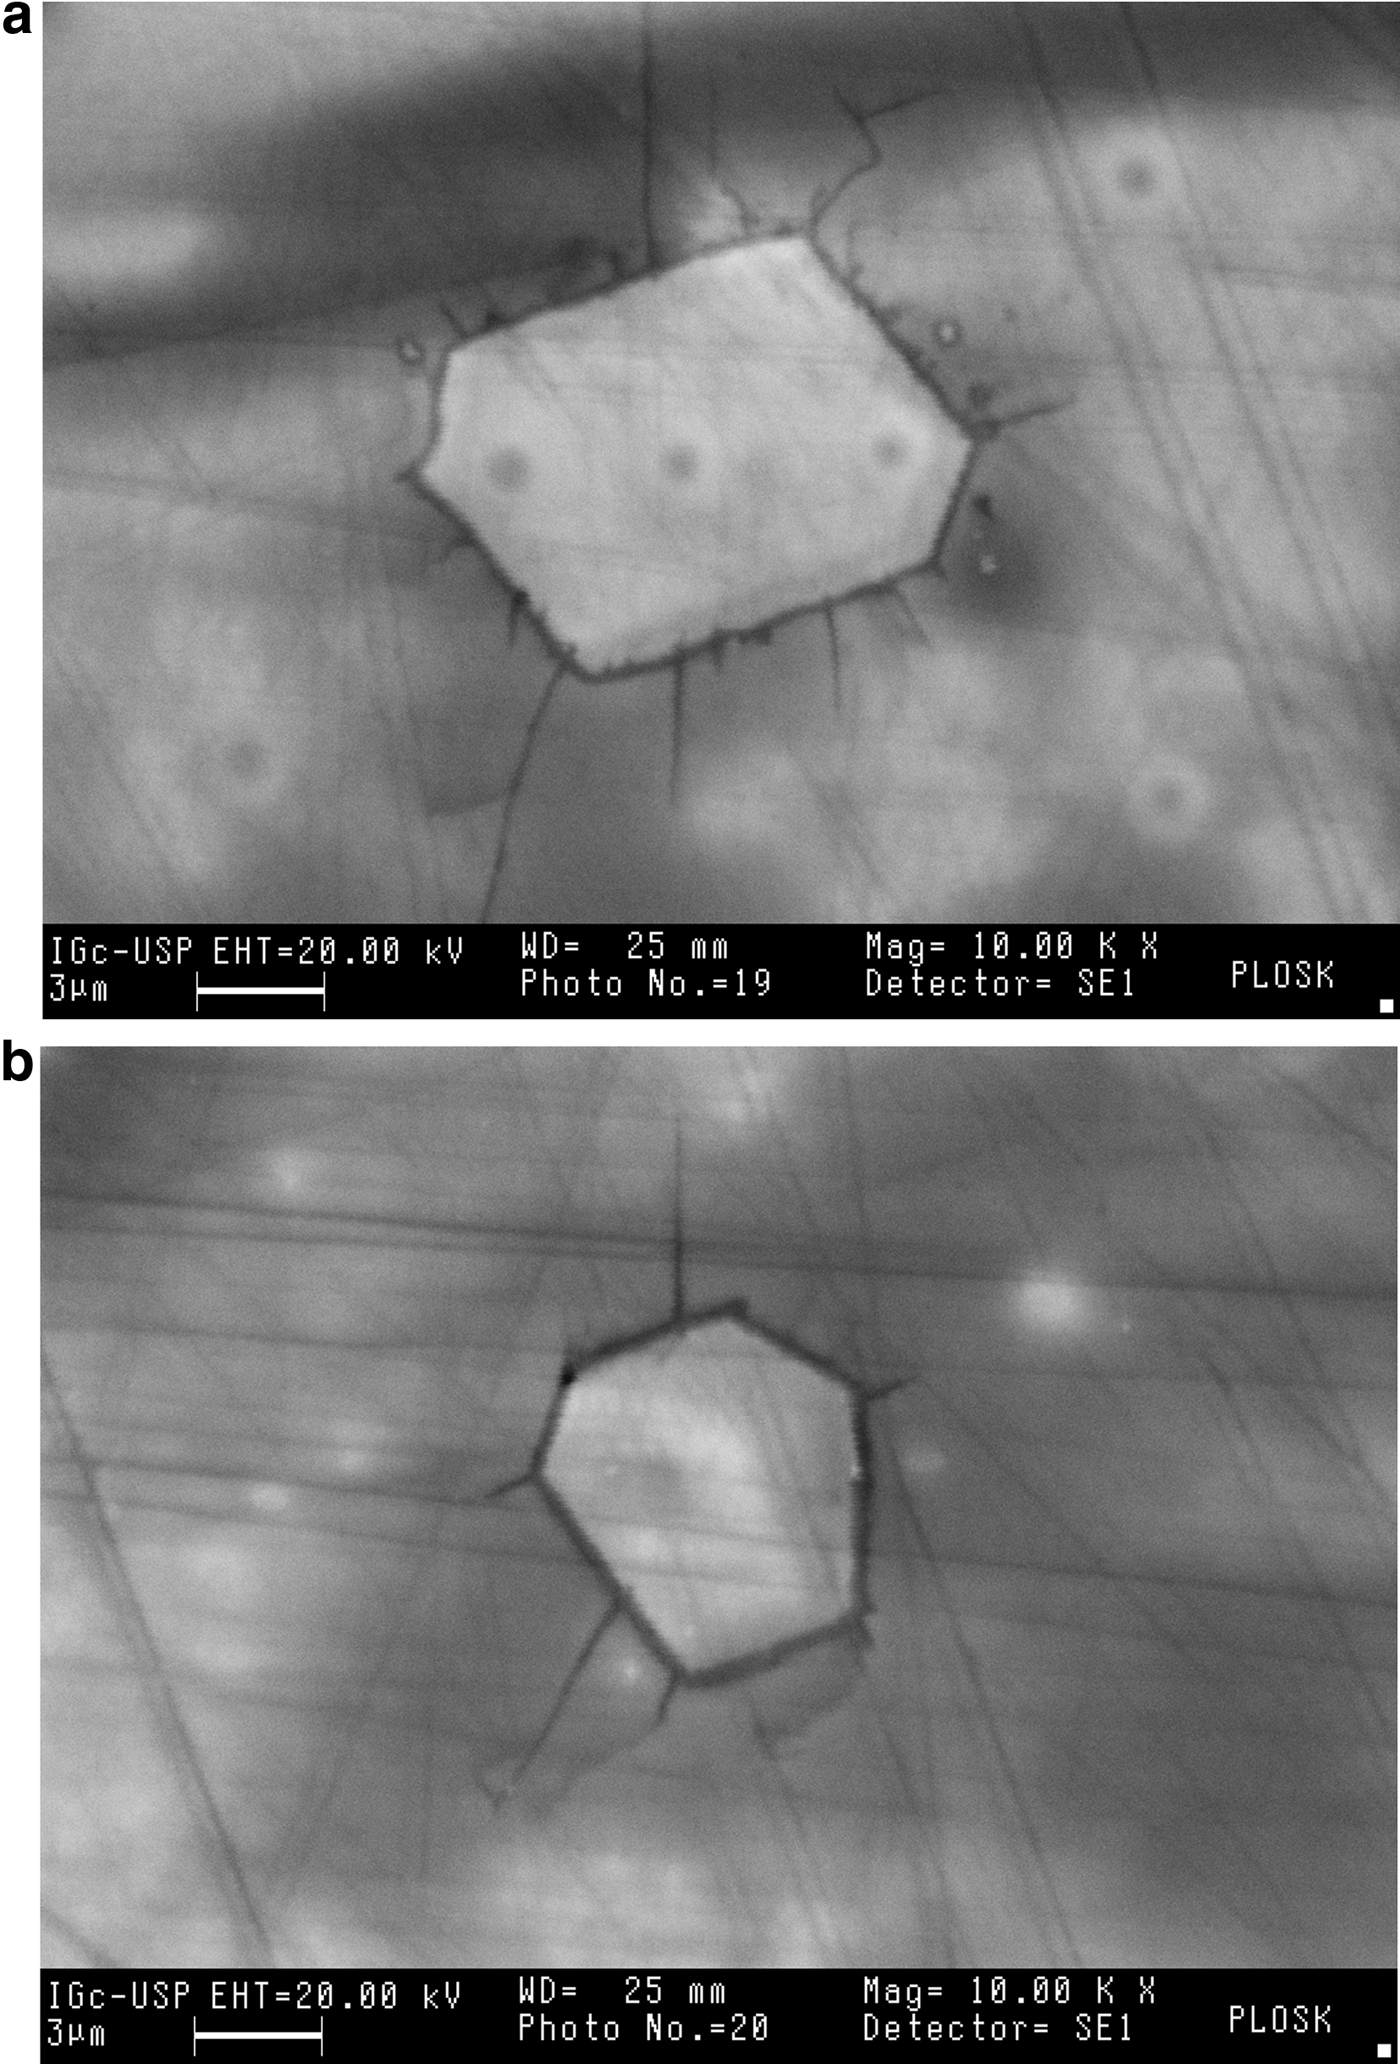
Fig. 3. (a,b) Back-scatter electron images showing uraninite inclusions in kenoplumbomicrolite.
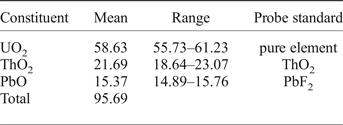
Five chemical analyses (Table 3) of uraninite were carried out using a LEO440 electron microscope equipped with a Si-Li detector (EDS mode, 20 kV, 1.5 nA and 100 s counting time). The empirical formula, based on 2 O anions is (U4+0.65Th0.25Pb0.21)Σ1.11O2. However, the apparent cation excess suggests that the mean cation valence is actually higher, due to part of the uranium being present as U6+. A formula with both U4+ and U6+ would be (U4+0.40Th0.22U6+0.19Pb0.19)Σ1.00O2.
Table 3. Chemical data (wt.%) for uraninite inclusions in kenoplumbomicrolite.
Crystallography
Powder X-ray diffraction data (for CuKα) were obtained using a Siemens D5000 diffractometer (Table 4). Unit-cell parameters refined from powder data are a = 10.575(2) Å, V = 1182.6(8) Å3 and Z = 8. Calculated powder X-ray diffraction data for kenoplumbomicrolite are also given in Table 4. The crystallographic information files have been deposited with the Principal Editor of Mineralogical Magazine and are available as Supplementary material (see below).
Table 4. Powder X-ray diffraction data for kenoplumbomicrolite*.
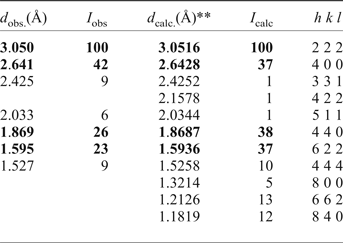
*Intensities and d hkl values were calculated using the XPOW program software (Downs et al., Reference Downs, Bartelmehs, Gibbs and Boisen1993) on the basis of the structural model given by Bindi et al. (Reference Bindi, Zoppi and Bonazzi2006); only reflections with I calc > 1 are listed. The strongest four reflections are given in bold.
**Calculated for a = 10.571 Å.
Single-crystal X-ray studies (Bindi et al., Reference Bindi, Zoppi and Bonazzi2006) were carried out using a Bruker P4 automated diffractometer with graphite-monochromated MoKα (λ = 0.71073 Å) radiation. The unit-cell values are a = 10.571(1) Å, V = 1181.3(2) Å3 and Z = 8. After the data reduction of the intensity dataset, the structure was refined in the space group Fd ![]() $\overline 3 $m to R obs = 4.89% and R all = 5.79%. The single-crystal X-ray study showed Pb2+ to be completely ordered at the A site. Because the Y site was only partially occupied, the Pb2+ may locally result as six-, seven-, or eight-fold coordinated. Whenever two neighbour Y sites are vacant, six X atoms around the A position form a trigonally flattened octahedron, while a trigonal scalenohedron occurs when two Y sites around A are occupied. When only one neighbour Y site is occupied, the A cation assumes an asymmetrical seven-fold pyramidal coordination. Due to the stereoactive electron lone pair of Pb2+, this last coordination environment should be strongly preferred. The occupancy of the Y position was refined and the resulting electron density of 3.9(2) electrons agrees well with the occupancy of Y in the empirical formula, [□0.52(OH)0.25O0.23], corresponding to 4.09 electrons (Fig. 4). Experimental details and refined structural parameters used for the approved species in Tables 1 and 2, respectively are those reported in Bindi et al., Reference Bindi, Zoppi and Bonazzi2006.
$\overline 3 $m to R obs = 4.89% and R all = 5.79%. The single-crystal X-ray study showed Pb2+ to be completely ordered at the A site. Because the Y site was only partially occupied, the Pb2+ may locally result as six-, seven-, or eight-fold coordinated. Whenever two neighbour Y sites are vacant, six X atoms around the A position form a trigonally flattened octahedron, while a trigonal scalenohedron occurs when two Y sites around A are occupied. When only one neighbour Y site is occupied, the A cation assumes an asymmetrical seven-fold pyramidal coordination. Due to the stereoactive electron lone pair of Pb2+, this last coordination environment should be strongly preferred. The occupancy of the Y position was refined and the resulting electron density of 3.9(2) electrons agrees well with the occupancy of Y in the empirical formula, [□0.52(OH)0.25O0.23], corresponding to 4.09 electrons (Fig. 4). Experimental details and refined structural parameters used for the approved species in Tables 1 and 2, respectively are those reported in Bindi et al., Reference Bindi, Zoppi and Bonazzi2006.
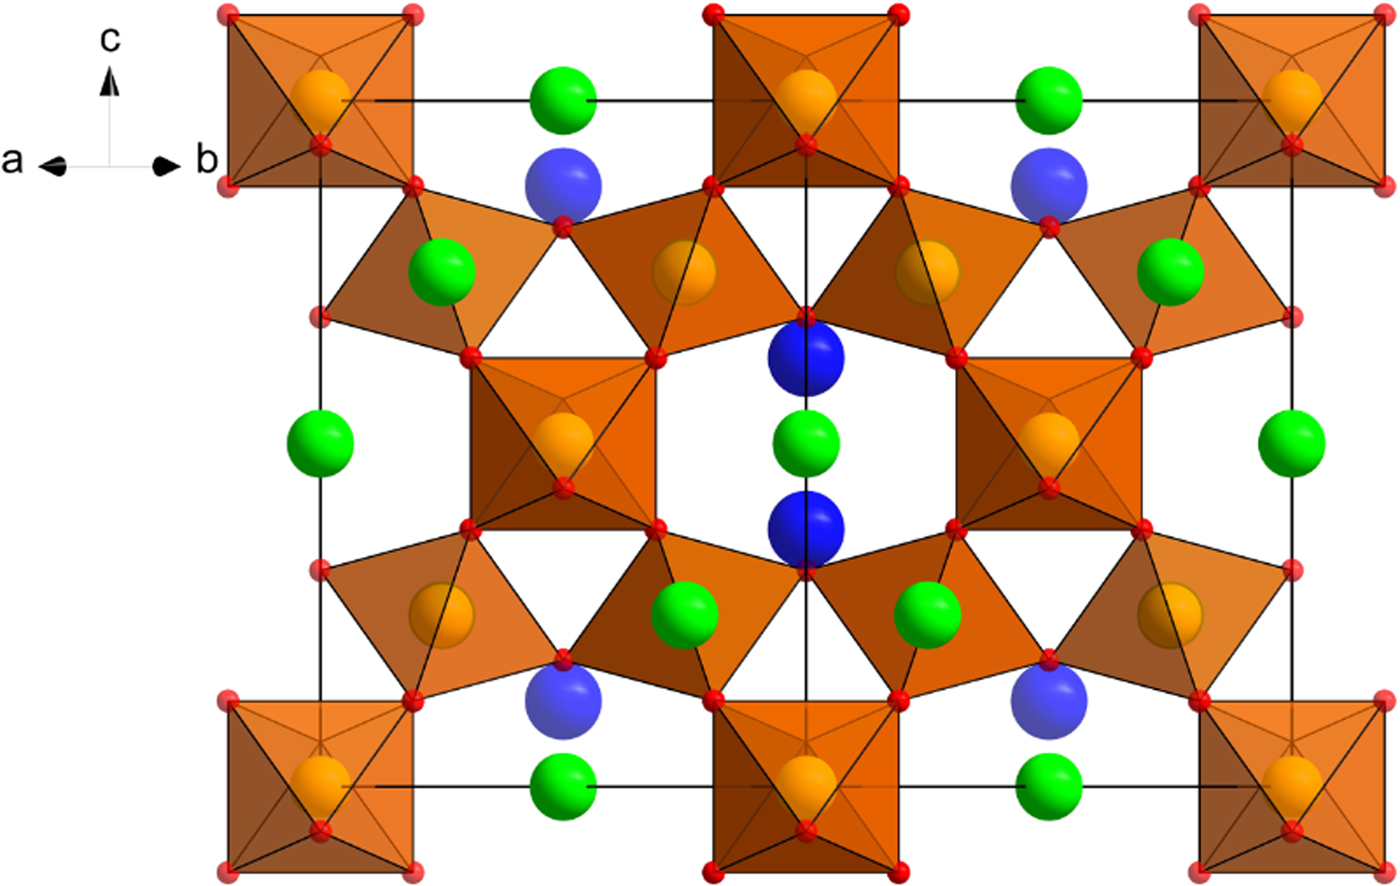
Fig. 4. Crystal structure of kenoplumbomicrolite down [110]. The orange polyhedra represent the B-site and the green, red and blue spheres represent A-, X- and Y-sites, respectively.
Conclusion
On the basis of the Ta dominance at the B site, the mineral from Ploskaya Mountain commonly known as ‘plumbomicrolite’ and previously described (Bindi et al., Reference Bindi, Zoppi and Bonazzi2006) maintains the root-name ‘microlite’; owing to the dominance of Pb at the A site the prefix ‘plumbo’ is also maintained. However, according to the IMA approved rules for nomenclature (Atencio et al., Reference Atencio, Andrade, Christy, Gieré and Kartashov2010), the name ‘plumbomicrolite’ must be preceded by the prefix ‘keno’, which indicates that the Y site is dominantly vacant.
Acknowledgements
We acknowledge the Brazilian agencies FAPESP (process 2014/50819-9 and 2013/03487-8), and all members of the IMA Commission on New Minerals, Nomenclature and Classification for their helpful suggestions and comments. We also thank Peter Williams for editorial handling and Stuart Mills and an anonymous reviewer for their detailed reviews.
Supplementary material
To view supplementary material for this article, please visit https://doi.org/10.1180/minmag.2017.081.082


