The morphology of bovine placenta prevents the transfer of immunoglobulins from dam to foetus during pregnancy, therefore, colostrum is essential for the transfer of passive immunity to newborn calves (Barrington and Parish, Reference Barrington and Parish2001; Castro et al., Reference Castro, Capote, Bruckmaier and Argüello2011). Failure of passive immunity transfer (FPIT) may occur if a calf does not receive enough good-quality colostrum soon after birth and absorb sufficient immunoglobulins, specifically immunoglobulin G (IgG). Failure of passive immunity transfer is associated with increased calf morbidity and mortality (Barrington and Parish, Reference Barrington and Parish2001; Moran, Reference Moran2002; Furman-Fratczak et al., Reference Furman-Fratczak, Rzasa and Stefaniak2011; Vandeputte et al., Reference Vandeputte, Detilleux and Rollin2011), and avoiding FPIT is crucial to optimise calf health and productivity.
Failure of passive immunity transfer can be detected in calves by measuring serum IgG or serum protein or by estimating the total serum protein using refractometry. The generally accepted FPIT thresholds at 24 h postpartum are less than 10 g/l of serum IgG (Weaver et al., Reference Weaver, Tyler, VanMetre, Hostetler and Barrington2000; Godden et al., Reference Godden, Lombard and Woolums2019; Oliveira et al., Reference Oliveira, Borchardt, Heuwieser, Rauch, Erhard and Sutter2019) or less than 52 g/l of serum total protein (TP) (McGuirk and Collins, Reference McGuirk and Collins2004; Hernandez et al., Reference Hernandez, Nydam, Godden, Bristol, Kryzer, Ranum and Schaefer2016; Cuttance et al., Reference Cuttance, Mason, Laven, McDermott and Phyn2017b). Other authors have estimated a Brix refractometry threshold for FPIT as less than 8.1–8.8% for calf serum at 24–48 h postpartum (Hernandez et al., Reference Hernandez, Nydam, Godden, Bristol, Kryzer, Ranum and Schaefer2016; Cuttance et al., Reference Cuttance, Mason, Denholm and Laven2017a; Godden et al., Reference Godden, Lombard and Woolums2019). It has been suggested that FPIT can be also inferred by the gamma-glutamyl transferase (GGT) levels in the calf blood with levels less than 200 IU/l of GGT at 24 h postpartum indicating FPIT (Perino et al., Reference Perino, Sutherland and Woollen1993; Parish et al., Reference Parish, Tyler, Besser, Gay and Krytenberg1997).
To avoid FPIT, it is recommended that calves receive approximately 10% of their body weight of good quality colostrum (>50 g/l of IgG) within few hours of birth (McGuirk and Collins, Reference McGuirk and Collins2004; Bartier et al., Reference Bartier, Windeyer and Doepel2015; Godden et al., Reference Godden, Lombard and Woolums2019). By quantifying the components in the colostrum before feeding the calf, the quality can be assessed so that a sufficient volume can be given to avoid FPIT. There are many laboratory-based methods for quantifying IgG to determine colostrum quality (Gapper et al., Reference Gapper, Copestake, Otter and Indyk2007). However, these laboratory-based methods are time consuming, costly, and difficult to apply routinely as samples need to be transported to the laboratory.
On-farm techniques for estimating the IgG concentration in samples that provide results rapidly can be used to manage the colostrum fed to neonatal calves and to monitor the transfer of colostrum components to the calves. Two such techniques are Brix refractometry for colostrum samples (Quigley et al., Reference Quigley, Lago, Chapman, Erickson and Polo2013; Morrill et al., Reference Morrill, Robertson, Spring, Robinson and Tyler2015; Cabral et al., Reference Cabral, Chapman, Aragona, Clark, Lunak and Erickson2016) and digital serum refractometry for blood samples (Vandeputte et al., Reference Vandeputte, Detilleux and Rollin2011; Deelen et al., Reference Deelen, Ollivett, Haines and Leslie2014; Hernandez et al., Reference Hernandez, Nydam, Godden, Bristol, Kryzer, Ranum and Schaefer2016). Brix refractometry values between 18 and 23% are considered to be equivalent to 50 g/l IgG, the threshold for good quality colostrum (Bielmann et al., Reference Bielmann, Gillan, Perkins, Skidmore, Godden and Leslie2010; Quigley et al., Reference Quigley, Lago, Chapman, Erickson and Polo2013; Bartier et al., Reference Bartier, Windeyer and Doepel2015; Morrill et al., Reference Morrill, Robertson, Spring, Robinson and Tyler2015).
In addition to providing passive immunity, colostrum contains all the nutrients that are essential for the survival of the neonate calf, including proteins, lactose, fat, minerals, and vitamins (McGrath et al., Reference McGrath, Fox, McSweeney and Kelly2016; Godden et al., Reference Godden, Lombard and Woolums2019). However, colostrum quality is rarely considered in terms of these other components, and their assessment on-farm has not been studied. In the present study, the components of colostrum, milk and calf blood were quantified by both refractometry and laboratory assays and their correlations determined. The data were then used to develop linear regression models to determine the predictability of colostrum component levels or blood component levels based on refractometry measurements or the other components.
Materials and methods
Sample collection
The animal work was performed at a commercial dairy farm with over 1800 cows located in Mount Gambier, South Australia. All animal experimental work was approved by the University of Adelaide Animal Ethics Committee (approval number S-2017-060). Twelve Holstein-Friesian cows were milked within 2 h postpartum prior to being suckled (day 0), and then twice daily for 3 d (days 1, 2 and 3). The colostrum and transition milk samples were collected every 24 h during this time and are referred to as ‘individual cow colostrum’. Twenty five (25) samples of bulk tank milk were also collected. The ‘bulk tank milk’ was from the all cows on the dairy farm at 5 d or more postpartum. In addition, six samples were collected from the pooled colostrum and transitional milk of the other cows on the farm at 0–4 d postpartum. These samples are referred to as ‘pooled colostrum’ to distinguish from the ‘bulk tank milk’ and ‘individual cow colostrum’ samples. Total solids in the colostrum and milk samples were measured immediately after collection by Brix refractometry (digital refractometer DBR-1, Star Instrument with a measurement range from Brix 0–50%). The colostrum and milk samples were aliquoted into sterile 50 ml-tubes, frozen at −20°C, and stored at −80°C until analysed.
Thirty-five Holstein-Friesian bull calves born in February and March 2018 were divided into 2 groups using block randomisation by birth order. The first group (n = 24) was fed colostrum from the individual cows (5% of body birth weight/feed) harvested at the milking just prior to feeding twice a day for 3 d, and then fed bulk tank milk for 4 d. The second group of calves (n = 11) was fed one bottle of pooled colostrum at the first feed (1.7 litres), and then fed bulk tank milk twice a day for 7 d.
Blood samples were collected into 6 ml – BD vacutainers without anticoagulant and BD vacutainers with heparin from all calves within 4 h after birth before their first feed (day 0) and at day 1 and day 7 postpartum. Glucose concentration in whole calf blood was measured using a glucose meter immediately after collection (Accu-check Performa, Roche Diabetes Care, Basel, Switzerland). The blood was then separated immediately by centrifugation (2000 g) for 15 min at room temperature to obtain serum and plasma. The total protein was measured in serum immediately after centrifugation using a serum protein refractometer (TP-R) (ATAGO Digital Refractometer with a protein measurement range from 0 to 12 g/100 ml). The serum and plasma samples were frozen at −20°C and stored at −80°C until analysed.
Colostrum and calf blood component measurements
The IgG concentration in the individual cow colostrum, pooled colostrum, bulk tank milk samples and calf serum samples was quantified by enzyme-linked immunosorbent assay (ELISA) using two bovine IgG specific antibodies (Life Technologies, USA) as described in the Supplementary File. Total protein in the individual cow colostrum, pooled colostrum, bulk tank milk and calf serum samples was assayed in a 96 well-plate using a Quick Start Bradford Protein assay kit (TP-B) (Bio-Rad Laboratories, Inc., USA) following the manufacturer's instructions as detailed in the Supplementary File.
Percentages of total protein, lactose and fat concentration in the thawed colostrum and milk samples were determined using a Fourier-transform mid-range infrared analyser (FT-MIR spectrometer, Foss Analytics) at the National Herd Development Co-operative (Kyabram VIC 3620, Australia). Calf plasma was analysed for gamma-glutamyl transferase (GGT) levels using a kinetic colour test with a Beckman Coulter analyser at the Veterinary Diagnostic Laboratory, the University of Adelaide, South Australia.
Statistical analysis
Statistical analyses were conducted in R (R version 3.6.3) and independently verified in SAS (Edition 9.4, SAS Institute, Cary, NC, USA). Descriptive statistics for the total solids, total protein, IgG, protein %, fat %, and lactose % in colostrum, and the glucose concentration, the total protein, IgG and GGT in calf blood were calculated and the correlations between the various components in the colostrum and milk samples and in the calf blood samples were determined. The correlations were categorised as follows: negligible (r < 0.30); low (r = 0.30 to 0.49); moderate (r = 0.50 to 0.69); high (r = 0.70 to 0.89); or very high (r ⩾ 0.90) (Wilm et al., Reference Wilm, Costa, Neave, Weary and von Keyserlingk2018). To evaluate the association between any two components, simple linear regression analysis was performed using linear models for two continuous variables. The accuracy of the predictions was estimated using the coefficient of determination (R 2). The coefficient of determination (R 2), or goodness of fit, has a value between 0.0 and 1.0, where a value of 1.0 indicates a perfect fit and a value of 0.0 indicates that the model fails to accurately predict the data.
Results and discussion
Concentration of colostrum components
The constituents of individual cow colostrum collected days 0–3 postpartum, pooled colostrum and bulk tank milk were compared. The pooled colostrum replicated the dairy's practice of mixing colostrum and transition milk from all cows 0 to 4 d postpartum to feed to the newborn calves.
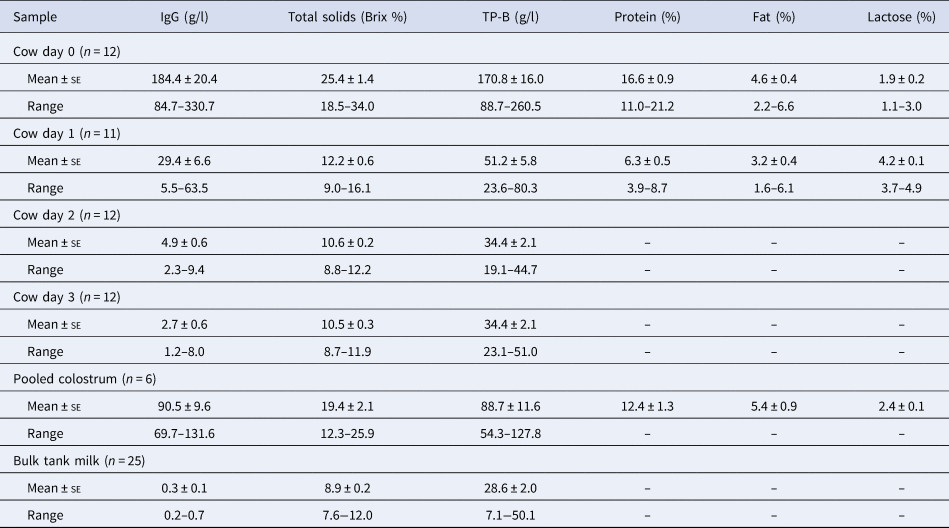
The IgG concentration in the individual cow colostrum decreased dramatically from a mean value of 184.4 g/l at day 0 to 2.7 g/l by day 3 (Table 1). The level of IgG in the pooled colostrum was relatively high (90.5 g/l), but was very low in the bulk tank milk (0.3 g/l). Both the individual cow colostrum and pooled colostrum had IgG concentrations that were higher than the threshold of 50 g/L recommended to avoid FPIT (McGuirk and Collins, Reference McGuirk and Collins2004; Baumrucker et al., Reference Baumrucker, Stark, Wellnitz, Dechow and Bruckmaier2014; Bartier et al., Reference Bartier, Windeyer and Doepel2015).
Table 1. Descriptive statistics of different colostrum and milk components

IgG = immunoglobulin G; TP-B = total protein measured by Bradford assay; Cow = individual cow colostrum at the time point (day) indicated; Pooled colostrum = colostrum and transition milk pooled from cows days 0–4 postpartum; Bulk tank milk = milk collected from cows more than 4 d postpartum.
Immediately postpartum, the level of total solids in the individual cow colostrum was high (25.4 ± 1.4 Brix %), but declined rapidly by day 1 (12.2 ± 0.6 Brix %). The Brix % observed in all the individual cow colostrum samples immediately postpartum was higher than the published thresholds of 18–23% for good quality colostrum. This is presumably because the colostrum was obtained from the individual cows within 2 h postpartum and the cows were multiparous. The mean Brix % was also high in pooled colostrum (19.4 ± 2.1%), although two of the samples were below 18%, the Brix threshold for good quality colostrum (Morrill et al., Reference Morrill, Robertson, Spring, Robinson and Tyler2015).
Total protein in the individual cow colostrum, as measured by Bradford assay and FT-MIR, had the same trend as the levels of IgG and total solids, with very high levels on day 0 (170.8 ± 16.0 g/l, 16.6 ± 0.9%), a sharp decline by day 1 (51.2 ± 5.8 g/l, 6.3 ± 0.5%) and a constant level thereafter (34.4 ± 2.1 g/l at days 2 and 3). Total protein levels in the pooled colostrum were roughly half of the values of the individual cow colostrum between days 0 and 1 (88.7 ± 11.6 g/l, 12.4 ± 1.3%), and the level of total protein in the bulk tank milk was similar to the day 2 and day 3 individual cow colostrum (28.6 ± 2.0 g/l).
The fat concentration in the individual cow colostrum at day 0 was slightly lower than the pooled colostrum (4.6 ± 0.4% and 5.4 ± 0.9% respectively) and declined by day 1 (3.2 ± 0.4%). The decline in colostrum fat percentage one day postpartum was also observed by Dunn et al. (Reference Dunn, Ashfield, Earley, Welsh, Gordon and Morrison2017), who found the fat percent in colostrum decreased from 7.0% to 6.0% within 24 h postpartum and from 6.7% to 3.9% between the first and third milking postpartum (reviewed by Godden et al. (Reference Godden, Lombard and Woolums2019)).
In contrast to the other components, the lactose concentration in the individual cow colostrum increased from day 0 to day 1 (1.9 ± 0.2% and 4.2 ± 0.1%, respectively). The pooled colostrum was intermediate (2.4 ± 0.1%). These lactose levels were comparable to those obtained in other studies where lactose was found to be low in colostrum but to increase in the milk as lactation is established (Kehoe et al., Reference Kehoe, Jayarao and Heinrichs2007).
Correlations between colostrum components
The correlations between components in the individual cow colostrum from days 0 and 1 postpartum were high (Table 2). The correlations between total solids measured by Brix refractometer with total protein, IgG, lactose % and protein % were 0.92, 0.90, −0.88 and 0.98, respectively, for the combined data from the pooled colostrum and the individual cow colostrum days 0 and 1 postpartum samples (n = 29) (Table 2).
Table 2. Correlations between components in colostrum and milk
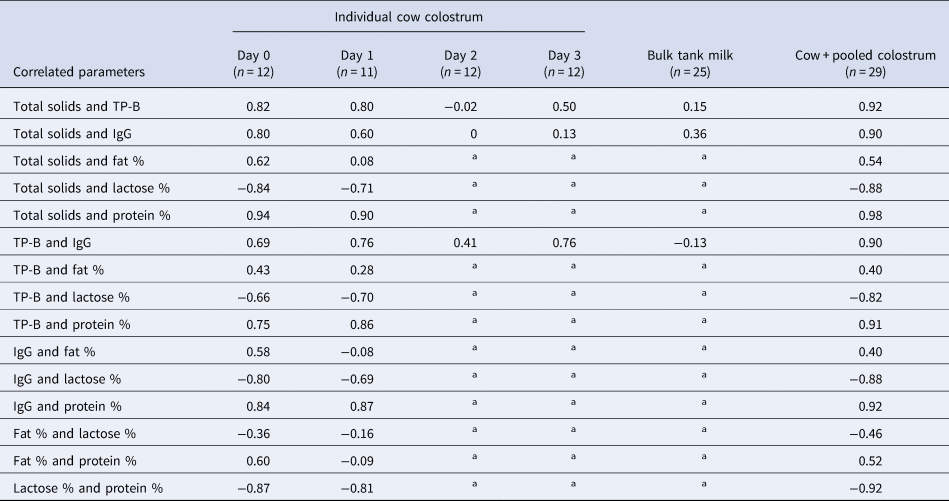
Colostrum is taken d0 or d1 postpartum, milk is bulk tank milk from d5 or later. Total solids measured by Brix refractometer; IgG = immunoglobulin G; TP-B = total protein measured by Bradford assay.
a Data not available.
Correlations between Brix refractometer measurements and colostrum IgG measured by radial immunodiffusion (RID) or turbidimetric immunoassay (TIA), previously reported for day 0 and 1 post-partum, range between 0.64 and 0.75 (Bielmann et al., Reference Bielmann, Gillan, Perkins, Skidmore, Godden and Leslie2010; Quigley et al., Reference Quigley, Lago, Chapman, Erickson and Polo2013; Bartier et al., Reference Bartier, Windeyer and Doepel2015; Elsohaby et al., Reference Elsohaby, McClure, Cameron, Heider and Keefe2017). In the present study, the IgG concentration was measured by sandwich ELISA, which has higher sensitivity and specificity for IgG than other methods, including RID or TIA (Li-Chan and Kummer, Reference Li-Chan and Kummer1997), which may confound direct comparisons of the correlations. Notably the correlations between Brix refractometry and the components of individual cow colostrum from days 2 and 3 and in the bulk tank milk were low or negligible (Table 2). These results are similar to those of Rayburn et al. (Reference Rayburn, Chigerwe, Barry and Kennedy2019), who found that refractometry was not useful for assessing IgG by the fourth or fifth milking. Therefore, using Brix refractometer or protein levels to estimate IgG in colostrum after 2 d postpartum is not advised.
IgG represents approximately 75% of the protein in colostrum (McGrath et al., Reference McGrath, Fox, McSweeney and Kelly2016; Godden et al., Reference Godden, Lombard and Woolums2019). However, other proteins are also important for calf health, including beta-lactoglobulin, alpha-lactalbumin, lactoferrin and other immunoglobulins (namely, IgA and IgM) (McGrath et al., Reference McGrath, Fox, McSweeney and Kelly2016). Although laboratory assays to measure colostrum components can be expensive and time consuming, they are highly accurate. Among these laboratory assays, the Bradford assay (TP-B) is a relatively easy and inexpensive method to measure total protein. The correlations between total protein, as measured by Bradford assay (TP-B) in the individual cow colostrum at day 0 and 1 post-partum, and IgG or protein % were high and positive (r = 0.90 and 0.91, respectively).
There was a strong and highly negative correlation between total protein (TP-B) and lactose (r = −0.82) (Table 2). The colostrum lactose concentration was also highly negatively correlated with protein % measured by FT-MIR (r = −0.92). This osmotic activity of lactose dilutes other colostrum components, specifically the protein concentration, resulting in an inverse relationship between the levels of lactose and protein in the colostrum. Consequently, the colostrum lactose concentration also had a high negative correlation with IgG concentration (r = −0.88), as has been observed by others (Dunn et al., Reference Dunn, Ashfield, Earley, Welsh, Gordon and Morrison2017).
Estimating colostrum components using Brix refractometer measurements
The very high correlations observed between each of the components of individual cow colostrum within 1 d postpartum and the pooled colostrum means that the concentration of one component can be potentially used to predict that of the others (Supplementary Figures S1–S4). The exception is fat percentage as it was not strongly correlated with the level of other colostrum components.
Simple linear model equations were used to estimate IgG, protein, and lactose concentrations based on the Brix refractometer measurements of individual cow colostrum day 0 and 1 postpartum and the pooled colostrum (n = 29). The very high correlations between the components were reflected in the coefficients of determination (R 2) (Supplementary Figure S1). Importantly, the formula for predicting IgG (IgG (g/l) = −103.1 + 10.9 × Brix %) had good predictive power (R 2 = 0.80, P < 0.001). Both r and R 2 in the present study were higher than reported other studies such as Bartier et al. (Reference Bartier, Windeyer and Doepel2015) (0.64 and 0.43, respectively) and Bielmann et al. (Reference Bielmann, Gillan, Perkins, Skidmore, Godden and Leslie2010) (0.73 and 0.53, respectively). This may be a result of the method used to measure the IgG concentration in the present study as the ELISA is more sensitive and accurate than the RID assays used in the other studies.
Both lactose and protein levels in the individual cow colostrum 0–1 d postpartum and pooled colostrum could be estimated with reasonable accuracy from Brix % (Supplementary Figure S1). The lactose concentration could be estimated using the formula, Lactose (%) = 5.7–0.2 × Brix %, with a reasonable goodness of fit (R 2 = 0.78, P < 0.001). The total protein in colostrum could be estimated from the formula, TP-B (g/l) = −61.6 + 8.8 × Brix %, with a high coefficient of determination (R 2 = 0.85, P < 0.001). The formula predicting the protein % in colostrum from Brix refractometry measurements (Protein % = −2.5 + 0.7 × Brix %) had an even greater coefficient of determination (R 2 = 0.96, P < 0.001) than the TP-B formula. Therefore, Brix refractometry measurements are a good predictor for not only estimating IgG in colostrum, but also protein and lactose concentrations.
Previous studies suggest calves should receive at least 10% of body weight of 50 g/l of IgG from colostrum within a few hours of birth (McGuirk and Collins, Reference McGuirk and Collins2004; Godden, Reference Godden2008; Bartier et al., Reference Bartier, Windeyer and Doepel2015). As it is difficult to measure IgG on-farm, it has been suggested that calves should receive a large volume of colostrum, equal to 10 to 12% of body weight (3 to 4 litres of colostrum) at their first feed (Moran, Reference Moran2002; McGuirk and Collins, Reference McGuirk and Collins2004; Godden et al., Reference Godden, Lombard and Woolums2019). Other authors investigating the transfer of passive immunity to calves fed different colostrum volumes at different times after birth have suggested specific colostrum volumes and specific feeding times (Williams et al., Reference Williams, Pithua, Garcia, Champagne, Haines and Aly2014). For example, Osaka et al. (Reference Osaka, Matsui and Terada2014) recommended that calves consume ⩾3 litres of colostrum with IgG concentration >40 mg/ml within 6 h after birth. However, it is difficult to follow these recommendations as there is a large variation in individual cow colostrum IgG concentrations (Marnila and Korhonen, Reference Marnila, Korhonen and Fuquay2011; Quigley et al., Reference Quigley, Lago, Chapman, Erickson and Polo2013; Dunn et al., Reference Dunn, Ashfield, Earley, Welsh, Gordon and Morrison2017), and other variation is inevitable due to factors such as the time of collection, breed and cow management (Bartier et al., Reference Bartier, Windeyer and Doepel2015; Schneider et al., Reference Schneider, Failing and Wehrend2020).
Establishing the colostrum quality using Brix refractometry will enable the volume of colostrum that should be fed to the neonate to avoid FPIT to be more accurately determined. For example, colostrum with a Brix of 20% would have approximately 115 g/l of IgG (Supplementary Table S1), so calves weighing ≤40 kg at birth should receive ~ 2 litres of colostrum of this quality within 4 h postpartum to avoid FPIT. If the Brix % is lower than the recommended threshold of 18 to 23 Brix%, then more colostrum should be provided at the first feed. Based on the prediction equation, a Brix measurement of 14% would be equivalent to 50 g/l of IgG, and the producer would need to feed calves weighing ≤ 40 kg at least 4 litres of the colostrum to ensure the calves received sufficient IgG (Supplementary Table S1).
Calf blood components
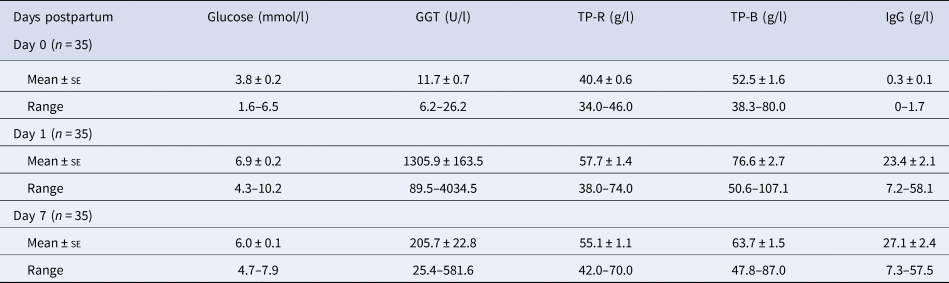
Blood samples were taken from the calves prior to the first feed (day 0), and then after receiving the colostrum and milk, on days 1 and 7. The blood samples were analysed for glucose, GGT, total protein and IgG. Before the first feed, all colostrum derived components were at low levels in the calf blood, in particular, GGT and IgG (11.7 IU/l and 0.3 g/l, respectively) (Table 3). These values confirmed that calves had not suckled from their dam prior to sampling (Braun et al., Reference Braun, Tainturier, Laugier, Bénard, Thouvenot and Rico1982). The concentrations of all components increased after feeding (day 1), but declined by day 7 (Table 3). The exception was the IgG concentration, which was higher at day 7 than day 1.
Table 3. Descriptive statistics of calf blood measurements

TP-R = total protein by refractometry; TP-B = total protein by Bradford assay; Day 0 = within 4 h postpartum and before receiving colostrum; Days 1 and 7 after receiving colostrum or milk twice per day.
Correlations between calf blood components
There were negligible or low correlations between the calf blood components in the samples taken before the calves received colostrum (day 0; Table 4). On day 1, the correlations between total protein measured by refractometry (TP-R) and GGT and between GGT and IgG were high (r = 0.71 and r = 0.72, respectively), and the correlation between TP-R and IgG was moderate (r = 0.61). The correlations between TP-R and IgG and between GGT and IgG remained constant up to day 7 (r = 0.67 and r = 0.62, respectively), but the correlations between other components were substantially lower at later time points. A higher correlation between TP-R and IgG was observed by combining all the calf data from the first week postpartum than for any of the individual days (r = 0.81).
Table 4. Correlations between calf blood components at various times postpartum
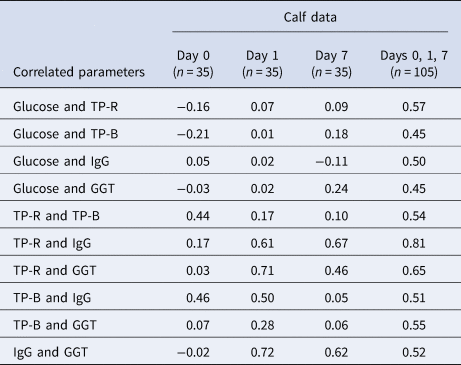
TP-R = total protein by refractometry; TP-B = total protein by Bradford assay; Day 0 = within 4 h postpartum but before receiving colostrum; Days 1 and 7 after receiving colostrum or milk twice per day.
The correlation between total protein measured by serum refractometer (TP-R) and IgG for calf blood samples within 7 d postpartum was similar to those reported in other studies, which ranged between from 0.75 to 0.93 (Deelen et al., Reference Deelen, Ollivett, Haines and Leslie2014; Hernandez et al., Reference Hernandez, Nydam, Godden, Bristol, Kryzer, Ranum and Schaefer2016; Renaud et al., Reference Renaud, Duffield, LeBlanc and Kelton2018; Wilm et al., Reference Wilm, Costa, Neave, Weary and von Keyserlingk2018). High correlations have been observed between serum IgG and Brix refractometer measurements of serum as well (r = 0.79–0.93) (Deelen et al., Reference Deelen, Ollivett, Haines and Leslie2014; Hernandez et al., Reference Hernandez, Nydam, Godden, Bristol, Kryzer, Ranum and Schaefer2016). These authors also reported a very high correlation between the values from these two different types of refractometers, Brix and digital serum protein (r = 0.97–1.0). The estimated FPIT thresholds are 8.1% to 8.5% for the Brix refractometer and 50 to 55 g/l for the serum protein refractometer (Godden et al., Reference Godden, Lombard and Woolums2019).
There was a high correlation between serum IgG and plasma GGT at day 1 (r = 0.72), but the correlation was lower by day 7 (r = 0.62) (Table 4). These correlations are similar to those reported in a study of calves less than 11 d postpartum (r = 0.65–0.68) (Parish et al., Reference Parish, Tyler, Besser, Gay and Krytenberg1997). However, much lower correlations have been found in other studies of calves less than 8 d postpartum (r = 0.398 and r = 0.495) (Jezek et al., Reference Jezek, Nemec, Malovrh and Klinkon2010; Vandeputte et al., Reference Vandeputte, Detilleux and Rollin2011).
Estimating calf blood components using serum refractometry
As the correlations between the calf blood IgG and TP-R and between GGT and TP-R were high, regression models were developed to estimate the serum IgG and plasma GGT based on the serum protein refractometer measurements (Supplementary Figures S3 and S4). To predict calf blood components more accurately, all the data within 7 d postpartum were combined and a formula was generated to predict serum IgG concentration from the protein refractometer measurements, IgG (g/l) = −49.1 + 1.3 × TP-R (g/l), which had a coefficient of determination of R 2 = 0.65 (P < 0.001, Supplementary Figure S3). The correlation between serum IgG and the protein refractometer measurements was higher in the present study (r = 0.81) than that reported by Parish et al. (Reference Parish, Tyler, Besser, Gay and Krytenberg1997) (r = 0.68), most likely due to the age differences between the calves (7 d vs. 11 d of age, respectively). Hence, the regression model from Parish et al. (Reference Parish, Tyler, Besser, Gay and Krytenberg1997), IgG = −2,562 + total protein (g/dl) × 670, is likely to have an lower goodness of fit for predicting serum IgG than the prediction equation developed here.
Gamma-glutamyl transferase (GGT)
GGT is found in very low concentrations in the blood of newborn calves but is rapidly absorbed from the colostrum before the gut closes, and hence, is a good indicator of colostrum ingestion (Braun et al., Reference Braun, Tainturier, Laugier, Bénard, Thouvenot and Rico1982; Weaver et al., Reference Weaver, Tyler, VanMetre, Hostetler and Barrington2000). The level of GGT has been also proposed as an indicator of passive immunity transfer (Parish et al., Reference Parish, Tyler, Besser, Gay and Krytenberg1997; Wilson et al., Reference Wilson, Tyler, Besser, Parish and Gant1999; Aydogdu and Guzelbektes, Reference Aydogdu and Guzelbektes2018). Different GGT thresholds for FPIT have been suggested (Perino et al., Reference Perino, Sutherland and Woollen1993; Parish et al., Reference Parish, Tyler, Besser, Gay and Krytenberg1997; Hogan et al., Reference Hogan, Doherty, Fagan, Kennedy, Conneely, Brady, Ryan and Lorenz2015; Cuttance et al., Reference Cuttance, Mason, Denholm and Laven2017a), but the threshold is yet to be firmly established (Cuttance et al., Reference Cuttance, Regnerus and Laven2019).
In order to estimate a FPIT threshold for GGT in the present study, a prediction equation for IgG concentration was generated based on GGT levels at day 1, GGT (U/l) = −3.9 + 55.9 × IgG (g/l) (Supplementary Figure S4). Assuming the FPIT threshold is 10 g/l IgG at day 1 postpartum, the FPIT threshold for GGT level is predicted from this equation to be approximately 555 IU/l. This level is similar to the experimental results from a study by Pekcan et al. (Reference Pekcan, Fidanci, Yuceer and Ozbeyaz2013), who found that calves less than 2 d old with adequate passive immunity transfer had a mean of 578.25 ± 47.45 IU GGT/l. However, the prediction equation based on GGT level at day 1 postpartum only had a coefficient of determination of R 2 = 0.52 (P < 0.001, Supplementary Figure S4), and this estimate of FTP threshold for GGT is not expected to be highly accurate. In addition, the lower correlations and coefficients of determination indicate that plasma GGT activity was not prognostic of IgG concentration, particularly after day 1.
In conclusion, the results presented here validate both Brix and serum refractometry as good methods to estimate colostrum and calf blood components, respectively. Refractometry can be used to adjust the amount of colostrum fed to ensure calves receive sufficient IgG and nutrients from the colostrum or to predict IgG levels in calves and hence, the risk of FPIT. Nevertheless, other factors, such as the timing of the first feed, calf health and body weight, need to be considered to ensure sufficient transfer of passive immunity.
Supplementary material
The supplementary material for this article can be found at https://doi.org/10.1017/S0022029921000340
Acknowledgements
This work was funded by the Davies Research Centre, The University of Adelaide. Cattle were kindly provided by a commercial farm located in Mount Gambier, South Australia. Do Thi Hue was funded by a scholarship jointly provided by the Vietnam Government (Ministry of Agriculture and Rural Development and Vietnam International Education Development) and The University of Adelaide. The authors thank many staff and students from the School of Animal and Veterinary Science, the University of Adelaide for their assistance with sample collection, laboratory work and data analysis, in particular Dr Tong Chen, Dr Darren Miller, Cassandra Marr, Dr Rebel Skirving, Dr Sarah Weaver, and Simone Wijnen (Fontys University of Applied Sciences).