


Introduction
Variances are the raw materials of evolution. Documenting temporal and spatial distribution of evolutionary variances within an ancestor–descendant lineage is important for understanding how evolution occurs (Alroy Reference Alroy2000). Recent studies of fossil records have shown that patterns and modes of evolution, including directional trend, random walk, and stasis, differ between morphologic traits (Hopkins and Lidgard Reference Hopkins and Lidgard2012; Hunt et al. Reference Hunt, Hopkins and Lidgard2015) within the geographic range of a taxon (Grey et al. Reference Grey, Haggart and Smith2008).
These discoveries suggest that earlier interpretations of the evolutionary patterns of some taxonomic groups may be incomplete if deduced from the analysis of a single trait and/or examined from a narrow geographic range. Interpretations of patterns of evolution may be biased by the selection of traits to be analyzed and also by the preferred morphometric methodologies used for a given taxonomic group (e.g., the outline of edge-view is the most often examined in planktonic foraminifera). In addition, traits that are difficult to measure, including some ecologic and physiologic characters, are generally overlooked due to the lack of quantifiable proxies.
Finally, few evolutionary studies have compared evolutionary sequences of a lineage over broad geographic ranges with satisfactory age control. Even for Cenozoic marine microfossils that have by far the best-documented continuous records, reducing uncertainties in dating and correlating multiple evolutionary records to/below ~10 Kyr remains a challenge. This is because robust age control requires a significant amount of data from astrochronology, magnetostratigraphy, and biostratigraphy, which are not always available. For instance, a solid astrochronology over a 1 Myr interval requires several hundred stable isotopic analyses.
In this study, we revisit the middle Miocene Fohsella lineage of planktonic foraminifera. The Fohsella lineage (previously referred to as the Globorotalia fohsi lineage, Supplementary Material) is of particular interest, because it has long been considered an iconic example of gradual morphologic evolution in planktonic foraminifera, as opposed to the model of punctuated equilibrium. Its evolution between ~15 and ~13 Ma is thought to have been gradual, as depicted by successive chronospecies linking the end members of the lineage (Kennett and Srinivasan Reference Kennett and Srinivasan1983). However, Norris et al. (Reference Norris, Corfield and Cartlidge1996) and Eisenach and Kelly (Reference Eisenach and Kelly2006) have shown that the depth distribution of this lineage in the western Pacific experienced a rapid shift from the surface layer to greater depths, suggesting that the ecologic speciation was largely decoupled from the morphologic changes. Motivated by more recent studies that suggest evolutionary changes can be introduced into an evolving lineage independently through different traits (e.g., Hopkins and Lidgard Reference Hopkins and Lidgard2012), we reanalyze the Fohsella lineage by incorporating multiple traits from different geographic settings. Our results show that the evolutionary history of the fohsellid lineage is very dynamic and complex. No single trait is representative of the evolutionary history of this lineage. The reconstruction of a more complete picture of the evolution of planktonic foraminifera requires consideration of multiple traits from broad geographic locations.
Phenotypic Models
Previous studies of planktonic foraminiferal evolution (e.g., Malmgren et al. Reference Malmgren, Berggren and Lohmann1983; Norris et al. Reference Norris, Corfield and Cartlidge1996; Hull and Norris Reference Hull and Norris2009; Pearson and Ezard Reference Pearson and Ezard2014) have focused on the changes through time of the edge view, using either outline or multivariate analysis. Although regarded as reliable proxies of the gross morphology, the biologic and/or taxonomic significance of the edge-view silhouettes is inadequately specified and difficult to interpret. Likewise, morphologic characters such as ratio of length to width have changed in fohsellids through time. While they have been extensively studied (e.g., Hodell and Vayavananda Reference Hodell and Vayavananda1993), providing a wealth of information on this group, it is not clear how they relate to biologic and ecologic characters of species.
Some phenotypic units in living planktonic foraminifera are better studied, and their taxonomic, biologic, and/or ecologic properties are better understood. Quantifying changes in these traits should provide more readily interpretable information on evolutionary patterns than unexplained characters, and sources of evolutionary variations can be more easily diagnosed. For example, although the specific adaptive function of size in planktonic foraminifera is debatable, its correlation with several environmental parameters, such as water temperature in living species (Schmidt et al. Reference Schmidt, Renaud, Bollmann, Schiebel and Thierstein2004), make it possible for us to evaluate the size changes in fossil groups with paleoceanographic proxies. Similarly, the spiral-view morphology and coiling direction on the one hand, and the habitat ecology and size on the other hand, are characters with well-specified taxonomic and ecologic significance. Therefore, in this study we divide the Fohsella phenotype into these four subsets of characters.
Spiral-View Shape
The spiral view provides information on the coiling growth of foraminiferal species (Olsson Reference Olsson1971; Arnold Reference Arnold1983). Its change can be explained by changes in ontogenetic spiral growth of the planktonic foraminifera (Tabachnick and Bookstein Reference Tabachnick and Bookstein1990). We employ landmark-based morphometric analysis to quantify the spiral-view shape. Landmarks placed along sutures and adult test periphery (see “Materials and Methods” and Supplementary Material) help capture changes in chamber shape and sutures that cannot be effectively studied with other morphometric methods, such as outline and multivariate analysis. Theoretically, landmark deformations along principal component axes also help interpret which spiral-growth parameter(s) have generated the most observed variations (Tabachnick and Bookstein Reference Tabachnick and Bookstein1990). For example, adjacent chambers will overlap more when successive chambers are added to the test at a smaller angular-increment rate. As a result, more chambers will be exposed in the final whorl, and each chamber will occupy less area in the final whorl (see Supplementary Material for more illustrations).
Coiling Direction
Genetic and paleontological studies on planktonic foraminifera suggest that heritable change in coiling direction is an important aspect of their evolution, being related in some instances to genetic-level evolution (de Vargas et al. Reference de Vargas, Renaud, Hilbrecht and Pawlowski2001; Kučera and Kennett Reference Kučera and Kennett2002; Darling et al. Reference Darling, Kucera, Pudsey and Wade2004; Darling and Wade Reference Darling and Wade2008; Ujiié and Asami Reference Ujiié and Asami2014). In fohsellids, the coiling direction changed worldwide at ~13.6 Ma from near randomness to strong preference for sinistral coiling that persisted until the extinction of the lineage (Bolli Reference Bolli1950; Blow and Banner Reference Blow and Banner1966; Bolli and Saunders Reference Bolli and Saunders1985; Eisenach and Kelly Reference Eisenach and Kelly2006). Temporal and geographic patterns of coiling direction are studied in this work.
Depth Habitat (δ18O of the Test)
Planktonic foraminiferal species inhabit different ecologic niches in the water column (Hemleben et al. Reference Hemleben, Spindler and Anderson1989). The tests of foraminiferal populations residing at different depths record δ18O values that are specific to those depths due to the temperature gradient of the water column (Fairbanks et al. Reference Fairbanks, Wiebe and Be1980; Birch et al Reference Birch, Coxall, Pearson, Kroon and O’Regan2013). Thus, δ18O measurements allow reconstruction of species stratification in the past. Ecologic subdivision has been proposed as a potential mechanism for sympatric speciation in open-ocean environments (Lazarus et al. Reference Lazarus, Hilbrecht, Spencer-Cervato and Thierstein1995; Norris Reference Norris2000) in the absence of geographic barriers. Previous studies have suggested that fohsellid populations globally migrated from the upper surface to the subsurface at ~13.2 Ma, probably in response to ecologic speciation (Norris et al. Reference Norris, Corfield and Cartlidge1993, Reference Norris, Corfield and Cartlidge1996). We generate δ18O data on individual specimens of fohsellids along with Dentoglobigerina altispira and D. venezuelana, the habitats of which are believed to be, respectively, shallower and deeper than those of fohsellids (Keller Reference Keller1985; Norris et al. Reference Norris, Corfield and Cartlidge1996; Stewart et al. Reference Stewart, Wilson, Edgar, Anand and James2012). New data are combined with previously published data (Norris et al. Reference Norris, Corfield and Cartlidge1996; Eisenach and Kelly Reference Eisenach and Kelly2006) to provide more statistically robust evidence of the divergence of fohsellid populations between 13.5 and 12.9 Ma.
Materials and Methods
Three deep-sea sites with broad geographic coverage were examined (Fig. 1). Fohsellids from Site 806 were studied previously for outline analysis on edge view by Norris et al. (Reference Norris, Corfield and Cartlidge1996), for coiling direction by Eisenach and Kelly (Reference Eisenach and Kelly2006), and for isotopes by both authors. It is the primary site in this investigation and has been resampled at high resolution. Site U1338 has been studied for coiling pattern by Hayashi et al. (Reference Hayashi, Idemitsu, Wade, Idehara, Kimoto, Nishi and Matsui2013). It has been sampled at selective intervals based on astrochronology for comparison with data from Site 806. Site 563 was previously sampled by Wright et al. (Reference Wright, Miller and Fairbanks1992), and magnetostratigraphic and chemostratigraphic data are available for age correlation. We chose these sites because of their relatively good age control. More importantly, the oceanographic conditions at the three sites were very different, especially at Site U1338, with cooler upwelling in the eastern Pacific compared with the warmer waters in the western Pacific. We expect that these differences in temperatures, nutrient levels, and/or water-column structures would have affected the fohsellid populations and generated geographic variations.
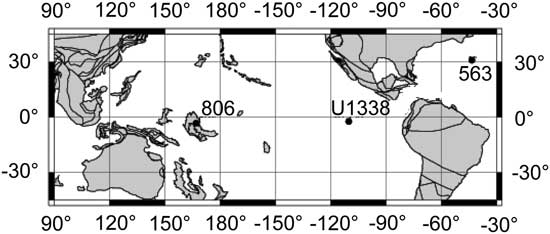
Figure 1 Location of each site discussed in this study. Paleolatitude and geographic reconstruction (13.5 Ma) were generated from the Ocean Drilling Stratigraphic Network website (http://www.odsn.de).
Landmark Morphometrics
Landmark morphometrics are used to quantify the spiral-view shape (suture, chamber, and test periphery). Eleven landmarks were placed where intercameral suture and periphery meet. Given that the number of chambers in the last whorl in fohsellids varies between 5 and 7, 11 landmarks allow a good coverage of the chambers exposed in the last whorl. Six curves of semilandmarks were then placed between landmarks to capture intercameral-suture and chamber-shape information (Fig. 2A). We follow the standard landmark method (Zelditch et al. Reference Zelditch, Swiderski and Sheets2004) in collecting and processing shape variables. The spiral-view shape is then summarized as the first principal component (PC 1) of shape variables. Shape variations due to changes in PC 1 are plotted (Fig. 2B) to illustrate which growth parameters may have contributed to the observed changes (see Supplementary Material for more illustrations).
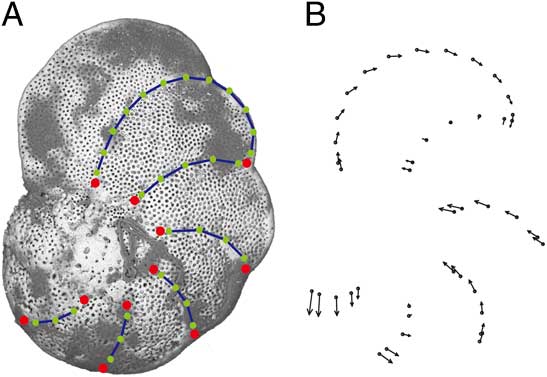
Figure 2 A, Placement of landmarks (large red circles) and semilandmarks (small green circles) along sutures (blue curves); specimen shown here is the holotype of Fohsella lobata Bermúdez; B, shape variations in response to changes in PC 1. The arrows indicate the direction and magnitude of changes.
Statistical Analysis
The evolutionary modes of spiral-view shape and size evolution are evaluated with statistical models developed for random walk, directional changes, and stasis (Sheets and Mitchell Reference Sheets and Mitchell2001; Hunt Reference Hunt2006). Due to uneven sampling in our study, parameters are estimated from a Bayesian approach using the Metropolis algorithm, which numerically simulates the posterior distribution of parameters. Relative model support is based on calculated deviance information criterion (DIC). The lower the DIC value of a model, the better the model is supported by the data relative to competing models. Details of statistical inference are presented in the Supplementary Material.
Temporal Framework
All phenotypic data are combined using an integrated age framework based on correlated astrochronology, magneto- and isotopic stratigraphy (Supplementary Material, Age Model). Records for Sites 806 and U1338 are correlated with a resolution of ~5 Kyr using astronomically tuned, benthic, stable isotope records (Holbourn et al. Reference Holbourn, Kuhnt, Frank and Haley2013, Reference Holbourn, Kuhnt, Lyle, Schneider, Romero and Andersen2014). Age control of the Site 563 record is relatively poor due to the lack of high-resolution isotopic astrochronology. Combined benthic foraminiferal isotopic data and magnetostratigraphy, nevertheless, permit a reliable correlation of the Site 563 record to other sites (Supplementary Material).
Results
Shape
Visually, the PC 1 of the spiral view at Site 806 shows little change between 14.2 and 12.9 Ma (Fig. 3A), and this is supported by the model test (Table 1), which yields the lowest DIC in a simple stasis model relative to the random walk and directional evolution model. However, between ~13.44 and ~13.41 Ma, the PC 1 of two samples shows a rapid shift in the mean values relative to adjacent samples (ANOVA, p<0.001), corresponding to the rapid turnover in coiling direction (Fig. 3C). The distributions of PC 1 at Sites U1338 and 563 are different and are discussed below.

Figure 3 Phenotypic evolution of fohsellids (14.0–12.9 Ma): A, Shape (PC 1); B, size; C, coiling pattern from the three sites studied. Squares in A and B are mean values of samples with 1 SD. Arrows indicate interval of rapid reversal in coiling direction and shift in spiral-view PC 1. EP, eastern Pacific; NA, North Atlantic; WP, western Pacific.
Table 1 Parameter estimates of evolutionary models for first principal component (PC 1) and size. Refer to Supplementary Material for a description of three evolutionary models and parameterization. The evolutionary step in the directional evolutionary model is a normal distribution with mean u step and variance σ; θ and ω are the optimal phenotype and corresponding variance in the stasis model, respectively. Model selection is based on deviance information criterion (DIC) values. The lower the values, the better the model is supported by the data.

Size
The mean size increases substantially at Site 806, showing an “apparent” trend from ~325 µm to ~600 µm between ~14.2 and ~12.9 Ma (Fig. 3B). DIC values (Table 1) provide approximately equal support to a random walk model and a directional model for size changes. The fohsellids are smaller at Sites U1338 and 563 than at Site 806, with the Site U1338 populations exhibiting the smallest average size (~280 µm) (Fig. 3B).
Coiling Direction
At Site 806, the coiling direction is proportionate (~60% sinistral) before 13.7 Ma and then more dextrally dominant between 13.66 and 13.58 Ma. A shift to dominant sinistral coiling occurred at ~13.58 Ma (470.1–473.8 m; Fig. 3C). At Site U1338, the shift to dominant sinistral coiling also occurred at ~13.58 Ma (~360.94–361.34 m, core composite depth below seafloor, hole A [CCSF-A]), in agreement with Hayashi et al. (Reference Hayashi, Idemitsu, Wade, Idehara, Kimoto, Nishi and Matsui2013), who reported the shift at ~361 m CCSF-A. Based on our sampling resolution, we tentatively estimate that this shift took place within 11 Kyr. At Site 563, the coiling direction was variable before 13.67 Ma but with a preference for sinistral coiling between 13.8 and 13.67 Ma. The change in coiling direction to sinistrally dominant may have started slightly earlier at this site (13.67 Ma) than at Sites 806 and U1338. However, this discrepancy in timing may reflect weaker age control at Site 563 (Supplementary Material).
The δ18O Record
The composite δ18O records of Site 806 (Norris et al. Reference Norris, Corfield and Cartlidge1996; Eisenach and Kelly Reference Eisenach and Kelly2006; this study) are characterized by three intervals. Before 13.25 Ma, fohsellid populations have δ18O (−1.2±0.27‰) lighter than that of the surface species D. altispira (−1.0‰) and thermocline species D. venezuelana (−0.5 to approximately −0.75‰) (Fig. 4A,B). From ~13.25 to ~12.95 Ma, the δ18O of the populations is centered over −0.85±0.26‰. This interval is characterized by the occurrence of individuals with δ18O heavier than D. altispira (Fig. 4A,C). After 12.95 Ma, there are no fohsellids with δ18O lighter than D. altispira; only specimens with heavier δ18O are present (Fig. 4A,D). Most individuals from Sites U1338 and 563 are too small to have enough mass for isotopic analysis, preventing a geographic comparison of contemporary populations.

Figure 4 A, Oxygen isotopes of individual fohsellids, surface-water species D. altispira, and thermocline species D. venezuelana from Site 806. Red and gray squares represent δ18O tests for individual fohsellids; purple represents δ18O of D. altispira (dot: this study; dash: data from Norris et al. [Reference Norris, Corfield and Cartlidge1996], fitted with a spline function); yellow represents δ18O of D. venezuelana (dot: this study; dash: data from Norris et al. [Reference Norris, Corfield and Cartlidge1996], fitted with a spline function). B–D, Histograms of fohsellid isotopes of three intervals. Before 13.25 Ma (B), fohsellids were surface species. During 13.25–12.95 Ma (C), the fohsellid populations inhabited both surface and thermocline depths, implying a cladogenetic event at 13.25 Ma. After 12.95 Ma (D), surface populations became extinct.
Mosaic Evolution of Different Traits
Despite some changes in the structure of the upper water column, the warm surface waters of the western equatorial Pacific have been relatively stable over geologic time (Zhang et al. Reference Zhang, Pagani and Liu2014) compared with other water masses, such as upwelling zones and temperate and high-latitude regions. Yet the fohsellid populations at Site 806 exhibit a rather dynamic evolution in this geologically stable environment.
The coiling direction shows a rapid shift to sinistral dominance at ~13.58 Ma within the limit of sampling resolution (~13.66–13.58 Ma), suggesting punctuated changes relative to subsequent long-term stasis. On the other hand, there is an apparent long-term trend toward larger size over the interval studied. Similar to previous research (Hunt Reference Hunt2006), model estimates provide about equal support to a random walk model and a directional model for the apparent size increases, giving no definitive answer on which process is responsible for the increase. However, the geographic pattern of size distribution within the equatorial Pacific suggests that the size increase reflects an active trend. While the size increase at Site 806 is significant, contemporary populations at eastern equatorial Pacific Site U1338 remain small (Fig. 3B). Given the capability of long-distance dispersal of planktonic foraminifera, the development of a geographic cline within the equatorial Pacific, characterized by more nutrient-rich upwelling in the eastern side and a more oligotrophic and stratified water column in the western side, may have played an important role in driving and maintaining the long-term divergence in size within equatorial Pacific (see “Geographic Mosaic” section).
The δ18O pattern of fohsellids at Site 806 suggests a “cladogenetic” event in habitat ecology (Norris et al. Reference Norris, Corfield and Cartlidge1996) and subsequent extinction of one subpopulation. Before ~13.25 Ma, the consistently more negative δ18O of fohsellids relative to the surface water species D. altispira suggests that the fohsellid populations inhabited the uppermost surface waters, recording high sea-surface temperatures. Starting ~13.25 Ma, the δ18O of the fohsellid populations straddled a wider range of values toward the more positive δ18O of D. venezuelana, implying that some fohsellids began exploring new habitats close to the shallow thermocline (Fig. 4). This expansion into a deeper habitat has been suggested as ecologic speciation through ontogenetic migration (Norris et al. Reference Norris, Corfield and Cartlidge1996).
The shallower populations disappeared after ~12.95 Ma. One possible explanation for the disappearance of surface populations involves regional oceanographic changes. As an oligotrophic warm-water species, Fohsella may have been very sensitive to sea-surface temperatures. However, Site 806 is located at the heart of the modern-day western Pacific warm pool. The sea-surface temperature of the studied area has been proven to have been relatively stable (Zhang et al. Reference Zhang, Pagani and Liu2014), and there is no evidence of changes in surface temperatures over the studied interval (Nathan and Leckie Reference Nathan and Leckie2009). Alternatively, if we accept the explanation by Norris et al. (Reference Norris, Corfield and Cartlidge1996) regarding the ecologic speciation through ontogenetic migration in Fohsella, the disappearance of the surface populations may have been ecologic. Fohsellids may undergo depth migration during the ontogeny, inhabiting surface ocean during juvenile stages but calcifying and reproducing at depth during adult stage. If this is true, then the disappearance of surface populations is a pseudo-extinction. However, without isotopic studies on the ontogenetic changes of Fohsella and data from wider geographic coverage, the causes for habitat changes in fohsellids remain undetermined.
Contrary to the dynamic changes in coiling direction, size, and depth distribution, the spiral-view shape shows little change (Fig. 3). One exception is a shift in PC 1 between 13.44 and 13.41 Ma (Fig. 3A, arrow) that appears to be associated with the temporary reversal in coiling direction. This brief reversal in coiling direction may have affected the spiral growth in fohsellids and therefore their spiral-view shape. However, this observation on correlated changes between two traits relies only on two samples at this moment and requires further testing. Except for this brief interval, the spiral-view morphology revealed in PC 1 is stable over time relative to the other three traits.
Living planktonic foraminifera often harbor great genetic diversity within described morphotypes (Darling and Wade Reference Darling and Wade2008). Although these cryptic genotypic populations are difficult to distinguish based on overall morphology, detailed taxonomic work suggests that subtle but consistent differences in some traits, such as coiling pattern, test microstructure, porosity, and depth distribution (as inferred from δ18O), among others, aid recognition of different populations (Huber et al. Reference Huber, Bijma and Darling1997; de Vargas et al. Reference de Vargas, Renaud, Hilbrecht and Pawlowski2001; Darling et al. Reference Darling, Kucera, Pudsey and Wade2004). Our records from the western equatorial Pacific agree with observations in extant populations and reveal that dynamic evolutionary changes occurred at subspecies levels in one of the most stable surface oceanic environments. Because the timing and modes of evolutionary changes in different traits are disassociated, the evolution of fohsellid populations at Site 806 follows a mosaic pattern.
Geographic Mosaic
In addition to the mosaic evolutionary changes of different phenotypic units at Site 806, size and spiral-view PC 1 also exhibit geographic variations superimposed on synchronous coiling-direction changes in our three oceanic locations (Fig. 3), suggesting a geographic mosaic of local adaptation and coevolution among fohsellid populations. Geographic heterogeneity is particularly well marked within the equatorial Pacific. The eastern Pacific populations at Site U1338 stand apart from populations at Site 806 and Site 563 despite the fact that they are geographically intermediate. Because ocean currents should be able to effectively mix and disperse planktonic foraminiferal populations within the equatorial Pacific on a monthly scale (van Sebille et al. Reference van Sebille, Scussolini, Durgadoo, Peeters, Biastoch, Weijer, Turney, Paris and Zahn2015), the apparent and persistent difference in shape and size may reflect faunal provincialism, possibly due to the development of environmental gradients between the western and eastern equatorial Pacific as the Earth’s climate transitioned from a relatively warm phase to a colder mode during the middle Miocene (Flower and Kennett Reference Flower and Kennett1994).
The development of a permanent Antarctic ice sheet at ~13.9 Ma, for example, has been suggested to have promoted shoaling of the thermocline and intensification of upwelling within the eastern equatorial Pacific (Holbourn et al. Reference Holbourn, Kuhnt, Lyle, Schneider, Romero and Andersen2014). The emergence of this “cold tongue” in the eastern side of the basin could have intensified the hydrologic cline within the Pacific. And the cooler, nutrient-rich waters in the eastern Pacific may have had a negative impact on the tropical fohsellids, as indicated by their lower abundance at Site U1338 relative to Site 806 (Site 806: >100 specimens per 10 g sample; Site U1338: ~15–30 specimens per 10 g sample; mass accumulation rates of sediments at the two sites were similar between 14 and 13 Ma, ~3–5 g/cm2 Kyr). Assuming a modern-day correlation between sea-surface temperatures and foraminiferal test size (Schmidt et al. Reference Schmidt, Renaud, Bollmann, Schiebel and Thierstein2004), for example, the west–east oceanographic gradient may explain sustained differences in size and spiral growth (spiral-view shape) in fohsellids.
With these additional oceanographic constraints, the increase in size at Site 806 and corollary divergence between Sites 806 and U1338 were thus probably a response to environmental changes rather than simple random walk, despite the DIC values yielding equal support to both modes. Our ongoing efforts in documenting more fohsellid sequences from other eastern equatorial Pacific sites and reconstructing regional paleoceanography and hydrology might provide further information on the coupled relationship between high-latitude climatic changes and initiation of tropical faunal provincialism during the Neogene.
Regardless of the specific paleoenvironmental trigger for this geographic mosaic, our data agree with earlier studies that suggested that geography is crucial in understanding the modes of lineage evolution (Eldredge et al. Reference Eldredge, Thompson, Brakefield, Gavrilets, Jablonski, Jackson, Lenski, Lieberman, McPeek and Miller2005; Grey et al Reference Grey, Haggart and Smith2008). Several recent studies have suggested that stasis and random walk modes are prevalent, whereas directional evolution is infrequent in paleontological sequences (Hopkins and Lidgard Reference Hopkins and Lidgard2012; Hunt et al. Reference Hunt, Hopkins and Lidgard2015). However, evolutionary processes such as directional trend may occur only in certain geographic areas but become obscure in others. Sampling from locations peripheral to the evolutionary center of a lineage may fail to recover the critical records when lineages gain net morphologic accumulation (e.g., Site U1338 may be located at the edge of the optimal range for Fohsella). Therefore, a more accurate understanding of evolutionary patterns and the role of geography in generating these patterns (Kirkpatrick and Barton Reference Kirkpatrick and Barton1997) requires detailed geographic surveys of lineages under very robust chronologic control. This has not been available in most paleontological records to date.
Evolution of Other Traits
So far, we have illustrated the evolutionary changes of four traits between ~14 and ~13 Ma. However, other traits have also contributed to the total evolutionary variances of fohsellids. At Site 806, Norris et al. (Reference Norris, Corfield and Cartlidge1996) have shown that the angularity of the edge-view projection of fohsellids changed significantly between ~13 and ~12 Ma in a gradual fashion, beginning slightly before the rapid changes in depth habitat (δ18O). At a nearby site in the western Pacific (Site 289), Hodell and Vayavananda (Reference Hodell and Vayavananda1993) documented long-term increases in test area, length, breadth, and ratio of length/breadth from ~15 to ~11.5 Ma. They also discovered a rather rapid δ18O shift in multispecimen isotopic data at ~13 Ma, consistent with patterns seen at Site 806. Unfortunately, limited stratigraphic information from this site prevents us from further combining these data with ours for comparison.
The keel is another characteristic feature of Fohsella, and it has evolved substantially. Early fohsellids are characterized by a rounded periphery without keels. Beginning at ~13.9 Ma, a perforate keel (for definition, see Norris Reference Norris1991) occurred sporadically in adult chambers of fohsellid population. This perforate keel began to extend to preadult chambers in the last whorl and eventually (after ~13.4 Ma) evolved into an “imperforate” band covered with additional calcite on the keel surface, giving a robust and imperforate appearance.
We did not investigate additional details of all traits listed above. On the one hand, the biologic/ecologic significance of these measurements are not yet well understood. For example, it is unclear what the ratio of length/width or the silhouettes of the edge-view projection tells us about the physiology and/or ecology of foraminifera. On the other hand, some of these measurements may not be independent. The test area and other metric measurements may be strongly correlated with test size, in which case the multivariate data set may include redundant measurements. Finally, the evolutionary changes of certain traits, such as different stages of keel development, are difficult to quantify, preventing a succinct numeric summary of their temporal patterns.
Nevertheless, the diverse evolutionary patterns documented in these additional traits lend further support to the interpretation of mosaic evolution in fohsellids, which can be summarized as follows. First, the timing of these evolutionary changes are different. Chronologically, the evolution of an early keel began ~13.9 Ma and evolved into an “imperforate” band after 13.4 Ma. The changes in coiling direction occurred at ~13.58 Ma, with a rapid reversal at ~13.44–13.41 Ma. The expansion of Fohsella populations into the thermocline was at ~13.2 Ma, and the loss of surface subpopulations is dated at ~12.95 Ma. Second, the evolutionary mode varies among traits and/or over time. The spiral-view PC 1 remained stable, while others showed intervals of rapid changes and reversals (coiling direction and depth habitat). Still other traits exhibited long-term trends (e.g., size). Even for the spiral-view shape, the stasis between ~14 and ~13 Ma does not mean that the evolutionary mode of this trait did not change over time. As one of the anonymous reviewers pointed out “the curvature of inter-cameral sutures in spiral view has changed from being radial to curved as chamber shapes evolved from being subround to axially compressed and subacute early in the evolutionary history of the fohsellids during the transition from Fohsella? kugleri to F. peripheroacuta (~late early Miocene to early middle Miocene).” Our recent sampling from Site 806 confirms this observation. However, one of the obstacles to pursuing this question further is our inability to establish high-resolution stratigraphic correlation over wide geographic ranges. The stratigraphy of late early Miocene to early middle Miocene is particularly difficult at this moment (Miller et al. Reference Miller, Baluyot, Wright, Kopp and Browning2017).
In all, because the timing and patterns of evolution of all analyzed traits are different, and different modes may also characterize the same trait, contingent upon the particular time interval being considered (e.g., see Hopkins and Lidgard Reference Hopkins and Lidgard2012), we conclude that no single evolutionary mode is representative of the evolution of the Fohsella lineage. The evolution of various phenotypic units all contributed to the evolution of fohsellids.
Conclusions
Based on improved phenotypic, geographic, and chronologic models, this study presents a picture different from the conventional view of phyletic gradualism in open-ocean planktonic foraminiferal species. The evolutionary history of fohsellids is considerably more dynamic and complicated than previously thought. Rather than “morphing” progressively along a global trend from ancestors to descendants as hypothesized (e.g., Bolli and Saunders Reference Bolli and Saunders1985; Norris et al. Reference Norris, Corfield and Cartlidge1996), the evolution of fohsellids involves stasis, long-term trends, punctuated changes, temporary reversal, and extinction of subpopulations. These evolutionary changes did not occur in concert and were geographically independent: populations from different geographic provinces underwent divergent evolution.
Our findings highlight the fact that estimates of modes and rates of evolution are highly dependent on measured traits and geographic settings. Interpretation based on a single trait from one location will likely underestimate the evolutionary dynamics of a group, even if the lineage is capable of long-distance dispersal, as is the case for the planktonic foraminifera. Also, conventional analytical procedures that overemphasize “pure” morphologic measurements and “overall shape” hinder our capability to diagnose and partition sources of variations during evolution. A more complete and accurate picture of lineage evolution may be obtained from appropriate elaboration of phenotypic models, complemented by measurements of multiple traits, including ecologic characters (such as those carried by the geochemistry of skeletons) from wide geographic areas with fine chronologic controls.
Acknowledgments
We thank R. K. Olsson and D. Bord for their insightful discussion and advice on the evolution of the fohsellid lineage. A. Holbourn generously provided astronomically tuned benthic foraminifera data. J. D. Wright and K. G. Miller provided samples from Site 563 and suggestions on stratigraphic correlations. We thank two anonymous reviewers for their constructive and thoughtful comments. This research was supported by a Rutgers Student Fellowship and Joseph A. Cushman Award for Student Research to W. Si. Stable isotope measurements were provided by Rutgers University in support of research by W.A.B. Samples were provided by the International Ocean Discovery Program.
Supplementary Material
Data available from the Dryad Digital Repository: http://dx.doi.org/10.5061/dryad.h8fr1


