


Introduction
Although the Antarctic continent is almost completely covered by an ice sheet, one of its characteristic features is a surprising diversity and abundance of lakes. Besides subglacial lakes (Siegert et al. Reference Siegert, Carter, Tabacco, Popov and Blankenship2005), the majority of them are situated in coastal oases in continental Antarctica such as the McMurdo Dry Valleys, Vestfold Hills, Larseman Hills, Bunger Hills, Syowa Oasis and Schirmacher Oasis (Verleyen et al. Reference Verleyen, Hodgson, Gibson, Imura, Kaup, Kudoh, De Wever, Hoshino, McMinn, Obbels, Roberts, Roberts, Sabbe, Souffreau, Tavernier, van Nieuwenhuyze, van Ranst, Vindevogel and Vyverman2012). However, many ice-free areas with lakes can also be found on the Antarctic Peninsula and surrounding islands. These lakes mostly occupy depressions created by glacial erosion and were formed following Holocene ice sheet retreat (Vincent & Laybourn-Parry Reference Vincent and Laybourn-Parry2008), or isostatic uplift (e.g. Roberts et al. Reference Roberts, Hodgson, Sterken, Whitehouse, Verleyen, Vyverman, Sabbe, Balbo, Bentley and Moreton2011). Limnological surveys of freshwater lakes in this region have been carried out, for example, on the South Shetland Islands (Toro et al. Reference Toro, Camacho, Rochera, Roco, Banon, Fernandez-Valiente, Marco, Justel, Avendano, Ariosa, Vincent and Quesada2007), and on Beak Island (Sterken et al. Reference Sterken, Roberts, Hodgson, Vyverman, Balbo, Sabbe, Moreton and Verleyen2012) and they have shown a wide range of limnological conditions with nutrient status ranging from ultraoligotrophic to eutrophic.
The Antarctic Peninsula has been identified as one of the most rapidly warming parts of our planet during the last 50 years (Vaughan et al. Reference Vaughan, Marshall, Connolley, Parkinson, Mulvaney, Hodgson, King, Pudsey and Turner2003). There is growing evidence that Antarctic lakes are sensitive indicators of climate change (Quayle et al. Reference Quayle, Peck, Peat, Ellis-Evans and Harrigan2002) as well as being valuable centres of biodiversity (Vincent & Laybourn-Parry Reference Vincent and Laybourn-Parry2008). However, lake distribution, their physical and chemical characteristics, and biology are generally poorly known around the Antarctic Peninsula. Additional studies are thus needed to complete our knowledge of the current limnological diversity in this part of Antarctica.
James Ross Island belongs to a transitory zone between the maritime Antarctic and continental Antarctic regions. More than 80% of the island surface is covered with ice. Only the northernmost part of the island, the Ulu Peninsula, is significantly deglaciated and represents one of the largest ice-free areas (oasis) in the northern part of the Antarctic Peninsula. Multiple glaciation of the island with ice streaming from James Ross Island and the Antarctic Peninsula has resulted in deeply incised glacial valleys, which lie partly on land and are partly flooded by the sea at present (Nývlt et al. Reference Nývlt, Košler, Mlčoch, Mixa, Lisá, Bubík and Hendriks2011). The origin of the lakes on James Ross Island is related to the last deglaciation of the Antarctic Peninsula ice sheet and the retreat of the James Ross Island ice cap during the Late Glacial (Nývlt, unpublished data) and the Holocene, and to relative sea level changes resulting from postglacial isostatic recovery (Hjort et al. Reference Hjort, Ingólfsson, Möller and Lirio1997).
Interaction between volcanic landforms and glacial geomorphology during previous glacial-interglacial cycles and Holocene paraglacial and periglacial processes and relative sea level change has resulted in the complex present-day landscape of James Ross Island (Davies et al. Reference Davies, Glasser, Carrivick, Hambrey, Smellie and Nývltin press). All of these processes have influenced the development of the lakes which are found on the Ulu Peninsula at altitudes ranging from < 20 m above sea level (a.s.l.) near the coast to c. 400 m a.s.l. in the mountain areas.
Until now, the study of lakes on James Ross Island has been mostly limited to palaeolimnological investigations. A detailed description of sediment profiles sampled from lakes in Brandy Bay (including Monolith Lake) resulted in the reconstruction of climate changes in the area spanning the last 5000 years (Björck et al. Reference Björck, Olsson, Ellis-Evans, Håkansson, Humlum and de Lirio1996). However, information about the recent limnological status of the lakes is limited to several temperature, pH and conductivity measurements recorded during investigations of their cyanobacterial microflora (Komárek & Elster Reference Komárek and Elster2008).
The aim of this paper is to describe in detail the lake types found on the Ulu Peninsula, their origin, age, morphometry, and physical and chemical characteristics. The results of this study can serve as baseline information for future limnological investigations in the region of the Antarctic Peninsula, and also for biological assessments of the lakes.
Materials and methods
Study area
James Ross Island (64°10′S, 57°45′W) is a c. 2600 km2 large island situated in the north-western part of the Weddell Sea, close to the northern tip of the Antarctic Peninsula. The climate is characterized by short summers (December–February) when the mean monthly air temperature exceeds 0°C. The annual mean temperature at the Mendel station close to sea level is -6.6°C (2004–09; K. Láska, personal communication 2012). Compared to the South Shetland Islands on the western side of the Antarctic Peninsula, James Ross Island is more arid (Aristarain et al. Reference Aristarain, Pinglot and Pourchet1987). The terrestrial vegetation on the island is limited to non-vascular plants and composed of a predominantly bryophyte and lichen tundra. Human presence is limited to the northern side of the island, where the Czech Johann Gregor Mendel Antarctic research station has been located since 2006. Seasonal Argentinean and British field camps have been established at various locations on the deglaciated part of the Ulu Peninsula during the last five decades, typically located close to water sources such as Phormidium, Monolith, or Lachman lakes.
Deglaciation in this area began before 12.9 ka (Nývlt, unpublished data) and lower-lying areas of the Ulu Peninsula were ice-free at the beginning of the Holocene. A glacially levelled surface, which is synchronous with the Late Glacial deglaciation event, lies at c. 50 m a.s.l. and may be traced along the north-western slope of Berry Hill and at Cape Lachman (Nývlt, unpublished data). However, advances of individual local glaciers are known to have occurred during the Holocene (Björck et al. Reference Björck, Olsson, Ellis-Evans, Håkansson, Humlum and de Lirio1996, Hjort et al. Reference Hjort, Ingólfsson, Möller and Lirio1997, Carrivick et al. Reference Carrivick, Davies, Glasser, Nývlt and Hambreyin press). Evidence for this includes moraine ridges in Brandy Bay (Hjort et al. Reference Hjort, Ingólfsson, Möller and Lirio1997, Davies et al. Reference Davies, Glasser, Carrivick, Hambrey, Smellie and Nývltin press) and vast debris-covered glaciers or rock glaciers along the eastern side of the Lachman Crags Mesa (Fukui et al. Reference Fukui, Sone, Strelin, Torielli, Mori and Fujii2008). Only small glaciers are present in the northern part of the Ulu Peninsula at present (cf. CGS 2009, Engel et al. Reference Engel, Nývlt and Láska2012). They mostly represent remnants of former larger neoglacial glaciers and their retreat has been detected both from remote sensing data, and in the field (Carrivick et al. Reference Carrivick, Davies, Glasser, Nývlt and Hambreyin press).
Rapid deglaciation during the Late Glacial and earliest Holocene resulted in the formation of marine terraces (Hjort et al. Reference Hjort, Ingólfsson, Möller and Lirio1997). The highest late Quaternary marine terrace, which lies at c. 30 m a.s.l., was ‘tentatively’ dated by Hjort et al. (Reference Hjort, Ingólfsson, Möller and Lirio1997) at c. 8560 ± 100 14C yr bp. Remnants of this marine level may be found south of St. Martha Cove, near the Mendel station, and in the Abernethy Flats. A further prominent Holocene terrace at c. 16 m a.s.l. described by Hjort et al. (Reference Hjort, Ingólfsson, Möller and Lirio1997) is well preserved at the neck of Cape Lachman (Nývlt, unpublished data), in Abernethy Flats and in the Phormidium Lake area. The younger marine terraces found at c. 8 and c. 4 m a.s.l. have not been dated so far, but they probably represent late Holocene sea levels. Similar relative sea level changes have been recorded by Roberts et al. (Reference Roberts, Hodgson, Sterken, Whitehouse, Verleyen, Vyverman, Sabbe, Balbo, Bentley and Moreton2011) for Beak Island, which is located <50 km north-east of the Ulu Peninsula. On the basis of this study, the ‘tentative marine limit of 30 m’ of Hjort et al. (1997) at 8560 ± 100 14C yr bp (8131 cal. yr bp) was reinterpreted as an earlier Quaternary marine limit. The well developed beach ridges up to 18 m a.s.l. at Comb Ridge on The Naze (Hjort et al. 1997), which correspond with a marine terrace at c. 16 m a.s.l. at Cape Lachman, in Abernethy Flats and in the Phormidium Lake area, are probably the Late Glacial to Holocene transition relative sea level maximum (Nývlt, unpublished data).
Bedrock geology
The deglaciated part of the Ulu Peninsula is composed of two main geological units, namely Cretaceous back-arc basin sediments and mostly subglacial Neogene to Quaternary volcanic rocks (e.g. Olivero et al. Reference Olivero, Scasso and Rinaldi1986, Smellie et al. Reference Smellie, Johnson, McIntosh, Esser, Gudmundsson, Hambrey and van Wyk de Vries2008, Svojtka et al. Reference Svojtka, Nývlt, Murakami, Vávrová, Filip and Mixa2009). Four formations (Kotick Point, Whisky Bay, Hidden Lake and Santa Marta formations) of the Cretaceous James Ross Basin crop out in the study area. They are composed mostly of siltstones, sandstones and some conglomerate units (e.g. Olivero et al. Reference Olivero, Scasso and Rinaldi1986, Whitham et al. Reference Whitham, Ineson and Pirrie2006). Back-arc, mostly subglacial, basaltic volcanic rocks of the James Ross Island Volcanic Group (JRIVG; Nelson Reference Nelson1966) intruded Cretaceous marine sediments since the late Miocene (Smellie et al. Reference Smellie, Johnson, McIntosh, Esser, Gudmundsson, Hambrey and van Wyk de Vries2008, Košler et al. Reference Košler, Magna, Mlčoch, Mixa, Nývlt and Holub2009). Most of the volcanic eruption took place during glacial periods below the ice cover (Smellie et al. Reference Smellie, Johnson, McIntosh, Esser, Gudmundsson, Hambrey and van Wyk de Vries2008), which resulted in specific volcanic landforms, such as volcanic mesas (tuyas), tuff cones, dykes or subvolcanic plugs. Miocene–Pliocene glacigenic, glaciomarine and marine sediments up to >100 m thick were identified within or below the JRIVG (e.g. Nývlt et al. Reference Nývlt, Košler, Mlčoch, Mixa, Lisá, Bubík and Hendriks2011).
Sampling procedures and limnological measurements
Twenty-nine representative lakes were studied during the summer season (January–February) in 2008 and 2009 (Table I, Fig. 1). We included representatives of all major lake types (according to their bedrock, origin, geomorphological position, and hydrological stability) present on the Ulu Peninsula (see below). The temperature, conductivity, concentration of dissolved oxygen and pH of the lakes were measured in the field using a YSI 600 meter. Water samples were collected from the surface layer, immediately filtered through a 200-μm polyamide sieve to remove zooplankton and coarse particles, and kept frozen until analysed at the Institute of Hydrobiology (Czech Republic). The majority of the lakes were sampled from the shore (ARG, BLA, BLU, CYA, DAN, FED, GIN, GR1–2, KA1–2, LA1–2, MUD, OM1, PHO, RED and WHI). Two lakes with persisting ice cover were sampled from their central part (NAD and RO1). A rubber boat was used for bathymetric measurements and sampling of the lakes BIB, LAS, MON, OM2, RO2 and VO1–4 (see Table I for codes). Vertical profiles of temperature, conductivity, oxygen concentration and photosynthetically active radiation (PAR) were measured in two deeper lakes under their thick ice cover (RO1 and NAD1). A quantometric sensor (400–700 nm) attached to a radiometer (PU 550, Meopta, Czech Republic) was used for PAR measurements. In two contrasting lakes (deep partially frozen RO1 and shallow LA1 without ice cover), lakewater temperature was monitored using registration thermometers (Minikin T, EMS Brno, Czech Republic) installed on the bottom of LA1 and 1 m below the ice cover of RO1. Temperature was recorded every 30 minutes from 5 January–3 February 2009.
Table I Location and main characteristics of the James Ross Island lakes and their catchments.
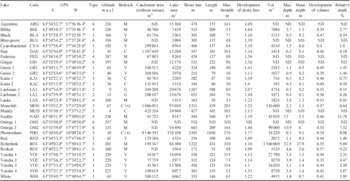
Bedrock explanation: C = Late Cretaceous marine sediments, G = Miocene–Holocene glacial sediments composed mostly of local volcanic rocks and marine Cretaceous sediments, with minor admixture of Antarctic Peninsula derived igneous and metamorphic rocks, M = recent glacigenic (morainic) sediments with present glacier ice composed mostly of local volcanic rocks, with some admixture of marine Cretaceous sediments, V = Neogene volcanic rocks consisting mostly of hyaloclastite breccias, tuffs and subaerial basalts.
ND = not determined.
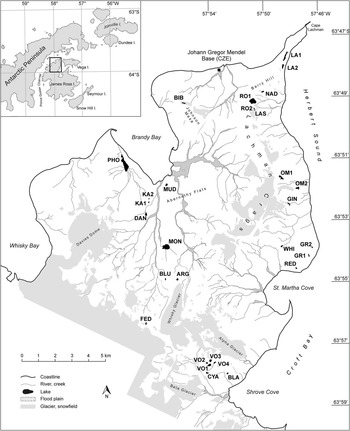
Fig. 1 Detailed map of the Ulu Peninsula showing the location of lakes sampled in 2008–09. The inset map shows the tip of the Antarctic Peninsula with the position of James Ross Island and the Ulu Peninsula. Topography based on a map by the Czech Geological Survey (CGS 2009). For lake codes, see Table I.
Bathymetric mapping followed Česák & Šobr (Reference Česák and Šobr2005). Lake shorelines were mapped with hand GPS equipment at an interval of about 5–10 m (depending on lake areas). Depth sounding was conducted using a Garmin GPSmap 178C echo sounder. The depth of shallow lakes (< 0.5 m) was measured by a calibrated lath. Positions of measurements were localized by hand GPS equipment. Ground plan and depth measurements were processed using Map Info 10. Depth interpolation was processed in Surfer 8. Morphometric characteristics were calculated according to Hutchinson (Reference Hutchinson1957) and bathymetric maps were created.
Water analyses
In the laboratory, samples were filtered with either membrane filters (pore size of 0.45μm) for the determination of ions or with glass-fibre filters (pore size of 0.4μm) for other analyses, except for samples for acid neutralizing capacity (ANC, determined by Gran titration), conductivity, and total concentrations of P, N and organic C, which were determined in unfiltered samples.
Methods used for the determination of total, dissolved, and particulate organic carbon (TOC, DOC, and PC), total, dissolved and particulate nitrogen (TN, DN, and PN), and total, dissolved, particulate, and soluble reactive phosphorus (TP, DP, PP, and SRP) are summarized in Table II. Ion concentrations (Cl-, SO42-, F-, NO3-, NH4+, Ca2+, Mg2+, Na+, K+), except for NO2-, were determined by ion chromatography. Concentrations of NO2- and dissolved silica (Si) were determined spectrophotometrically (Table II). Data on ionic concentrations were used to calculate ionic strength. Concentrations of Fe and Mn were analysed by atomic absorption spectroscopy in lakes sampled in 2009. When the NO3-N and NH4-N concentrations were below their detection limits of 5 μg l-1, half of this value was used in subsequent statistical analyses and dissolved organic nitrogen (DON) calculations (Table III). Concentrations of other constituents were always above their detection limits.
Table II Methods used for the determination of chemical composition of lakes.

TOC = total organic carbon.
Table III Physical and chemical characteristics of the lakes.

Note: Oxygen saturation varied from 90–180% (median 102%); ionic strength from 0.3–13.8 (median of 1.0) mmol l-1; and F- concentrations from 0.01–0.12 (median of 0.03) mg l-1. Fe and Mn concentrations determined for lakes sampled in 2009 varied within 2–45 and 0.3–8.5 μg l-1, respectively. For codes, see Table I, for explanations, see Table II.
ANC = acid neutralizing capacity, ND = not determined. For other abbreviations see Table II.
Reliability of the analytical results was checked by means of an ionic balance control approach and a comparison between measured and calculated conductivities (Kopáček et al. Reference Kopáček, Hejzlar and Mosello2000). In this calculation, positive ANC values were assumed to be equal to HCO3- concentrations, no ANC value was ≤ 0 μmol l-1. Using this approach, the differences between the sum of cations and the sum of anions ranged from -5.6 to 1.6% (with median of -0.3%) of the total ionic content.
Statistical analyses
All limnological variables except pH were log (x+1) transformed and standardized prior to statistical analyses. First, groups of significantly correlated variables (P < 0.05) were identified by calculating a Spearman correlation matrix. Based on this, we selected a group of 14 representative variables, which were subsequently used in multivariate analyses. Principal component analysis (PCA) was run in Canoco 4.5 (ter Braak & Šmilauer Reference ter Braak and Šmilauer2002) to visualize the variability within the dataset. Since the gradient lengths in the data were short, we used redundancy analysis (RDA) to assess whether the differences in lakewater chemistry are related to lake altitude and morphology (maximal depth, lake area), lake age and bedrock characteristics. We created dummy variables for each of the bedrock types (C, V, G, M, see below) and lake ages (two age categories). In case of mixed bedrock character, a value of 0.5 was assigned to appropriate variables. Variance partitioning was applied to test the redundancy of variables or variable groups used in RDA (Borcard et al. Reference Borcard, Legendre and Drapeau1992), which resulted in five fractions: 1) the unique effect of lake morphology, 2) the unique effect of lake age, 3) the unique effect of bedrock type, 4) overlap between 1–3, and 5) unexplained variation.
Results
Bedrock type
Lakes at the northern deglaciated part of the Ulu Peninsula occurred on four main bedrock types (Table I).
The first group of lakes (DAN, KA1, KA2, MUD and partly MON, PHO) lie on Cretaceous marine sediments (bedrock C). All of these lakes are situated in the area where the Santa Marta Formation crops out, hence their bedrock is rather calcareous and is composed predominantly of sandstone and siltstone units, from which corresponding grain-size fractions originate.
Higher-lying lakes located on levelled surfaces lie predominantly on volcanic mesas or lowered volcanic surfaces. Therefore, their bedrock is composed of Neogene basaltic volcanic rocks comprising mainly sub-aerial cap basalts, hyaloclastite breccias and tuffs (bedrock V).
The third group of lakes (LA1–2 and partly MON, PHO) lie in the area of glacial sediment drapes, which are composed dominantly of local Neogene basaltic volcanic rocks and Cretaceous marine sediments (partly calcareous) with some admixture of erratic material (mostly metasediments and granitoids) derived from the Antarctic Peninsula (bedrock G).
The last and most common group of lakes lies in recent glacial (morainic) sediments connected with glaciers (bedrock M). As these glaciers originate mostly from volcanic mesa slopes or surfaces, they mostly carry local volcanic rocks. However, some admixture of Cretaceous marine sediments cannot be excluded, as Cretaceous material has been found, for example, in the frontal moraine of Whisky Glacier.
Lake types
According to their origin, geomorphological position and hydrological stability, six lake types can be distinguished on the Ulu Peninsula (Table I):
1) Stable shallow lakes on higher-lying levelled surfaces (BLA, CYA, GR1–2, RED, VO1–4, WHI, Fig. 2a). These lakes are among the oldest in the studied region. The last deglaciation of these glacially-levelled volcanic surfaces took place during the early Holocene and the lakes must have originated after that. Therefore, the lakes are regarded as permanent and old to very old, with a persistence of hundreds to thousands of years. Their winter ice cover melts at the beginning of summer. They are situated mostly in the south-eastern part of the study area not far from the coastline at middle to higher altitudes (40–185 m a.s.l.). The lakes are mostly small and shallow with a maximum depth of typically < 1.5 m. Lakes VO1–4 lie farther from the coast at altitudes 221–235 m a.s.l. They are the largest and deepest (up to 3.7 m) within this group.

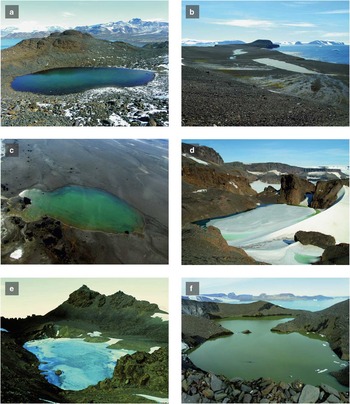
Fig. 2 Subset of lakes representing various lake types found on the Ulu Peninsula. a. Stable shallow lake of higher-lying levelled surfaces (type 1, RED), b. shallow coastal lakes (type 2, LA1–2), c. stable lake in old moraine (type 3, MON, picture V. Janoušek), d. small unstable lake in young moraine (type 4, FED), e. deep cirque lake (type 5, NAD), and f. kettle lake (type 6, OM2). For lake codes, see Table I.
2) Shallow coastal lakes (LA1–2, MUD, Fig. 2b). These lakes developed mostly in the early to mid Holocene, following relative sea level fall and/or glacier retreat in the coastal areas. LA1–2 and MUD are of oblong form, very shallow (maximum depth is only 0.3 m) and lie in the proximity of the sea at very low altitudes. High aeolian input of silty–sandy material originating mostly from Cretaceous sediment affects depositional rates, their bottoms are therefore composed of a thick (up to > 2 m) layer of sediments. High sediment deposition and irregular water supply mostly from thawing snow patches limit their stability and we cannot exclude desiccation events during the history of these shallow lakes. This was confirmed in February 2012, when LA1 was found dry (M. Barták, personal communication 2012). This lake group was most probably formed during the mid-Holocene times. These lakes are very old (they are present for thousands of years) and semi-permanent, as seasonal drying cannot be excluded.
3) Stable lakes in old moraines (DAN, KA1–2, MON, PHO, Fig. 2c). Advancing local glaciers accumulated large morainal ridges during the Holocene neoglacial period, degradation of which created numerous lakes. Only the largest and most stable have lasted until the present. Hence these lakes are permanent and very old, with their persistence in the order of thousands of years. They are located in the western part of the study area at low to mid-altitudes. They have a very similar slightly oblong form, and their surface area varies from 1500–158 100 m2. These lakes are very shallow (maximum depth 0.5 m), with the exception of the higher situated MON (77 m a.s.l.), which is up to 2.2 m deep.
4) Small unstable lakes in young moraines (BIB, FED, Fig. 2d). Young moraines in front of retreating local glaciers host small lakes with mostly stony bottoms, which are usually ephemeral. They are young and originated from the last retreat of local glaciers. Their maximum expected age could be approximately a century or only some decades. They are ephemeral, as they are mostly ice-dammed marginal lakes and further glacier thawing may induce their complete discharge. Their surface and catchment areas are amongst the smallest of the studied lakes. They have a rather elongate form with quite high maximum depths.
5) Deep cirque lakes (NAD, RO1, Fig. 2e). Deep glacial cirques occur on the lee sides of some volcanic mesas, where accumulation of drifting snow allowed the formation of cirque glaciers. Numerous cirque lakes have evolved due to the recent decay of local glaciers on James Ross Island. Their key feature is the presence of extensive ice cover, which persists at least partly during summer. These lakes are stable in the order of tens of years, however, further thawing due to increasing temperatures will induce their decay. We may therefore assign them as being less-stable. They are young and, similar to the unstable lakes in young moraines, probably originated during the last retreat of local glaciers. RO1 and NAD have morphometric parameters typical for cirque lakes, they have large water volumes and very high maximum and relative depths.
6) Kettle lakes (ARG, BLU, GIN, LAS, OM1–2, RO2, Fig. 2f). The youngest and least stable lakes have evolved in debris covered glacier systems by ice degradation in kettle-holes, which have subsequently filled with water. These lakes are the most abundant lake type on James Ross Island. They might persist for years or a few decades only. Therefore, we assign them as being very young and ephemeral. Their surface area varies from 1500–16 500 m2. The maximum and relative depths are also very high and temporarily variable. Depth soundings were done only on three kettle lakes, so it is not possible to provide a detailed comparison with the other lake types.
Detailed morphometric parameters are presented in Table I. Bathymetric maps of 23 lakes are given as Figs S1–S23, which will be found at http://dx.doi.org/10.1017/S0954102012000934.
Physical characteristics
The lakes were ice-free in January–February of 2008 and 2009, with the exception of FED, NAD and RO1–2. Ice break-up of RO2 was observed in mid-February 2008 and this kettle lake was found dry in 2009.
NAD and RO1 are deep cirque lakes and were covered by ice, which was up to 2 m thick and had a characteristic candle-ice structure (up to 30 cm long) at the time of sampling. With the progressing summer season, these two lakes started to melt at the margins and approximately half of their area became ice-free by February 2008. In 2009, the melting progressed more quickly in January, but was interrupted by rapid cooling in February. FED is situated in a young moraine at the highest altitude of all the lakes (Table I) and its whole surface was frozen at the end of January 2009. However, water was present under a thin ice layer close to the shoreline.
The thermal regime of the lakes was mainly driven by their geomorphological and hydrological position. Important diurnal temperature fluctuations were observed in shallow lakes. In LA1, water temperature ranged from a maximum of 18.2°C to a minimum of -0.8°C (period from 5 January–3 February 2009). Mean (± standard deviation) water temperature was 5.3 ± 4.1°C and the maximum diurnal fluctuation (17.1°C) was observed on 12 January 2009. Subzero episodes were more frequent towards the end of the season. As expected, very stable temperature conditions occurred in the deep frozen lakes: the temperature of RO1 (cirque lake) 1 m below the ice was 0.5 ± 0.1°C during the period of measurement (Fig. 3). In 2009, over-winter temperature logging in the central part of LA1 showed a rapid freezing of the lake at the end of the summer and subzero temperatures at the sediment surface during the entire winter.
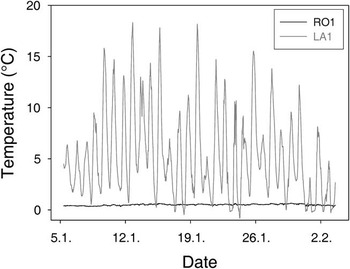
Fig. 3 Lakewater temperature recorded by registration thermometers at 30 min intervals in a cirque (RO1) and a shallow coastal lake (LA1) from 5 January–3 February 2009.
The oxygen concentration was close to the saturation point in the majority of the lakes (Table III). High oxygen oversaturation coincided with weather conditions being favourable for photosynthesis at the time of sampling.
Except PAR, the vertical profiles of the basic physical and chemical parameters measured were almost stable in RO1 down to the depth of 20 m. Photosynthetically active radiation was attenuated at a depth of 8 m, which corresponded to a vertical extinction coefficient of 1.1 m-1 (Fig. 4a). In NAD, only a small amount of variation was observed with increases in temperature, conductivity and oxygen concentration towards the bottom. Photosynthetically active radiation profiles were measured on two contrasting days (sunny and cloudy) with c. 2% of the surface PAR reaching the lake bottom (extinction coefficient 0.4 m-1, Fig. 4b). The ice cover of this lake was retreating in the littoral zone at the time of sampling.
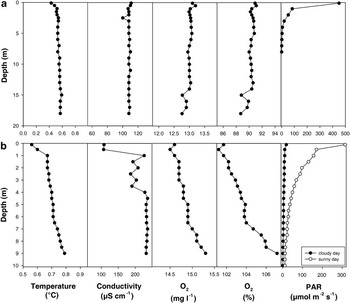
Fig. 4 Vertical profiles of the main physical and chemical parameters in two cirque lakes. a. RO1 (9 February 2008), and b. NAD (13 February 2008). Photosynthetically active radiation (PAR) in NAD was also measured on 14 February 2008 (sunny day).
Water chemistry
Lakewater pH was circum neutral to slightly alkaline (6.8–9.5). The other chemical parameters were highly variable (Table III).
Conductivities were in the range 25–1094 μS cm-1 (median 91 μS cm-1). Due to the strong correlation between conductivity and the concentrations of Ca2+, K+, Mg2+, SO42- and Cl- (all P < 0.0001), only conductivity was used in the subsequent multivariate analyses. The PCA of all lakes revealed that conductivity and DOC concentration were positively correlated and depth, altitude and SRP were negatively correlated with the first PCA axis. Hence, these variables govern the main limnological diversity in the region. The second PCA axis was most correlated with ANC and lake surface area. High conductivity and DOC values were characteristic for shallow coastal lakes (type 2). Soluble reactive phosphorus and NO3-N concentrations were high in the deep kettle (type 6) and cirque lakes (type 5) at higher altitudes. Stable lakes (types 1 and 3) showed a rather diverse lakewater chemistry. Overall, there was a gradual transition of lake types along the first axis (Fig. 5, Table III).
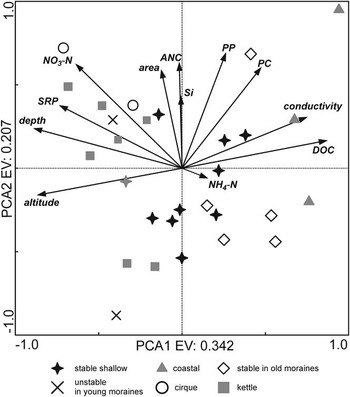
Fig. 5 Principal component analysis (PCA) showing the correlation of the main limnological characteristics of the lakes. The position of individual lakes within the diagram is indicated, together with the information about lake type. For abbreviations, see Table II.
The significant relationship between lake type and lakewater chemistry (conductivity, ANC and concentrations of DOC, PC, DON, PN, NH4-N, NO3-N, PP and SRP) was confirmed by RDA (not shown). To identify the characteristics explaining the greatest amount of variation in lakewater chemistry, we performed RDA and subsequent variance partitioning with the following variables or variable groups: 1) bedrock: C, G, V, M (see Bedrock type and Table I), 2) lake age (see Lake types), and 3) lake altitude and morphometry (maximum depth, lake area). All the canonical axes together explained 60.4% of the total variability in lakewater chemistry. The unique contributions of the individual variables were as follows: bedrock (14.2%), lake age (9.8%) and lake altitude and morphometry (8.2%). The proportion of the variability explained jointly by these characteristics without the possibility of separating their effects was a further 28.2%. The redundancy of the variables in explaining lakewater chemistry was thus quite high, because they were highly intercorrelated (Fig. 6). The proportion of unexplained variation was 39.6%.
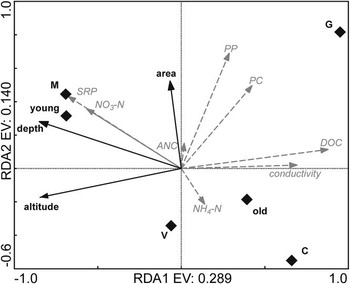
Fig. 6 The influence of bedrock, lake age, and lake altitude and morphometry on water chemistry (redundancy analysis). For details, see text. Old = lake types 1, 2, 3; young = lake types 4, 5, 6. C = Late Cretaceous marine sediments, G = Miocene–Holocene glacial sediments composed mostly of local volcanic rocks and marine Cretaceous sediments, M = recent glacial sediments, and V = Neogene volcanic rocks. For more abbreviations, see Table II.
To identify the sources of the major ions in the lakewater, we compared their ratios to those of seawater. The highest concentrations of Na+, K+, Ca2+, Mg2+, SO42- and Cl- were recorded in coastal lakes (type 2) close to the sea shore with medians of 44.3, 2.1, 40.2, 10.1, 152.4 and 66.4 mg l-1, respectively. Other lake types were characterized by significantly lower concentrations of these ions (Table III).
All the catchments were the source of HCO3- and almost all were also the source of Ca2+. Concentrations of Ca2+ were generally low with a median of 4.4 mg l-1. However, some lakes exhibited one order of magnitude higher Ca2+ concentrations (e.g. 58–64 mg l-1 in KA1 and KA2). Evidence for additional sources from the catchment has also been found for Na+, K+, Mg2+, SO42-, Cl- and NO3-N. Furthermore, the ionic ratios suggested internal alkalinity generation in several lakes with high NO3-N concentrations (OM1, OM2 and RO1, Table III).
We observed higher concentrations of DOC in older lakes (with a median of 1.91 mg l-1, in comparison to 0.70 mg l-1 in young lakes). This was also the cause of their difference in TOC. The same pattern in relation to lake age was observed for dissolved organic phosphorus (DOP) with medians of 4.1 μg l-1 (old lakes) and 1.1 μg l-1 (young lakes, Fig. 7).

Fig. 7 Concentrations of carbon (C), nitrogen (N) and phosphorus (P) fractions in old and young lakes (medians). The differences were statistically significant for dissolved organic carbon (DOC, P = 0.0002), dissolved inorganic nitrogen (DIN, P = 0.03), dissolved reactive phosphorus (SRP, P < 0.0001) and dissolved organic phosphorus (DOP, P = 0.003). For more abbreviations, see Table II.
The lakes also exhibited a significant difference in dissolved inorganic nitrogen (DIN) and SRP concentrations, with elevated values in young lakes at higher altitudes (Fig. 7). The concentrations reached up to 220 μg l-1 NO3-N (in RO1) and 113 μg l-1 SRP (in OM1).
Particulate nutrient concentrations (PC, PN and PP) were very variable, with highest values in the coastal lake LA1 (Table III). In contrast to dissolved nutrients, there were no significant differences in PC, PN, PP and their ratios between the two lake age categories.
Discussion
Stable shallow lakes on higher-lying levelled surfaces originated after the deglaciation of volcanic mesas. Johnson et al. (Reference Johnson, Bentley, Roberts, Binnie and Freeman2011) showed that higher-lying areas of the Ulu Peninsula were ice-free some 6.5–8 ka ago. However, later appearance of these lakes is also possible, as we have no exact dates from their sediments. Shallow coastal lakes formed after c. 7000 yr bp following relative sea level fall (Hjort et al. Reference Hjort, Ingólfsson, Möller and Lirio1997). The coastal lake at lower altitude (MUD) was formed probably sometime after 3000 yr bp according to regional relative sea level curves (Roberts et al. Reference Roberts, Hodgson, Sterken, Whitehouse, Verleyen, Vyverman, Sabbe, Balbo, Bentley and Moreton2011). Small unstable lakes in young moraines originated from glacial retreat since the last advance of local glaciers (Carrivick et al. Reference Carrivick, Davies, Glasser, Nývlt and Hambreyin press). Although we have no exact timing of this advance, it could be correlated with the Little Ice Age and therefore the maximum expected age of these lakes could be approximately a century or rather some decades. The same is true for the deep cirque lakes, which evolved due to recent decay of local glaciers on James Ross Island (e.g. Carrivick et al. Reference Carrivick, Davies, Glasser, Nývlt and Hambreyin press). Kettle lakes are, on the contrary, very ephemeral, as their outbursts are quite common. One of these events was recently described by Sone et al. (Reference Sone, Fukui, Strelin, Torielli and Mori2007).
In summary, the oldest lakes from our dataset are shallow coastal lakes (type 2), together with stable lakes in old moraines (type 3) and partly with stable shallow lakes of higher-lying levelled surfaces (type 1). Young lakes are represented by deep cirque lakes (type 5), small unstable lakes in young moraines (type 4), and the youngest kettle lakes (type 6). The lakes of the Ulu Peninsula are thus relatively young in comparison with other regions in Antarctica (Vincent & Laybourn-Parry Reference Vincent and Laybourn-Parry2008). Based on their geomorphological and hydrological stability, the most stable are shallow lakes of higher-lying levelled surfaces (type 1) and lakes in old moraines (type 3), followed by semi-stable shallow coastal lakes (type 2), less-stable deep cirque lakes (type 5), and small unstable lakes in young moraines (type 4). Kettle lakes (type 6) are very ephemeral.
The high diversity of lake types found on the relatively small area of the Ulu Peninsula underlies the variable physical and chemical characteristics of the lakes. Due to the harsher climatic conditions on James Ross Island, the timing of ice break-up is probably slightly delayed in comparison with lakes on the western side of the Antarctic Peninsula (Toro et al. Reference Toro, Camacho, Rochera, Roco, Banon, Fernandez-Valiente, Marco, Justel, Avendano, Ariosa, Vincent and Quesada2007). Some lakes at higher altitudes may even remain permanently ice-covered. However, comparison of the two sampling years showed that the ice cover status of the lakes is obviously very variable in climatically different years. Except for LA1, we have no direct evidence that no liquid water occurred under the ice cover of other shallow lakes over winter. Freezing dynamics has been demonstrated as a very important factor structuring the chemistry and biological communities of Antarctic shallow lakes (Hawes et al. Reference Hawes, Safi, Sorrel, Webster-Brown, Brown and Arscott2011) and is closely related to lake depth (Sabbe et al. Reference Sabbe, Hodgson, Verleyen, Taton, Wilmotte, Vanhoutte and Vyverman2004). At the time of sampling, light reached the bottom in most of the lakes with the exception of the deep cirque lake RO1 and probably several kettle lakes (e.g. ARG, OM1–2, vertical profiles not measured), which were very turbid. High turbidity also reduced light penetration in coastal lakes (type 2), which receive a high input of fine material originating from Cretaceous sediment.
The lowest pH, ANC and conductivity values, which were found in BIB, were probably associated with the intensive ice cover thawing at the time of sampling, which resulted in a decrease in ionic composition. Ice cover dynamics can apparently affect the chemical composition of lakewater, as was demonstrated by Verleyen et al. (Reference Verleyen, Hodgson, Gibson, Imura, Kaup, Kudoh, De Wever, Hoshino, McMinn, Obbels, Roberts, Roberts, Sabbe, Souffreau, Tavernier, van Nieuwenhuyze, van Ranst, Vindevogel and Vyverman2012) for a large set of Antarctic lakes. On the other hand, pH values around 9 were recorded in lakes with high oxygen concentrations, suggesting the influence of photosynthesis on pH (see above).
A strong marine influence on lakewater chemistry, decreasing with lake altitude, was confirmed. Distance to the coastline was already identified as one of the important factors driving water chemistry of glacial lakes in East Antarctica (Borghini et al. Reference Borghini, Colacevich, Caruso and Bargagli2008, Verleyen et al. Reference Verleyen, Hodgson, Gibson, Imura, Kaup, Kudoh, De Wever, Hoshino, McMinn, Obbels, Roberts, Roberts, Sabbe, Souffreau, Tavernier, van Nieuwenhuyze, van Ranst, Vindevogel and Vyverman2012). The highest conductivity was recorded in the shallow coastal lake LA1 (1094 μS cm-1), which is strongly influenced by sea spray due to its geomorphological position (Fig. 1). In contrast to the neighbouring LA2, with one order of magnitude lower conductivity, it lacks the constant supply of meltwater from the permanent snowfields above the lake (Fig 2b). Brackish and saline lakes, which are common elsewhere in Antarctica (Vincent & Laybourn-Parry Reference Vincent and Laybourn-Parry2008), are absent on the Ulu peninsula, because the lakes are of glacial origin and relatively young (Verleyen et al. Reference Verleyen, Hodgson, Gibson, Imura, Kaup, Kudoh, De Wever, Hoshino, McMinn, Obbels, Roberts, Roberts, Sabbe, Souffreau, Tavernier, van Nieuwenhuyze, van Ranst, Vindevogel and Vyverman2012).
The effect of bedrock on lakewater chemistry was also apparent especially in the case of the lakes in the Brandy Bay area (Fig. 1). These lakes belong mostly to type 3 (stable lakes in old moraines), and their chemistry is influenced by a strong enrichment from their Cretaceous bedrock. In fact, bedrock diversity was identified by variance partitioning as the most important factor driving lakewater chemistry on the Ulu Peninsula. A significant contribution of rock weathering to lakewater chemistry has been previously reported from Antarctica (e.g. Borghini & Bargagli Reference Borghini and Bargagli2004).
Furthermore, we observed significant differences in nutrient chemistry between old (lake types 1, 2, 3) and young lakes (lake types 4, 5, 6; Fig. 7). The positive relationship between DOC concentrations and lake age was reported by various authors (e.g. Engstrom et al. Reference Engstrom, Fritz, Almendinger and Juggins2000). The highest DOC values were typical for very shallow coastal lakes (type 2), which were characterized by prominent benthic microbial mats. On the other hand, the low DOC concentrations in young lakes are comparable with those observed in the most oligotrophic Antarctic lakes (Vincent & Laybourn-Parry Reference Vincent and Laybourn-Parry2008). DOP concentrations were also significantly lower in young lakes with values similar to the extreme meltwater habitats of the Darwin Glacier (Victoria Land, Webster-Brown et al. Reference Webster-Brown, Gall, Gibson, Wood and Hawes2010), which probably reflects their lower productivity in comparison with old lakes.
High concentrations of NO3-N in several young lakes cannot be solely explained by atmospheric input (e.g. Aristarain et al. Reference Aristarain, Delmas and Briat1982). Overall, high nitrate concentrations in lakewater are not exceptional in Antarctica. Important sources of N for Antarctic lakes and ponds are bird rookeries and marine mammals (Toro et al. Reference Toro, Camacho, Rochera, Roco, Banon, Fernandez-Valiente, Marco, Justel, Avendano, Ariosa, Vincent and Quesada2007, Borghini et al. Reference Borghini, Colacevich, Caruso and Bargagli2008). However, these factors can be excluded on the Ulu Peninsula, since animal activity is very limited and virtually absent at higher altitudes, where lakes with high DIN concentration occur. We believe that neither nitrogen fixing cyanobacteria were the source of N, because microbial mats were poorly developed in the littoral zone of the lakes with the highest NO3-N concentrations. According to Priscu (Reference Priscu1995), the high levels of nutrients recorded in the deep waters of the Dry Valley lakes represent a legacy related to the origin of the lakes, but this could also hardly be the case of the James Ross Island lakes. Consistently high nitrate concentrations (> 100 μg N l-1) are characteristic for inland waters of the Ross Ice Shelf region (Vincent & Howard-Williams Reference Vincent and Howard-Williams1994, Webster-Brown et al. Reference Webster-Brown, Gall, Gibson, Wood and Hawes2010). The nitrate enrichment in this region was attributed to concentration mechanisms, such as freezing and evaporation, and there was a close positive correlation between NO3-N concentrations and conductivity. In addition, the chloride to nitrate ratio was within the range reported for Antarctic snow, indicating that nitrate was probably derived from snowmelt (Vincent & Howard-Williams Reference Vincent and Howard-Williams1994). In the case of extreme values (up to 13 g N l-1), nitrate-bearing salts were the source of N (Webster-Brown et al. Reference Webster-Brown, Gall, Gibson, Wood and Hawes2010). In contrast to Ross Ice Shelf waters, there was no correlation between NO3-N concentrations and conductivity in our dataset (Fig. 5), indicating a different N origin. Recently, Morford et al. (Reference Morford, Houlton and Dahlgren2011) suggested the possible role of bedrock as an alternative N source. Unfortunately, we have no direct information about the N content in rocks prevailing in the young moraines which form the catchments of young lakes on James Ross Island. Young lakes were also characterized by significantly higher concentrations of SRP indicating a P source in their catchments (Fig. 7). In the lakes of the Byers Peninsula (Livingston Island), SRP concentrations were low. Values comparable to the young lakes of the Ulu Peninsula were recorded only in a hypereutrophic lake, which was influenced by marine mammals (Toro et al. Reference Toro, Camacho, Rochera, Roco, Banon, Fernandez-Valiente, Marco, Justel, Avendano, Ariosa, Vincent and Quesada2007).
There is evidence that there are still unidentified but important N and P sources in the catchments of several young lakes on James Ross Island. Moreover, the differences in NO3-N and SRP concentrations between old and young lakes can also be influenced by the rate of primary production. However, we have only qualitative information about autotrophic biomass, which was significantly lower in young lakes. To analyse these differences in more detail, data on nutrient input to the lakes together with their photosynthetic rates would be necessary. Increasing NO3-N concentrations with decreasing lake productivity were already observed in several Antarctic regions (Healy et al. Reference Healy, Webster-Brown, Brown and Lane2006, Borghini et al. Reference Borghini, Colacevich, Caruso and Bargagli2008).
For many lakes on James Ross Island, the molar PC:PP and PN:PP ratios of the epilimnetic seston are lower than: 1) the C:P and N:P ratios of marine plankton which have been inferred to be an indication of the nutrient-sufficient status of plankton (106 and 16, respectively; Redfield Reference Redfield1958), and 2) the C:P and N:P ratios of plankton in temperate lakes with P limited growth (306 and 24, respectively; Hecky et al. Reference Hecky, Campbell and Hendzel1993), suggesting that the lakes could be N-limited. In lakes with high NO3-N and SRP concentrations (types 4–6), the PN:PP ratio remained relatively low, but nutrients were unlikely to be limiting. Physical factors, such as low light and temperature, are important constraints on production in many Antarctic lakes (Vincent & Laybourn-Parry Reference Vincent and Laybourn-Parry2008). However, NO3-N concentrations were usually depleted in shallow lakes with important benthic mats (types 1–3) (Table III). It was previously shown that nutrient limitation can also be significant in Antarctic lakes. Based on experimental enrichments, both N and P limitation were reported from the Dry Valley lakes (Priscu Reference Priscu1995). Recently, Barrett et al. (Reference Barrett, Virginia, Lyons, McKnight, Priscu, Doran, Fountain, Wall and Moorhead2007) demonstrated the great influence of landscape age on the C:N:P stoichiometry in Taylor Valley with lower N:P ratios in streams on younger surfaces. Thus, the relative excess of P in the James Ross Island lakes could reflect their generally younger age connected with harsher climatic conditions in comparison with other lake districts in the Antarctic Peninsula region (e.g. Byers Peninsula on Livingston Island, Toro et al. Reference Toro, Camacho, Rochera, Roco, Banon, Fernandez-Valiente, Marco, Justel, Avendano, Ariosa, Vincent and Quesada2007). Based on our data, however, it is not possible to determine exactly the character of limitation in lakes of the Ulu Peninsula.
Conclusions
Six lake types have been defined for the northern deglaciated part of the Ulu Peninsula, James Ross Island. These are: 1) Stable shallow lakes of higher-lying levelled surfaces, 2) shallow coastal lakes, 3) stable lakes in old moraines, 4) small unstable lakes in young moraines, 5) deep cirque lakes, and 6) kettle lakes. Lakes basically differ in their origin and history, which influences their morphometry, hydrological stability, and physical and chemical characteristics. The diversity of lakes is further related to the differences in bedrock composition. Therefore, the lakes on James Ross Island represent a very valuable set of lacustrine habitats in the transitional zone between maritime and continental Antarctica.
Acknowledgements
This work was supported by the projects KONTAKT ME 945, CzechPolar LM2010009, MSM0021620828, MSM0021620831, CGS335200/2012, and by the long-term research development project no. RVO 67985939. DN fieldwork was funded by the R & D project VaV SP II 1a9/23/07 of the Ministry of the Environment of the Czech Republic. The authors would also like to thank to the scientific infrastructure of the Czech Antarctic Station “J.G. Mendel” and its crew for their support. We gratefully acknowledge Dominic Hodgson, Elie Verleyen and an anonymous reviewer for their valuable comments on an earlier version of the manuscript.


