On November 5, 1297, England’s King Edward I acquiesced to the terms of Confirmatio Cartarum (the confirmation of Magna Carta and the Charter of the Forest). In doing so, he agreed on his own behalf as well as for all future generations of English monarchs to levy no new taxes without the approval of parliament. He did so in exchange for financial support for a war of choice—not necessity—that he wished to wage in Gascony. Though this bargain was honored only erratically in the early years, Edward’s forced capitulation proved instrumental in moving tax policy from the exclusive domain of an incumbent monarch and his or her small group of advisors to the arena of collective political choice. Other governments gradually followed suit, slowly recognizing that the political complexities of tax policy required constant attention in order to cope with tax fraud resulting in the loss of scarce revenue, or worse, of aggressive overtaxing that ran the risk of fomenting a level of political opposition sufficient to depose them. In what follows, we model the structure of tax policy across different income groups from the perspective of leaders maximizing their prospects for retaining office under different political institutions. We test the theoretical predictions using data on the progressivity of income tax across 139 nations between 1981 and 2005.
The literature on taxing and spending decisions is, of course, rich and vast. We know a great deal about how different types of government elect to spend their revenue, especially as between public goods, private goods and club goods (Acemoglu and Robinson Reference Acemoglu and Robinson2001; Lake and Baum Reference Lake and Baum2001; Bueno de Mesquita et al. Reference Bueno de Mesquita, Smith, Siverson and Morrow2003). We also know a good deal about how tax policy is used to address specific social concerns such as the advancement of national security through warfighting (Tilly Reference Tilly1992; Scheve and Stasavage Reference Scheve and Stasavage2012), the redistribution of income to attain greater equality (Iversen and Soskice Reference Iversen and Soskice2006; Bird and Zolt Reference Bird and Zolt2008; Farhi et al. Reference Farhi, Sleet, Werning and Yeltekin2012) or to secure political loyalty (Bueno de Mesquita et al. Reference Bueno de Mesquita, Smith, Siverson and Morrow2003). There are also extensive literatures, both normative and positive, on variations in the selection of tax structures within democracies and across their electoral systems (Mankiw Reference Mankiw1987; Buchanan Reference Buchanan1993; Holcombe Reference Holcombe1998; Carbonell-Nicolau Reference Carbonell-Nicolau2009; Roemer Reference Roemer2008; Acemoglu, Golosov and Tsyvinski Reference Acemoglu, Golosov and Tsyvinski2010; Roemer Reference Roemer2012).
Yet surprisingly, despite the close ties between tax-generated revenue and government policies, we know relatively little about the politics that shape states’ choices of income tax structures when we look across all regime types, whether they are democratic, autocratic, monarchic or anywhere in between. In what follows, we propose and test a theoretical model that is designed to account for variation in those choices regardless of government type. To the best of our knowledge there has not been an effort to offer a general theoretical and empirical account of the selection of national income tax structures that reaches beyond democracies.Footnote 1 We attempt to address this general concern by viewing income tax structures as elements of governance that significantly influence leadership and regime survival prospects. Although we leave for a later study the direct impact of income tax policy on leader survival, we describe below what income tax policy is expected to look like if it is selected by leaders interested in enhancing their political survival prospects. We then test the propositions derived from our model against cross-sectional time-series data on income tax policies.
Literature Review
There has been long extensive research into normative and positive theories of taxation, primarily in the democratic context (Musgrave Reference Musgrave1959; Berliant and Gouveia Reference Berliant and Gouveia1993). Starting at least with Mill (Reference Mill1848), economists have grappled with devising a normatively equitable tax structure. Following Mill, the emphasis has often been on schemes that promise to generate tax equity, a system of income taxation in which all tax payers experience an equivalent utility loss. As Mill put it, “Equality of taxation … means equality of sacrifice … apportioning the contribution of each person towards the expenses of government so that he shall feel neither more nor less inconvenience from his share of the payment than every other person experiences from his” (Mill Reference Mill1848, Book V, Chapter II, quoted in Young Reference Young1987). A drawback of Mill’s approach that was recognized relatively early was that it required interpersonal comparisons of utility. This flaw, however, was eventually overcome through the axiomatic approach to fair taxation suggested by Young (Young Reference Young1987; Young Reference Young1988).
Mirrlees (Reference Mirrlees1971) puts forth a rival theory of optimal taxation from the perspective of generating the most economically efficient structure. In a similar vein, Buchanan (Reference Buchanan1993) argues that economic efficiency through taxation can be achieved through constitutional means by ensuring that the law requires, in essence, equal treatment of all citizens. A similar sentiment is echoed in Holcombe (Reference Holcombe1998). More recent positive treatments of tax policy have tended to focus on how politics may distort equal treatment. Carbonell-Nicolau (Reference Carbonell-Nicolau2009), for instance, contends that, “Equilibrium tax schedules benefit the more numerous income groups and place the burden of taxation on income groups with fewer voters.” Roemer (Roemer Reference Roemer2008; Roemer Reference Roemer2012) goes still further in refining a positive approach to tax policy although still within an exclusively democratic, electoral framework. His 2012 study, in particular focuses on modeling income taxes so as to be incentive compatible for office-seeking politicians and their parties. Like several other models, he assumes democracies are comprised of two income groups and shows that democracies have a propensity to favor progressive taxation. However, the extent to which taxes are progressive depends upon the balance between rich and poor voters and the relative balance of negotiating strength between what he refers to as opportunists and guardians within a party. Extremes on these dimensions can result in equilibria that lead to regressive taxation. Roemer notes that the modeling problem becomes intractable if expanded beyond two income groups.
Other positivist approaches focus attention on state characteristics that the model we propose either addresses directly or implicitly. For instance, Besley and Persson (Reference Besley and Persson2011) assume fiscal capacity places a limit on the extent government can tax. They argue governments invest in capacity when public goods are highly valued and when current leaders anticipate they will not be excluded from future benefits. The model here identifies conditions that support the idea that fiscal capacity imposes limits on taxation by explicitly identifying an income level below which there is no expected income taxation. Aidt and Jensen (Reference Aidt and Jensen2009) suggest that the extent of enfranchisement predicts the introduction of income taxation. Aidt and Jensen’s argument offers an important insight that is certainly compatible with the framework we suggest in which expansion of the franchise directly shapes incentives through two institutions on which we focus as explained in the next section. Scheve and Stasavage (Reference Scheve and Stasavage2010) suggest that war is a prime cause of the need for investment by governments and argue, therefore, that war was fundamental to the introduction of comprehensive taxation in the modern state. Although the theory of political competition that forms the basis of the model developed here has been extensively applied to questions related to war choices, it has addressed the linkage between war effort, political institutions and tax policy only implicitly. While our model could be readily extended to address these significant proposed causes of income taxation; our purpose here is to investigate how existing variance in institutions shapes tax policy and not the interesting question of why tax policy originates in the first place. We leave that for future investigation.
In what follows, we propose a positivist approach to tax policy that builds on earlier formal work, especially Carbonell-Nicolau (Reference Carbonell-Nicolau2009), Roemer (Reference Roemer2012) and Acemoglu, Golosov and Tsyvinski (Reference Acemoglu, Golosov and Tsyvinski2010), but in which we consider any finite number of income groups rather than just two. Further, rather than focusing only on essentially majoritarian electoral systems, as most other approaches do, we seek to explain variations in income tax rates across all forms of political arrangements. Mindful of the intractability highlighted by Roemer in modeling the multi-dimensional policy choice of taxation rates across all groups, we develop a simplified version of the selectorate model of political competition in which we treat the political opposition in a non-strategic reduced form. Selectorate theory is a survival-orientated theory in which the number of supporters that a leader needs to retain power shapes policy choices.
Selectorate Theory
The essence of selectorate theory is that all polities (indeed, all organizations) can be described in a two-dimensional institutional space made up of the selectorate (denoted as S) and the winning coalition (W). The selectorate consists of all people with at least a nominal say in choosing the government’s leaders and, more importantly, meeting the criteria required to be a potential member of a winning coalition. The winning coalition is the subset of the selectorate whose support is needed to keep an incumbent in power. Formal developments of the theory (Bueno de Mesquita et al. Reference Bueno de Mesquita, Smith, Siverson and Morrow2003; Bueno de Mesquita and Smith Reference Bueno de Mesquita and Smith2009) show that as W increases survival-oriented leaders shift policy provision from private goods to public goods. Survival is also shown to be harder as W increases. We demonstrate that the degree of tax progressivity, as well as the heterogeneity in tax rates, is also part of a political survival-oriented strategy. In particular, we show that the greater the extent of democracy (i.e., large W), the greater the degree to which taxes are progressive, inducing broadly equal sacrifice. As governance types become more autocratic, relying on a few privileged supporters to keep leaders in power, leaders favor regressive taxes.
Scholars such as Przeworski et al. (Reference Przeworski, Alvarez, Cheibub and Limongi2000), Acemoglu and Robinson (Reference Acemoglu and Robinson2006), Boix (Reference Boix2003) and Ansell and Samuels (Reference Ansell and Samuels2010) argue that inequality and taxation influence democratization and institutional choice. However, they fail to reach a consensus as to how. While such factors clearly have a long-run impact on institutional design, our current analysis focuses on shorter run considerations of how leaders choose to tax and spend under existing institutions. Although several studies examine institutional change within selectorate theory (Smith Reference Smith2008; Bueno de Mesquita and Smith Reference Bueno de Mesquita and Smith2010), for current purposes we treat institutions as fixed. As we elaborate on later, the available data encompass 25 years during which time institutions as conceptualized here did not change much. Later we hope to expand the theory to further investigate any interdependence between shifts in tax policy and subsequent changes in governance institutions.
A Model of Taxation and Political Rewards
To model taxation tractably across political institutions, we must necessarily make tradeoffs and so it is useful to start by being explicit about the pro and cons of our approach. Our model offers two significant advances over earlier approaches. First, we examine taxation across the full range of political institutions rather than limit ourselves, as others have typically done, either to a single form of government—such as democracy—or to a simple governance dichotomy, such as democracy and non-democracy. By measuring institutions in terms of the number of supporters a leader needs to retain power, selectorate theory accounts for the great variation within non-democratic and democratic societies as well, of course, as accounting for the great variation across these broad categories. Indeed, within the selectorate framework, governance institutions are conceptually continuous and hence potentially infinitely variable in their subtle differences as reflected by the sizes of W and S. Second, rather than the common assumption within the income tax literature that there are two income groups—rich and poor—we classify the distribution of incomes across numerous income groups. As Ansell and Samuels (Reference Ansell and Samuels2010) emphasize, even within rich groups there is heterogeneity that creates divergent interests over taxation.
These innovations do not come without imposing restrictions on our model, which assumes away a number of issues that some alternative approaches elaborate on. For instance, we treat institutions as fixed, at least in terms of the tax choices of the immediate leader. We treat the distribution of incomes as given rather than derive it from equilibrium economic behavior given different endowments. Taxation introduces inefficiencies. People work less, evade taxation and shift to informal sectors as taxes rise. Rather than provide microfoundations (see Sandmo Reference Sandmo2005 for a review), we model the economic losses due to these factors as tax collection costs. We assume that extracting higher tax rates results in greater costs. We also assume that more complicated tax systems are more costly to operate. Although side-stepping certain issues in the model represents a step back from some aspects of the research frontier, it allows us to model tax policies that differ across many income groups, an innovation that we believe is worth the cost on other modeling dimensions.
Each polity’s income distribution can be described as a set of K discrete income levels (y 1, y 2, …, y K ). These income levels represent the returns associated with different economic activities. Let ρ i represent the proportion of the population that engages in the activity that earns y i . We examine the leader’s choice over a vector of taxes (t 1, t 2, …, t K ), where t i is the tax rate associated with the activity that generates y i . Our objective is to see how institutions affect the choice of tax rates across these different income levels.
People are assumed to care about their income and about the quantity of private and public goods they receive from their government. We let x be the level of public goods that the government provides and g i the level of private transfers that person i receives. Private goods go only to those individuals whose support is essential to keep an incumbent in office; that is, to members of W. Therefore:
 $$g_{i} =\left\{ {\matrix{ g & {{\rm if}} & {i\in W} \cr 0 & {{\rm if}} & {i\ \notin \ W} \cr } } \right..$$
Each individual’s welfare is equal to v(x)+u(y i (1−t i )+g i ), where y i (1−t i )+g i is the private level of income of a type i person and v and u increasing smooth concave utility functions. Notice that we treat private gains given to coalition members as untaxed and assume that all members of the coalition receive the same level of private goods.
For much of what follows, we utilize the parametric specification suggested by Young (Reference Young1988),
 $$u(z)={\minus}{1 \over z}$$
and
$$u(z)={\minus}{1 \over z}$$
and
 $$v(x)={\minus}{1 \over {x{\plus}x_{0} }}$$
, where z represents post-tax income (y
i
(1−t
i
)) and private goods (g
i
) and x
0 some baseline societal level of public goods.
$$v(x)={\minus}{1 \over {x{\plus}x_{0} }}$$
, where z represents post-tax income (y
i
(1−t
i
)) and private goods (g
i
) and x
0 some baseline societal level of public goods.
Revenues and Expenditures
People dislike taxes and either evade taxation (Alingham and Sandmo Reference Allingham and Sandmo1972) or enter the informal economy (Hibbs and Piculescu Reference Hibbs and Piculescu2010) to avoid them. Rather than explicitly model economic choices under different tax regimes, we utilize the stylized fact that people make greater efforts to avoid taxation as tax rates increase. As taxes rise, it becomes more difficult to collect them. We assume that there are three costs associated with taxing income. First, there is a per capita cost γ. Second, we assume a collection cost that increases in the rate of taxation. That is to say, it becomes harder to extract taxes at high rates than at low rates. We use a simple quadratic cost function. Hence, taxing income group i at rate t
i
costs
 $$y_{i} \alpha t_{i}^{2} {\plus}1_{{t_{i}\, \gt \,0}} \gamma $$
, where α represents the cost of collecting taxes owed as people hide their income from the tax collector or undertake alternative, “black market” activities to avoid taxation as tax rates increase.
$$y_{i} \alpha t_{i}^{2} {\plus}1_{{t_{i}\, \gt \,0}} \gamma $$
, where α represents the cost of collecting taxes owed as people hide their income from the tax collector or undertake alternative, “black market” activities to avoid taxation as tax rates increase.
 $$1_{{t_{i}\, \gt \,0}} $$
is an indicator function that takes the value 1 if group i pays tax and 0 otherwise.
$$1_{{t_{i}\, \gt \,0}} $$
is an indicator function that takes the value 1 if group i pays tax and 0 otherwise.
Finally, we assume a complexity cost T. A simple flat tax system is administratively easier to organize and enforce than a more complicated tax structure in which different tax rates apply to different income groups. Although tax systems can differ in complexity, we distinguish only between a simple flat rate system, which costs T f , and a complex system where rates can differ across income groups but costs more to implement T c ≥T f .
With these assumptions, we can see that the revenue collected from income group i, which represents ρ
i
of the population and has income level y
i
, is
 $$\rho _{i} (y_{i} (t_{i} {\minus}\alpha t_{i}^{2} ){\minus}1_{{t_{i}\, \gt \,0}} \gamma )$$
and government revenue net of all costs is
$$\rho _{i} (y_{i} (t_{i} {\minus}\alpha t_{i}^{2} ){\minus}1_{{t_{i}\, \gt \,0}} \gamma )$$
and government revenue net of all costs is
 $$\mathop{\sum}\limits_i \rho _{i} (y_{i} (t_{i} {\minus}\alpha t_{i}^{2} ){\minus}1_{{t_{i} \,\gt\, 0 }}\gamma ){\minus}T.$$
Governments provide public goods and redistribute private goods to supporters. Public goods cost p to produce. The cost of private goods depends upon the proportion of people receiving them. Let w represent the size of the winning coalition in terms of a proportion of the population. This is the proportion of people receiving private goods. The total cost of private and public goods production is px+wg. Equating the cost of these goods with revenues provides a budget constraint:
 $$\mathop{\sum}\limits_i \rho _{i} (y_{i} (t_{i} {\minus}\alpha t_{i}^{2} ){\minus}1_{{t_{i}\, \gt\, 0}} _{\gamma } ){\minus}px{\minus}wg{\minus}T\geq 0.$$
We use a reduced form model of selectorate politics. Coalition members receive g private and x public goods. Citizens outside of the winning coalition also benefit from public goods. However, as selectorate theory focuses on a leader’s goal of buying loyalty from supporters, any societal gains that arise from the leader’s policies are an unintended externality. As developed above, the utility of these goods provides rewards worth v(x)+u(y i (1−t i )+g i ) if the leader retains office. Should a member of a leader’s coalition defect, the leader is replaced and citizens receive an expected payoff of θ i +ε, where θ i represents a continuation payoff for citizens in group i and ε a random variable drawn from the distribution F that has full support on the real line and reflects the expected idiosyncratic value of a challenger.
We assume θ i is increasing in income. Although the rich might be taxed at a much higher rate than the poor, we assume that everyone would prefer (at least in expectation) to be rich than poor. To construct working examples, we assume that θ i =v(0)+u(y i ); that is to say, a leader’s deposition results in a caretaker government that collects no taxes and provides no additional rewards.
Members of the winning coalition compare their benefits from the leader’s policies with the expected benefits if the incumbent were deposed and replaced by a challenger. This comparison generates a selectorate deposition constraint. Supporters remain loyal if and only if
 $$v(x){\plus}u(y_{i} (1{\minus}t_{i} ){\plus}g_{i} )\geq \theta _{i} {\plus}{\varepsilon}.$$
The incumbent is deposed if any member of her coalition defects. Given that ε is distributed F(c)=Pr(ε<c), the probability that the incumbent survives selectorate deposition is
 $$Pr({\varepsilon}\leq v(x){\plus}u(y_{i} (1{\minus}t_{i} ){\plus}g_{i} ){\minus}\theta _{i} )=F(v(x){\plus}u(y_{i} (1{\minus}t_{i} ){\plus}g_{i} ){\minus}\theta _{i} ).$$
Taxation, Revenues and Political Survival
To survive in office, the incumbent needs to avoid deposition. Here, we model only deposition from within the extant political system in the context of the reduced form selectorate model.Footnote 2 Formally, the leader’s decision problem is to set a tax and policy structure (t 1, t 2, …, t K , x, g) that maximizes the probability of leader survival (2) subject to the budget constraint (1). In addition, if the leader employs a flat tax structure, then t i =t j for all groups i, j.Footnote 3 A member of the winning coalition from income group i remains loyal provided that
 $$v(x){\plus}u(y_{i} (1{\minus}t_{i} ){\plus}g_{i} ){\minus}\theta _{i} \geq {\varepsilon}.$$
The leader is deposed if any of her supporters defect. She maximizes her survival prospect by maximizing v(x)+u(y i (1−t i )+g i )−θ i for the least loyal member of her coalition; that is to say, her programming problem is
 $$\mathop {{\rm max}}\limits_{(t_{1} ,t_{2} ,\:\,\ldots\,\:,t_{K} ,x,g)} \mathop {{\rm min}}\limits_{i\in W} \{ v(x){\plus}u(y_{i} (1{\minus}t_{i} ){\plus}g_{i} ){\minus}\theta _{i} \} ,$$
subject to the budget constraint (1).
Before examining the overall comprehensive choice of tax structures, we address a number of baseline cases that are useful in explaining tax choices.
Simple Baselines
Revenue maximization
Proposition 1:
If y
i
≥4αγ, then the revenue maximizing tax rate is
 $$t_{i} ={1 \over {2\alpha }}=\overline{t} $$
and it generates
$$t_{i} ={1 \over {2\alpha }}=\overline{t} $$
and it generates
 $${{y_{i} } \over {4\alpha }}{\minus}\gamma $$
revenue per member of group i. If y
i
<4αγ, then no tax rate generates net revenues.
$${{y_{i} } \over {4\alpha }}{\minus}\gamma $$
revenue per member of group i. If y
i
<4αγ, then no tax rate generates net revenues.
Proof:
The leader’s programming problem is
 $${max}_{t_{i} \in \left[ {0,1} \right]} \,t_{i} y_{i} {\minus}\gamma 1_{{t_{i} \gt 0}} {\minus}\alpha t_{i}^{2} y_{i} $$
. This program is standard and well defined. Solving the first-order condition yields y
i
−2αt
i
y
i
=0, which is solved by t
i
=1/2α. The second-order condition −2αy
i
<0 ensures a local maximum. The revenue at the local maximum is
$${max}_{t_{i} \in \left[ {0,1} \right]} \,t_{i} y_{i} {\minus}\gamma 1_{{t_{i} \gt 0}} {\minus}\alpha t_{i}^{2} y_{i} $$
. This program is standard and well defined. Solving the first-order condition yields y
i
−2αt
i
y
i
=0, which is solved by t
i
=1/2α. The second-order condition −2αy
i
<0 ensures a local maximum. The revenue at the local maximum is
 $${{y_{i} } \over {4\alpha }}{\minus}\gamma $$
. If
$${{y_{i} } \over {4\alpha }}{\minus}\gamma $$
. If
 $${{y_{i} } \over {4\alpha }}{\minus}\gamma \,\lt\, 0$$
then zero tax avoids the per capita collection cost.
$${{y_{i} } \over {4\alpha }}{\minus}\gamma \,\lt\, 0$$
then zero tax avoids the per capita collection cost.
Except for the very poor, Proposition 1 shows that the revenue maximizing tax for all groups is
 $$t_{i} ={1 \over {2\alpha }}=\overline{t} $$
. If the leader taxes above this level, then, because people hide more income and switch out of the formal economy to avoid taxation, revenue actually decreases. It is not worthwhile for leaders to tax groups that are so poor that the expense of sending someone to their house to collect taxes costs more than the revenue generated. For what follows, we assume that sufficiently large proportions of the population are above this poverty threshold that tax schedules generate positive net revenues.
$$t_{i} ={1 \over {2\alpha }}=\overline{t} $$
. If the leader taxes above this level, then, because people hide more income and switch out of the formal economy to avoid taxation, revenue actually decreases. It is not worthwhile for leaders to tax groups that are so poor that the expense of sending someone to their house to collect taxes costs more than the revenue generated. For what follows, we assume that sufficiently large proportions of the population are above this poverty threshold that tax schedules generate positive net revenues.
At a societal level, if leaders use a simple flat tax, t
f
, then total revenue would be
 $$\mathop{\sum}\nolimits_i \rho _{i} y_{i} (t_{f} {\minus}\alpha t_{f}^{2} ){\minus}\gamma {\minus}T_{f} $$
. It follows directly from Proposition 1 (and the assumption that the society is not too poor) that the revenue maximizing flat tax is
$$\mathop{\sum}\nolimits_i \rho _{i} y_{i} (t_{f} {\minus}\alpha t_{f}^{2} ){\minus}\gamma {\minus}T_{f} $$
. It follows directly from Proposition 1 (and the assumption that the society is not too poor) that the revenue maximizing flat tax is
 $$t_{f} ={1 \over {2\alpha }}=\overline{t} $$
. If, following Besley and Persson (Reference Besley and Persson2011), we assume fiscal capacity constrains the maximum level of taxation that is less than
$$t_{f} ={1 \over {2\alpha }}=\overline{t} $$
. If, following Besley and Persson (Reference Besley and Persson2011), we assume fiscal capacity constrains the maximum level of taxation that is less than
 $$\overline{t} $$
, then this would be the binding constraint instead.
$$\overline{t} $$
, then this would be the binding constraint instead.
Political equality
As we have seen above, Mill (Reference Mill1848), Young (Young Reference Young1988; Young Reference Young1990) and many others contend that a normatively desirable tax system calls on all citizens to make an equal sacrifice. That is to say, the tax burden that each person pays reduces their utility by the same amount. Our analysis takes a more positive focus. Our model indicates that leaders look after the welfare of each of their supporters equally not because of a normative interest in equity but because of a positive interest in preventing the weakest link in their winning coalition from defecting to a challenger, causing them to be deposed.
Suppose at least two income groups are represented in the winning coalition. Then some members of the coalition have income y i and continuation value θ i while others have income y j and a continuation value of θ j .
Definition: Political equality between coalition members from groups i and j is defined as
 $$v(x){\plus}u((1{\minus}t_{i} )y_{i} {\plus}g){\minus}\theta _{i} =v(x){\plus}u((1{\minus}t_{j} )y_{j} {\plus}g){\minus}\theta _{j} .$$
The following proposition shows that from the perspective of selectorate politics, if a leader has a complex tax system that allows her to set different tax rates on different income groups, then the leader sets tax policy so that coalition members from each group are treated as politically equal. We say a tax rate for group i is constrained if
 $$t_{i} =\overline{t} $$
.
$$t_{i} =\overline{t} $$
.
Proposition 2:
Suppose the winning coalition contains supporters from multiple income groups and the leader has a complex tax system. Either
 $$t_{j} =\overline{t} $$
for some group j in the winning coalition or there is political equality across all income groups in the winning coalition.
$$t_{j} =\overline{t} $$
for some group j in the winning coalition or there is political equality across all income groups in the winning coalition.
This result is central to our understanding of tax practices across institutions so the proof below is somewhat verbose to elaborate on the intuitions.
Proof:
Suppose the coalition contains the members of groups
i
and
j
and suppose the leader has policy (
t
1, t
2, …, t
K
, x, g
) such that the tax rates of these groups are unconstrained by the revenue maximization constraint (
i.e.,
 $$t_{j} \,\lt \,\overline{t} $$
for all groups in
W
). Now suppose there is political inequality between
i
and
j: v(x)+
u(y
i
(1−t
i
)+g
i
)−θ
i
=I<v
(
x
)+u
(
y
j
(1−t
j
)+g
j
)−θ
j
=J. In selectorate competition, the leader is deposed if
ε>I. However, supporters in group j remain loyal even as those in group i defect: I<ε<J. The incumbent can survive in office under a greater range of circumstances by treating group j members more harshly, raising the tax rate t
j
and using the increased revenue to provide greater benefits for group i. Doing so reduces the loyalty of group j supporters, but in survival terms this is irrelevant because any challenge that would lead to defection by group j would already have resulted in deposition by the defection of group i members as I<J. Thus, the incumbent should continue to reward i at the expense of j until these income groups are politically equal (or until t
j
reaches the income maximization tax rate,
$$t_{j} \,\lt \,\overline{t} $$
for all groups in
W
). Now suppose there is political inequality between
i
and
j: v(x)+
u(y
i
(1−t
i
)+g
i
)−θ
i
=I<v
(
x
)+u
(
y
j
(1−t
j
)+g
j
)−θ
j
=J. In selectorate competition, the leader is deposed if
ε>I. However, supporters in group j remain loyal even as those in group i defect: I<ε<J. The incumbent can survive in office under a greater range of circumstances by treating group j members more harshly, raising the tax rate t
j
and using the increased revenue to provide greater benefits for group i. Doing so reduces the loyalty of group j supporters, but in survival terms this is irrelevant because any challenge that would lead to defection by group j would already have resulted in deposition by the defection of group i members as I<J. Thus, the incumbent should continue to reward i at the expense of j until these income groups are politically equal (or until t
j
reaches the income maximization tax rate,
 $$\overline{t} $$
).
$$\overline{t} $$
).
Formally, suppose the tax rates of coalition members are unconstrained and
I<J. Let the revenue from these tax policies be
 $$R=\mathop{\sum}\nolimits_k \rho _{i} (t_{i} y_{i} {\minus}\alpha t_{i}^{2} y_{i} {\minus}1_{{t_{i} \,\gt\, 0}} \gamma ){\minus}T_{c} \,\gt \,0$$
. Under such a system deposition occurs if
ε>I. As
$$R=\mathop{\sum}\nolimits_k \rho _{i} (t_{i} y_{i} {\minus}\alpha t_{i}^{2} y_{i} {\minus}1_{{t_{i} \,\gt\, 0}} \gamma ){\minus}T_{c} \,\gt \,0$$
. Under such a system deposition occurs if
ε>I. As
 $$t_{j} \,\lt\, \overline{t} $$
, there exists some
μ>0 such that
$$t_{j} \,\lt\, \overline{t} $$
, there exists some
μ>0 such that
 $$t_{j}^{{\prime }} =t_{j} {\plus}\mu $$
that increases revenue to
R′ such that
R′−R=ρ
j
y
j
((t
j
+μ)−α(t
j
+μ)2−(t
j
)+α(t
j
)2)=ρ
j
y
j
(μ−μα(2t
j
+μ))>0 and
v(x)+u(y
j
(1−t
j
−μ)+g
j
)−θ
j
=J′>I. With the increased revenue, the leader could buy
$$t_{j}^{{\prime }} =t_{j} {\plus}\mu $$
that increases revenue to
R′ such that
R′−R=ρ
j
y
j
((t
j
+μ)−α(t
j
+μ)2−(t
j
)+α(t
j
)2)=ρ
j
y
j
(μ−μα(2t
j
+μ))>0 and
v(x)+u(y
j
(1−t
j
−μ)+g
j
)−θ
j
=J′>I. With the increased revenue, the leader could buy
 $${{R\prime {\minus}R} \over p}$$
additional public goods.
$${{R\prime {\minus}R} \over p}$$
additional public goods.
Under the initial policies, the leader survives if and only if
ε<min{I, J}. Under the alternative policies, the leader survives if and only if
ε<min{I′, J′}, where
 $$I\prime =I{\plus}v(x{\plus}{{R\prime {\minus}R} \over p}){\minus}v(x)$$
. The leader survives with greater probability under the latter policies than the former, which contradicts the initial policies being optimal. Hence, either the tax rate of a coalition group is constrained, or there is political equality.
$$I\prime =I{\plus}v(x{\plus}{{R\prime {\minus}R} \over p}){\minus}v(x)$$
. The leader survives with greater probability under the latter policies than the former, which contradicts the initial policies being optimal. Hence, either the tax rate of a coalition group is constrained, or there is political equality.
When leaders adopt complex tax systems, taxing different income groups at different rates, they impose political equality across the income groups from which their supporters are drawn and tax groups outside the winning coalition to the revenue maximization level. Having introduced the ideas of revenue maximization and political equality, we explore the structure of taxation under different institutional settings.
Taxation in Small Coalition Systems
Building on the model’s logic, we now explore how winning coalition size, w, affects a leader’s choice of tax system. We start by analyzing the choice of tax structure when the coalition is sufficiently small that all its members are drawn from a single income group. For convenience, we index the group from which the coalition members are drawn by W. Leaders can implement either a flat tax or a complex tax structure. Having analyzed the policies chosen under each, we assess the relative merits of each system for a small coalition leader.
Flat tax structure
Under the flat tax system all groups pay tax at a common rate t, the leader provides x public goods and g private goods to her coalition members. As derived above, she survives provided
 $$v(x){\plus}u((1{\minus}t)y_{W} {\plus}g){\minus}\theta _{w} \geq {\varepsilon}.$$
Hence, to maximize her probability of survival the incumbent maximizes v(x)+u((1−t)y W +g) subject to the budget constraint (1). The leader’s choice constitutes a well-defined constrained optimization problem and the conditions stated follow from the first-order conditions so the details are relegated to the appendix.
Proposition 3: Under a small coalition, flat tax system (t i =t for all i), the budget constraint (1) binds, the private and public good rewards satisfy
 $${{v\prime (x)} \over p}={{u\prime ((1{\minus}t)y_{W} {\plus}g)} \over w}$$
and t satisfies
 $$\mathop{\sum}\limits_i \rho _{i} (y_{i} (1{\minus}2\alpha t))=wy_{W} ,$$
where y W is the income level of members of the winning coalition.
Consistent with prior selectorate theory, the ratio of private to public goods depends upon coalition size. When the coalition is small, leaders provide few public goods relative to private goods, Equation 4. As coalition size increases, the ratio shifts toward a mix of policies that is richer in public goods. An increase in coalition size also reduces tax rates.
The model also offers new insights into how who supports a leader affects spending decisions. As the income of supporters increases—that is to say, the winning coalition is drawn from a richer segment of society—leaders shift away from private benefits. The intuition is that relatively rich supporters already have an abundance of private goods and so favor a public goods focus. In contrast, relatively poor supporters like populist policies that transfer resources to them. For supporters in low-income groups, after all, private goods are relatively scarce.
The income of supporters also affects a leader’s preferred tax rate, although the effect is contingent on the precise coalition size. Provided a significant proportion of people within an income group are members of the coalition, w>ρ W (1−2αt) to be precise, then an increase in the income of supporters leads to a reduction in tax rates. The wealthy do not like high taxes when there are a large portion of the set of people paying them. Under a flat tax regime, leaders face a tradeoff. As they increase the tax rate, they generate more revenue with which to reward their supporters. However, the tax is also paid by their own supporters which diminishes the welfare of the incumbent’s backers. One way to mitigate the tradeoff between increasing revenue from society and having too much of the tax fall on supporters is to differentially tax different income groups by using a complex tax system.
Complex tax structure
Instead of a single tax rate, the leader chooses a separate tax rate for each group. Formally, her choice problem is to select taxing and spending policies (t 1, t 2, …, x, g) that maximize v(x)+u((1−t W )y W +g) subject to the budget constraint (1).
Proposition 4: If the coalition is drawn from a single income group and the leader has a complex tax system, then the leader taxes and spends on those in and out of the coalition as follows:
 $$i\in W,\ { then}\ t_{W} =\left\{ {\matrix{ {{{\rho _{W} {\minus}w} \over {2\alpha \rho _{W} }}\,\gt\, 0} & {{ if}} & {y_{W} ({{\rho _{W} {\minus}w} \over {2\alpha \rho _{W} }}{\minus}\alpha ({{\rho _{W} {\minus}w} \over {2\alpha \rho _{W} }})^{2} ){\minus}\gamma \,\gt \,0} \cr 0 & {{ otherwise}} & {} \cr } } \right.,$$
 $$\hskip -120pt i\ \notin \ W,\ { then}\ t_{i} =\left\{ {\matrix{ 0 & {{ if}} & {y_{i} \,\lt \,4\alpha \gamma } \cr {\overline{t} } & {{ otherwise}} & {} \cr } } \right..$$
Further, the budget constraint (1) binds and the private and public goods rewards satisfy
 $${{v{\prime} (x)} \over p}={{u{\prime} ((1{\minus}t)y_{W} {\plus}g)} \over w}.$$
The proof follows by standard constrained optimization procedures. Leaders survive by rewarding their supporters. To do so they tax other groups heavily, to the point of revenue maximization. The leader taxes the group containing the winning coalition at a lower rate,Footnote 4 possibly not at all, and provides the mix of private and public rewards that best compensates her supporters given their income. As seen in the flat tax case, the wealth of the group in the coalition effects this tradeoff. If the winning coalition is drawn from a wealthy group, then, to maximize her survival prospects, a leader provides a mix of rewards that is relatively more abundant in public goods than if the coalition were drawn from a poorer group. When the coalition is drawn from a poor group, leader rely more heavily on private goods transfers to coalition members.
Tradeoffs between flat and complex tax structures
Leaders in small coalitions face a tradeoff between flat and complex tax structures. The advantage of a complex tax structure is that it enables leaders to extract more revenue from non-coalition groups without the heavier tax burden falling on their supporters. Such a system allows each group outside the coalition to be taxed up to the maximum, it will tolerate in terms of revenue generation, or possibly other constraints. The downside is that such a tax system requires detailed differentiation between groups and so is more expensive to implement. Leaders are likely to prefer a flat tax system rather than a complex one when the winning coalition is relatively small.
To examine the tradeoffs between the two systems, we generate stylized comparisons of tax and spending by looking at revenue maximizing tax policies under each system. Obviously leaders can do slightly better than these policies under each tax system, but the stark comparison of the limiting cases makes the tradeoff clear. If Y=∑
i
ρ
i
y
i
represents societal income and the leader employs a revenue maximizing flat tax then she would generate
 $$R_{f} =Y{1 \over {4\alpha }}{\minus}\gamma {\minus}T_{f} $$
revenue. If she applies the same revenue maximizing tax to all groups outside the winning coalition and leaves the winning coalition group untaxed, then her revenue would be
$$R_{f} =Y{1 \over {4\alpha }}{\minus}\gamma {\minus}T_{f} $$
revenue. If she applies the same revenue maximizing tax to all groups outside the winning coalition and leaves the winning coalition group untaxed, then her revenue would be
 $$R_{c} =\mathop{\sum}\nolimits_{i\,\ne\,W} \,\rho _{i} \left( {y_{i} \left( {{1 \over {4\alpha }}} \right){\minus}\gamma } \right){\minus}T_{c} =Y{1 \over {4\alpha }}{\minus}\gamma {\minus}T_{c} {\minus}\rho _{W} \left( {y_{W} {1 \over {4\alpha }}{\minus}\gamma } \right)$$
. Again to make the comparisons stark, suppose the leader used all revenues for private goods. In the first case, she could provide the coalition with
$$R_{c} =\mathop{\sum}\nolimits_{i\,\ne\,W} \,\rho _{i} \left( {y_{i} \left( {{1 \over {4\alpha }}} \right){\minus}\gamma } \right){\minus}T_{c} =Y{1 \over {4\alpha }}{\minus}\gamma {\minus}T_{c} {\minus}\rho _{W} \left( {y_{W} {1 \over {4\alpha }}{\minus}\gamma } \right)$$
. Again to make the comparisons stark, suppose the leader used all revenues for private goods. In the first case, she could provide the coalition with
 $$v(0){\plus}u\left( {(1{\minus}\overline{t} )y_{W} {\plus}{{R_{f} } \over w}} \right)$$
utility. In contrast, under a complex tax system rewards would equal
$$v(0){\plus}u\left( {(1{\minus}\overline{t} )y_{W} {\plus}{{R_{f} } \over w}} \right)$$
utility. In contrast, under a complex tax system rewards would equal
 $$v(0){\plus}u\left( {y_{W} {\plus}{{R_{c} } \over w}} \right)$$
. To illustrate which tax systems enhance a leader’s ability to reward her coalition, suppose α=1, γ=0 and T
f
=T
c
=0. The comparison of the private rewards; that is, income after tax and private goods transfers, for coalition members is:
$$v(0){\plus}u\left( {y_{W} {\plus}{{R_{c} } \over w}} \right)$$
. To illustrate which tax systems enhance a leader’s ability to reward her coalition, suppose α=1, γ=0 and T
f
=T
c
=0. The comparison of the private rewards; that is, income after tax and private goods transfers, for coalition members is:
 $${{y_{W} } \over 2}{\plus}{Y \over {4w}}\ {\rm versus}\ \,y_{W} {\plus}{Y \over {4w}}{\minus}{{\rho _{W} y_{W} } \over {4w}}.$$
As coalition size grows the complex tax system becomes more attractive to the incumbent.Footnote 5
We now turn to tax policy in systems that require larger coalitions and so require leaders to draw supporters from multiple income groups.
Taxation in Large Coalition Systems
As coalition size grows, leaders need to woo supporters from multiple income groups. Unfortunately for leaders, this increases the difficulty of retaining loyalty. Large coalition size means leaders have relatively few resources per person to spend on private rewards. Several consequences immediately follow: first, leader survival is harder in large coalitions systems than in small coalition systems; second, leaders in large coalition systems are more reliant on public goods to reward supporters than are small coalition leaders. These effects are well described in earlier selectorate models.
Heterogeneous income creates another difficulty for leader survival. The policies that best reward supporters from one income group differ from the policies that best reward supporters from other income groups. Under a flat tax this means that one group of winning coalition members is more likely to defect than another. For any given set of policies, the quality of a challenger (ε) required to elicit defection from supporters from one group is not as great as the quality required to attract a defector from other supporter groups. In terms of survival under a flat tax, the leader can do no better than to pick the tax and spend policies that generate the greatest rewards for this least loyal group. Hence, the analysis of a flat tax in a large coalition system differs little from that in a small coalition setting. Leaders can enhance their survival prospects by transferring resources from more loyal supporters and giving them to other groups in the winning coalition that are more likely to defect, as shown in Proposition 2.
Unless a group’s tax rate is up against a constraint, such as the revenue maximization level, leaders want to increase the taxes on their more loyal supporters to generate additional rewards for those supporters most likely to defect. Under a complex tax system political survival in large coalition systems implies political equality. Political equality, in turn, implies progressive taxation when the coalition is large, as we next examine.
Political equality and progressivity of taxation
Political equality for groups in the coalition implies
 $$v(x){\plus}u((1{\minus}t_{i} )y_{i} {\plus}g){\minus}\theta _{i} $$
is constant for all groups in the coalition.
Proposition 5:
For politically equal groups,
 $${{dt_{i} } \over {dy_{i} }}={{(1{\minus}t_{i} )u\prime ((1{\minus}t_{i} )y_{i} {\plus}g){\minus}\theta _{i}\prime } \over {y_{i} u\prime ((1{\minus}t_{i} )y_{i} {\plus}g)}},$$
where
$${{dt_{i} } \over {dy_{i} }}={{(1{\minus}t_{i} )u\prime ((1{\minus}t_{i} )y_{i} {\plus}g){\minus}\theta _{i}\prime } \over {y_{i} u\prime ((1{\minus}t_{i} )y_{i} {\plus}g)}},$$
where
 $$\theta _{i}\prime $$
is the derivative of the continuation value with respect to income.
$$\theta _{i}\prime $$
is the derivative of the continuation value with respect to income.
Proof: Follows directly from differentiation of v(x)+u((1−t i )y i +g)−θ i .
Using the specific form for the continuation values, Proposition 5 implies
 $${{dt_{i} } \over {dy_{i} }}={{y_{i}^{2} (1{\minus}t_{i} ){\minus}2gy_{i} (1{\minus}t_{i} ){\minus}g^{2} } \over {y_{i}^{3} }}$$
. Provided that there are relatively few private goods, in particular,
$${{dt_{i} } \over {dy_{i} }}={{y_{i}^{2} (1{\minus}t_{i} ){\minus}2gy_{i} (1{\minus}t_{i} ){\minus}g^{2} } \over {y_{i}^{3} }}$$
. Provided that there are relatively few private goods, in particular,
 $$g\,\lt \,y_{i} (\sqrt {1{\minus}t_{i} } {\minus}\,(1{\minus}t_{i} ))$$
, leaders choose a progressive tax structure,
$$g\,\lt \,y_{i} (\sqrt {1{\minus}t_{i} } {\minus}\,(1{\minus}t_{i} ))$$
, leaders choose a progressive tax structure,
 $${{dt_{i} } \over {dy_{i} }}\gt 0$$
, within the coalition. In large coalition systems, private goods are relatively unimportant and, as a result, tax rates across groups within the coalition become relatively more progressive. Figure 1 demonstrates this pictorially by comparing the ratio of incomes y
j
/y
i
and the ratio of tax rates t
j
/t
i
for two groups in the coalition. Obviously, when group j’s income is similar to group i’s, the leader applies similar tax rates to both groups. Yet, as group j’s income rises relative to group i’s then their respective tax rates diverge. The extent to which they diverge depends upon the relative prevalence of private goods. Figure 1 shows the ratio of taxes at four different levels of private goods. The upper line shows a case where there are relatively few private goods, a situation that arises when w is large. As seen in the figure, tax rates are highly progressive. As private goods become more abundant, as occurs in small w systems or when the government is flush with revenue as might be the case in the presence of abundant natural resources, taxes become less progressive. Indeed, the lower two lines show that in low-income conditions small coalition systems are regressive, at least over some income ratio ranges. As income rises, private goods transfers become relatively less important and so tax rates become more progressive.
$${{dt_{i} } \over {dy_{i} }}\gt 0$$
, within the coalition. In large coalition systems, private goods are relatively unimportant and, as a result, tax rates across groups within the coalition become relatively more progressive. Figure 1 demonstrates this pictorially by comparing the ratio of incomes y
j
/y
i
and the ratio of tax rates t
j
/t
i
for two groups in the coalition. Obviously, when group j’s income is similar to group i’s, the leader applies similar tax rates to both groups. Yet, as group j’s income rises relative to group i’s then their respective tax rates diverge. The extent to which they diverge depends upon the relative prevalence of private goods. Figure 1 shows the ratio of taxes at four different levels of private goods. The upper line shows a case where there are relatively few private goods, a situation that arises when w is large. As seen in the figure, tax rates are highly progressive. As private goods become more abundant, as occurs in small w systems or when the government is flush with revenue as might be the case in the presence of abundant natural resources, taxes become less progressive. Indeed, the lower two lines show that in low-income conditions small coalition systems are regressive, at least over some income ratio ranges. As income rises, private goods transfers become relatively less important and so tax rates become more progressive.
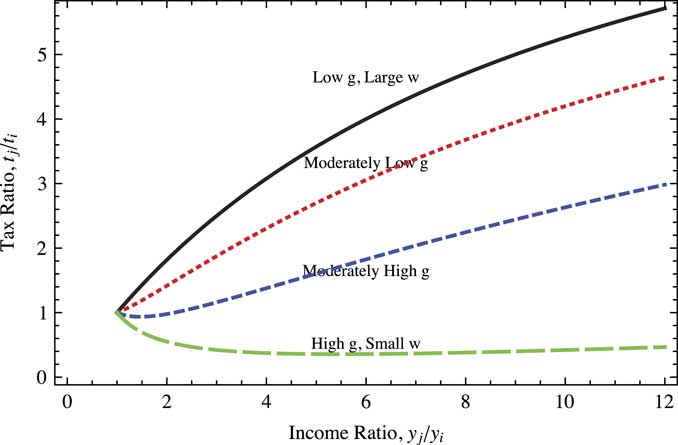
Fig. 1 Tax progressivity and income ratios at different private goods levels
Central Implications
As the winning coalition becomes large the tax rates across the income groups from which supporters are drawn normally become more progressive. This prediction is both an important result and a result reported by other models (e.g., Iversen and Soskice Reference Iversen and Soskice2006; Acemoglu, Golosov and Tsyvinski Reference Acemoglu, Golosov and Tsyvinski2010; Roemer Reference Roemer2012). The model we propose allows us to derive additional implications that we believe are important in policy terms and novel analytically. These implications, as we discuss, relate to flat taxes, progressivity, tax rate volatility and redistribution across institutional settings.
When winning coalition size is very small, leaders can draw all the supporters they need from a single income group. Political equality considerations play no role in a leader’s policy choices. In such a setting, a simple flat tax system allows for an administratively cheap means to generate revenue with which to reward supporters. Hence, simple flat taxes are likely to be prevalent in states with small winning coalitions and those that lack fiscal capacity (Besley and Persson Reference Besley and Persson2011). As coalition size increases, even if the coalition remains drawn from a single income group, stratifying tax rates becomes more attractive. Such decisions are not based upon normative grounds, but rather on the ability to optimally reward supporters to enhance leader survival. A complex tax system, while more costly to organize, allows coalition members to be treated preferentially. As coalition size becomes sufficiently large, leaders require supporters from multiple income groups. Treating these supporters in a politically equal manner enhances leader survival. As the coalition continues to expand, leaders need supporters from an ever increasing number of income groups. Thus, the leader treats an increasingly large number of groups as politically equal; meaning that they face differential, progressive tax rates.
Treating more groups as politically equal suggests another previously unexamined implication of tax policy: volatility of tax policy. Winning coalitions can vary in two ways that influence expected tax policy. Coalitions, as already established, can vary from very small to mid sized to very large. In the case of coalitions that are not especially large, they can also vary markedly in terms of the part of the income distribution from which they are drawn. To understand both the volatility of tax rates and their relative regressivity or progressivity, we need to put these two elements of the coalition together.
Regimes with a very small winning coalition tend to have simple flat taxes. As coalition size increases, leaders are likely to adopt tax systems that privilege their supporters and extract more from other groups. Which groups are favored influences taxes and progressivity. If a leader draws her support from relatively poor groups, then privileging these groups through tax policy makes the tax schedule appear somewhat more progressive. In contrast, if the relatively small coalition leader’s backers are predominantly from wealthy income groups, then regressivity becomes the dominant feature of taxation. If middle income groups are the backer of the leader, then the rich and the poor—those not in the coalition—are likely to be taxed highly while the middle income groups enjoy tax breaks. The average level of tax progressivity depends upon the composition of support groups. Hence, in such middling systems there can be considerable variance in the rates and progressivity of the tax structure. This discussion indicates that the theory’s logic calls for the inclusion of both linear and quadratic institutional effects on the progressivity of income tax in the empirical analysis. As coalition size becomes very large leaders must draw supporters from many different income groups and concerns for political equality lead to progressive taxation. As all leaders in fully fledged democracies need support from so many groups, tax policies are progressive and relatively low variance. As long as a leader draws some support from an income group, she treats that group equally. Thus, an additional implication of the theory is that tax structures in large coalition regimes characteristically ameliorate income inequalities and reduce Gini coefficients relative to tax policies in small coalition regimes. This is as expected within democratic settings in the literature on redistributive politics. Here, however, we see how the logic extends to all polities and how it can be derived within the logic of selectorate politics rather than from a model that assumes rather than derives political equality.
Hypotheses, Data and Statistical Specifications
The model implies several testable implications. It predicts (1) greater income tax progressivity in large coalition systems; (2) a flat income tax or a relatively regressive complex tax structure as coalition size gets to be small; (3) higher variance in tax rates and progressivity in intermediate-sized coalition regimes than in small or large coalition regimes; and (4) national Gini coefficients are expected to be significantly reduced by tax policy in large coalition political settings compared with tax policy in small coalition political settings. The model also has testable implications regarding how the relative wealth of winning coalition members affects taxation and spending priorities. While in past work on democracies scholars has used left-right leaning to differentiate between relatively poor and relatively wealthy supporters (Iversen and Soskice Reference Iversen and Soskice2006), we unfortunately lack data to make such systematic comparisons across all political systems.
Our theory focuses on the political roots of progressivity of taxation in general. Unfortunately, we do not have the data to examine the incidence of all taxes on different income groups. Instead, we must content ourselves with an important subset of taxation, income tax, that can be readily associated with the relative income of given segments of society. We use income tax data from Sabirianova-Peter, Buttrick and Denvil (Reference Sabirianova-Peter, Buttrick and Duncan2010) that were generously provided to us by Professor James Hines at the University of Michigan. These data provide a breakdown of income tax rates across different income levels. The income tax variables are measured from 1981 to 2005. There are data in the average year for 110 countries (median number=109), with 68 being the smallest country sample (1981) and 139 being the largest (1999). Our analysis focuses on two tax measures: Avg.Prog. and FlatTax.
The variable Avg.Prog. measures the degree of progressivity of average income tax rates. As explained by Sabirianova-Peter, Buttrick and Denvil (Reference Sabirianova-Peter, Buttrick and Duncan2010), “Average rate progression characterizes the structural progressivity of national tax schedules with respect to the changes in average rates along the income distribution. It is the slope coefficient from regressing actual average tax rates on the log of gross income.” Figure 2 shows average US income tax rates at the four income levels from which progressivity is calculated at three different time periods. In addition to showing the temporal variation in taxation, the figure is useful to illustrate the construction of measures of tax progressivity. The data provide the average tax rates at four different income levels: 1, 2, 3 and 4 times per capita income. These incomes are plotted on the horizontal axis of Figure 2 on a logarithmic scale. The vertical axis plots the average income tax rate at these income levels in 1985, 1990 and 2004. The graph shows the trends that a casual observer of US politics might expect. Over time, incomes have increased and average incomes tax rates have declined. Progressivity of taxation has also declined. As described, the degree of progressivity is measured by the slope of the best fit (OLS) line through the four points that relate to each year of data. As a robustness check, the appendix contains similar analyses to those in the main text but examining progressivity based upon marginal tax rates, rather than average tax rates. We refer to this variable as Marg.Prog.

Fig. 2 US tax rates and progressivity
The data provide average income tax rates at four income levels: once, twice, three times and four times per capita income. If a nation assesses no income tax at any of these level then we code the dummy variable NoTax as taking value one. The variable FlatTax is a dummy variable coded 1 if there is a single, non-zero, income tax rate across all four income levels in the country and 0 if there are two or more brackets. We treat the FlatTax variable as missing when NoTax=1. The variable Flat or No Tax is a dummy variable coded as one if either there is no income tax or there is a single flat rate.
To assess inequality, we use Solt’s (Reference Solt2009) measures of GINI coefficients both before taxation and redistribution (GINI), and after taxation and redistribution (GiniNet). We place these variables on a 0–100 scale. Although our theory focuses on who leaders want to assist rather than demand for redistribution, we include GINI as a right-hand side variable in several analyses as a measure of ex ante inequality, and hence to provide an assessment of the demand for redistribution. We do not focus on the impact of tax progressivity for redistribution (our appendix contains detailed analyses on this topic). We close our results section by graphically showing the redistributive impact of taxation and redistribution by examining ΔGini=GiniNet−GINI under different political institutions.
We provide a series of fixed-effects model specifications (and random effects when the dependent variable is dichotomous). In the appendix, we provide additional tests using alternative measures. Our replication appendix contains further specifications, looking at different length lags and averaging the data over five-year periods. The results across the various specifications are essentially the same. Our objective is to measure the impact that governance institutions have on the dependent variables controlling for the logarithm of per capita income and for the logarithm of the country’s population. We measure the size of a regime’s winning coalition using Bueno de Mesquita et al.’s indicator W, the construction of which is explained in detail in their 2003 Logic of Political Survival. Although conceptually coalition size is continuous, as a practical matter, the measure of W takes values 0, 0.25, 0.5, 0.75 and 1. As a robustness check, we also specify coalition size using the Polity Democracy-Autocracy index, normalized from 0 to 1, a variable that we label Demo. The ln(Income t−5) is measured using the logarithm of the World Bank’s per capita GDP measure (in constant dollars for 2000 and lagged by five years). ln(Population) t−5 is the World Bank’s total population measure, lagged by five years. The theory emphasizes the impact of private goods on progressivity. To identify conditions when leaders readily provide such goods, we measure the availability of natural resource rents using oil and ore exports as a percentage of GDP (data from the World Bank Development Indicators). We label this variable as OilOre and also evaluate the interaction between coalition size and rents. Fiscal capacity limits the ability of states to impose high tax rates or complex tax systems. In several analysis of progressivity, we include measures of the average tax rate assessed at per capita income, a variable we refer to as Avg.Tax. War has been argued to be a driver of tax innovation (Scheve and Stasavage Reference Scheve and Stasavage2010). We use Sarkees and Wayman (Reference Sarkees and Wayman2010) to code for occurrences of war and civil war.
Table 1 provides summary statistics for the core variables. We summarize the core institutional and income variables for the set of nation-year observations for which we have data on the tax progressivity. Table 1 also shows summary statistics of inequality. These data are available for a wider range of nation-years than the tax data.
Table 1 Summary Statistics

Results
Table 2 shows the composition of the data across institutions and wealth. The data are divided into low, middle and high income according to the World Banks’ definition (in which middle incomes nations have per capita GDP between $1025 and $12,176 in 2000 US$) and three groupings of political institutions (W<0.75, W=0.75 and W=1). The table shows progressivity based on average tax rates (Avg.Prog.), the average rate of tax at a per capita income level (Avg.Tax.), the presence of a flat tax or no tax and the number of observation within each category. Both income and institutions affect taxation. Rich, large coalition systems have the highest average rates of tax and the most progressive taxes. Poorer and smaller coalition systems tend to have less progressive and lower taxes. Flat tax systems are relatively rare and non-existent in wealthy large coalition regimes.
Table 2 Composition of Tax Data

No Tax and Flat Tax
The theory predicts that states with small coalition institutions or states that lack fiscal capacity are most likely to have no income tax or a flat tax. The summary statistics by income and institutions reported in Table 2 show there is considerable variation in the occurrence of flat tax and systems with no income tax. Here, we examine this variation.
The analyses in Table 3 use logit analysis with region-year random effects. Models 1 and 2 assess whether a nation has a flat or no tax. Models 3 and 4 ask whether a nation has a flat tax, conditional upon having some non-zero income tax. Each model includes the size of the winning coalition and the squared size of the winning coalition lagged by five years and logarithmic measures of per capita income and population, again each lagged by five years. Models 2 and 4 also include the OilOre t−5 measure of resource wealth (and its interaction with W t−5). Such resources provide alternative sources of government funding, in conjunction with a small coalition, are likely to lead to the abundant private goods that make regressive or flat taxes likely (Proposition 5). Models 3 and 4 also include Avg.Tax t−5, a measure of the tax rate at per capita income.
Table 3 Institutions and Flat or No Tax

Reg-yr=region-year.
*p<0.10, **p<0.05, ***p<0.01.
Institutions affect the likelihood of flat or no taxes. In each model, the coefficient estimates predict that large coalition systems are less likely to have flat or no income taxes. The joint hypothesis tests that both the linear and square measure of coalition size are zero (and also the hypothesis tests that their sum is zero) are highly significant in models 1 and 3. Small coalition systems are more likely to have no income tax or a flat tax rate than larger coalition systems. However, in models 2 and 4, that include resource wealth measures, the direct role of institutions is statistically insignificant. In these latter models, flat taxes are strongly associated with the presence of natural resources in small coalition systems.
Nations with large populations are less likely to have a flat or no tax. The analyses find mixed effects for the role of income. Models 1 and 3 find significant positive effect for per capita income on the likelihood of a flat or no tax, a result contrary to expectations about the simple or no tax structures being due to capacity constraints. However, models 2 and 4, that include natural resource measures (alternative means of government finance), show that poor nations (i.e., those with limited fiscal capacity) are likely to have no or flat taxes once natural resource wealth is accounted for. It is worth noting that all of the 61 observations reported in Table 2 as having high income and small coalition size have natural resources rents in excess of 10 percent of GDP and 82 percent of these observations have no income tax.
Natural resource wealth increases the likelihood of flat or no taxes, at least outside of the largest coalition systems. Figure 1 illustrated that in the presence of high levels of private goods, taxes are likely to be regressive or flat and the provision of such private goods is facilitated by a combination of abundant nature resource rents and a relatively small coalition. The analyses in models 2 and 4 estimate highly significant positive coefficients on the resource wealth variable OilOre t−5, that indicate resource-rich small coalition systems are likely to have a flat or no tax. However, the analyses support the prediction that the impact of resource wealth occurs only in small coalition systems. The coefficient estimates for the interaction between W and OilOre are negative. Joint hypothesis tests show that the sum of the coefficients OilOre t−5 and W t−5×OilOre t−5 are insignificant, suggesting that while natural resource wealth is highly likely to lead to a flat or no tax in small coalition settings, in large coalition systems natural resources do not increase the likelihood of a flat or no income tax. Models 3 and 4 include a measure of the average tax rate at per capita income. States with high levels of tax are less likely to have flat taxes (these analyses excluded observations with no income tax). Consistent with predictions, small coalition systems are much more likely to have a flat tax. Next, we analyze progressivity.
Progressivity
We start our analysis with simple graphical comparisons of how political arrangements affect tax progressivity. Figure 3 provides a box plot that shows the average rate of progressivity for middle income nations under different institutional arrangements. The figure dramatically illustrates that as coalition size increases tax rates become more progressive. Among middle income nations, average progressivity in the smallest coalition systems is 1.7. In comparison, the average rate of progressivity for the largest coalition middle income nations is 5.4. Large coalition systems are more progressive than smaller coalition systems. Figure 3 examines only middle income nations. The analogous figure for nations of all income levels shows an even starker contrast between nations of different institutional configurations. We focus on the graph for middle income nations because of compositional concerns, as seen in Table 2. As a practical matter, democracy is correlated with wealth. There are relatively few poor, large coalition systems. Indeed, Mongolia is the only nation for which we have data that has maximal winning coalition size and is coded as poor by the World Bank. At the upper end of the income spectrum, the high-income nations contain a disproportionate number of large coalition systems.

Fig. 3 Progressivity and coalition size
Table 4 contains fixed-effect regression models on a basic specification that estimates how institutions, income and population affect tax progressivity (Avg.Prog.).Footnote
6
The analyses exclude observations in which a nation has no income tax. However, the results are similar with the inclusion of these cases. Model 5 is an OLS specification with the inclusion of the calendar year to capture any temporal trend. Model 6 includes 25 year fixed effects. Model 7 includes 135 nation fixed effects. Model 8 includes 167 region-year fixed effects. Each model includes both the linear and squared version of W
t−5. All four models estimate that the largest coalition systems (W=1) exhibit higher average progressivity than the smallest systems (W=0). The predicted differences are between 1.8 for models 1 and 2 and 0.7 for model 3, which is a substantial impact when considering that the SD of Avg.Prog. in the sample is 3.3. Models 7 and 8 predict Avg.Prog. increases monotonically with W. However, models 5 and 6 suggest non-monotonicity with nations with W
t−5=0.25 having the lowest level of progressivity. In models 5, 6 and 8 joint hypothesis tests find the coefficient estimates on W
t−5 and
 $$W_{{t{\minus}5}}^{2} $$
are jointly significant. Model 7 contains nation fixed effects. Within the domain of the data, there are relatively few changes in political institutions. In particular, within the 2057 observations, only 106 observations show change in W
t−5 from the previous year and 66 of the 135 nations in our data experience no institutional change at all within the sample. This provides some justification for the theoretical assumption that institutions are fixed in the relatively short term. The lack of institutional variance is particularly severe in the largest winning coalition category. Of the 26 nations that enter the sample with maximal coalition size (W
t−5=1) only five experience any institutional change within the sample.Footnote
7
When the variable of theoretical interest varies relatively little within the sample, Beck and Katz (Reference Beck and Katz2001) compare the inclusion of nation fixed effects to “throwing out the baby with the bath water.” Given these difficulties, further analyses focus on region-year fixed effects.
$$W_{{t{\minus}5}}^{2} $$
are jointly significant. Model 7 contains nation fixed effects. Within the domain of the data, there are relatively few changes in political institutions. In particular, within the 2057 observations, only 106 observations show change in W
t−5 from the previous year and 66 of the 135 nations in our data experience no institutional change at all within the sample. This provides some justification for the theoretical assumption that institutions are fixed in the relatively short term. The lack of institutional variance is particularly severe in the largest winning coalition category. Of the 26 nations that enter the sample with maximal coalition size (W
t−5=1) only five experience any institutional change within the sample.Footnote
7
When the variable of theoretical interest varies relatively little within the sample, Beck and Katz (Reference Beck and Katz2001) compare the inclusion of nation fixed effects to “throwing out the baby with the bath water.” Given these difficulties, further analyses focus on region-year fixed effects.
Table 4 Institutions and Progressivity

*p<0.10, **p<0.05, ***p<0.01.
Pakistan’s volatile political history provides a useful opportunity to observe the impact of political institutions on progressivity within a time series. Figure 4 shows the average income tax rate at one, two, three and four times per capita income in 1985, 1995 and 2005. The construction of the graph is similar to that for the United States discussed earlier. In 1985, and again in 2005, Pakistan was a small coalition military regime. However, in 1995 it had at least some trappings of democracy. The effects of these variations in coalition size can be seen in Pakistan’s tax rates. During its partially democratic period, Pakistan had more progressive taxes. The dashed line in Figure 4 corresponds to the best fit line for 1995 and it is substantially steeper than the corresponding lines for either 1985 (solid line) or 2005 (dotted line). Returning to the analysis in Table 4, the coefficient estimates in models 5, 6 and 8 suggest that rich and low population nations, on average, have more progressive taxes. Table 5 examines the robustness of the finding that large coalition size increases progressivity. Model 9 includes variables for the presence of war and civil war and the average tax rate assessed on incomes at the national per capita income. Model 10 includes natural resource variables and model 11 includes all the variables included in models 9 and 10. Model 12 includes measures of inequality in the form of the GINI coefficient (and its interaction with W).

Fig. 4 Taxes and progressivity in Pakistan
Table 5 Institutions and Progressivity

Reg-yr=region-year.
*p<0.10, **p<0.05, ***p<0.01.
The coefficient estimates in each of the models in Table 5 show that progressivity increases in coalition size. Joint hypothesis tests of W
t−5 and
 $$W_{{t\,{\minus}\,5}}^{2} $$
are highly significant in models 9 and 10, although insignificant in models 11 and 12. Moving from the smallest to the largest coalition system suggests an increase in progressivity on the order of about 1 unit. The SD of the Avg.Prog. is about 3.3. The estimates suggest wealthier nations exhibit higher tax progressivity than poorer nations. A doubling of per capita income is associated with an increase in progressivity of about 0.6. Nations with large populations tend to be less progressive. Nations with high tax rates are also likely to be more progressive. A 1 SD increase in the average tax rate assessed on incomes at national per capita income (Avg.Tax.) predicts an increase of about 13 percent of a standard deviation in progressivity.
$$W_{{t\,{\minus}\,5}}^{2} $$
are highly significant in models 9 and 10, although insignificant in models 11 and 12. Moving from the smallest to the largest coalition system suggests an increase in progressivity on the order of about 1 unit. The SD of the Avg.Prog. is about 3.3. The estimates suggest wealthier nations exhibit higher tax progressivity than poorer nations. A doubling of per capita income is associated with an increase in progressivity of about 0.6. Nations with large populations tend to be less progressive. Nations with high tax rates are also likely to be more progressive. A 1 SD increase in the average tax rate assessed on incomes at national per capita income (Avg.Tax.) predicts an increase of about 13 percent of a standard deviation in progressivity.
Models 9 and 11 control for the occurrence of war and civil war. Both forms of conflict reduce progressivity.Footnote 8 Although this result is contrary to Scheve and Stasavage’s (Reference Scheve and Stasavage2010) predictions that war leads to the creation of comprehensive taxation, there are relatively few wars in the sample and many of the combatants had already transitioned in terms of tax capacity. Although our earlier analyses found that natural resource rents had a significant effect on the likelihood of no or flat tax, conditional upon having an income tax, natural resource rents have no significant impact on the progressivity of average tax rates.
GINI provides a measure of inequality and so can be thought of as a proxy for the aggregate demand for redistribution. The theory emphasizes the political goal of rewarding supporters rather than correcting social injustice. The results in model 12 bear out these theoretical expectations as overall inequality has little impact on the progressivity of taxes.
Consistent with predictions, our analyses show that small coalition systems are the most likely to have flat tax systems and that large coalition systems have the most progressive tax structures. However, direct support for this finding is weakened by the inclusion of additional control variables. This weakening is especially severe when the controls are anticipated to be affected by coalition size (average tax rates, for instance). Next, we shift the focus of our analysis to the volatility of the tax system.
Volatility of Taxes and Progressivity
As we explored in the Central Implications section, the structure of taxes depends upon how broad a support base a leader needs and the incomes of these supporters. Left-right political leaning provides a proxy for the income of political party support in democracy. Unfortunately, comparable systematic measures are unavailable for non-democratic systems so we cannot directly test the impact of supporter income (although we illustrate this effect below in a couple of anecdotal cases). Instead, we focus on theoretical predictions for second-order statistics. When the coalition is very small, a leader is likely to use a simple flat tax, or a tax system that provides breaks only for a small number of groups. Such systems are therefore likely to be uniformly regressive. At the other extreme, democratic leaders require support from many income groups. The theoretical imperative to treat these groups political equally leads to progressive tax structures in these systems. In more intermediate coalition-sized systems, the progressivity of taxes depends upon the income of support groups. If such supporters are poor, then taxes are likely to be progressive. When supporters are drawn from relatively wealthy groups taxes are expect to be more regressive. The mean level of progressivity in such middling coalition systems depends upon the proportion of regimes backed by poor, middle income and rich income groups, which, as stated, we have no systematic means of determining. However, the theory predicts that while very small coalition systems are uniformly regressive and very large coalition systems are generally progressive, intermediate-sized coalition systems will vary more. We test this volatility prediction. Figure 5 provides a preliminary assessment of the volatility prediction by plotting the residuals from regression model 11 against the linear prediction. The plot is presented for model 11 as this was the most comprehensive model specification, but the analogous plots for the other models look extremely similar. The residuals associated with the smallest coalition systems (W
t−5=0) are shown with squares and these observations have the lowest predicted linear values (
 $$X\hat{\beta }=1.84$$
) and the SD of the residuals is 2.14. The largest coalition systems (W
t−5=1) are shown with circles. Despite having the largest average predicted level of progressivity (
$$X\hat{\beta }=1.84$$
) and the SD of the residuals is 2.14. The largest coalition systems (W
t−5=1) are shown with circles. Despite having the largest average predicted level of progressivity (
 $$X\hat{\beta }=6.60$$
), these residuals have the smallest standard deviation by coalition size grouping, σ=1.93. The SD of the residuals associated with the coalition sizes W
t−5=0.25, 0.5 and 0.75 are 2.28, 2,56 and 2.13, respectively. As anticipated, there is more volatility in the progressivity of intermediate-sized coalitions.
$$X\hat{\beta }=6.60$$
), these residuals have the smallest standard deviation by coalition size grouping, σ=1.93. The SD of the residuals associated with the coalition sizes W
t−5=0.25, 0.5 and 0.75 are 2.28, 2,56 and 2.13, respectively. As anticipated, there is more volatility in the progressivity of intermediate-sized coalitions.
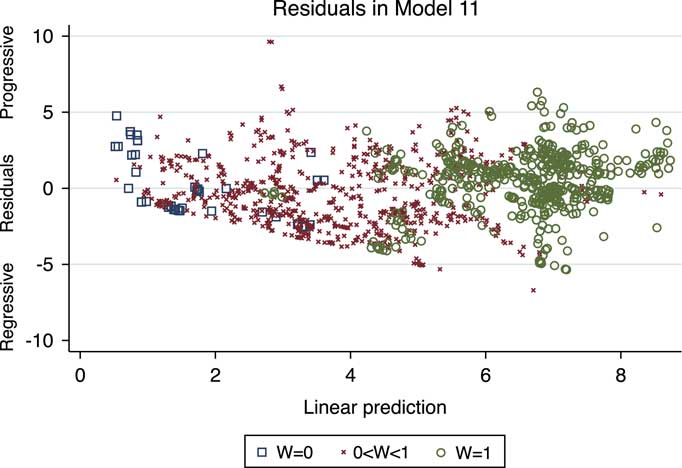
Fig. 5 Residuals in model 11 versus linear prediction by W
Knowledge of specific cases allows us to illustrate the plausibility of the argument that variance in progressivity arises from differences in the relative income of the groups that back the government. Figure 6 plots the residuals, that is differences between actual progressivity and predicted progressivity, from model 11 for Brazil (triangles) and Argentina (squares).Footnote 9 In the late 1980s, Brazil had a relatively populist government. Consistent with theoretical expectations, Brazil appears more progressive than predicted by the regression model, which lacks knowledge of the incomes of the regime’s backers. By the 1990s, when we have data for both Brazil and Argentina, each nation appears less progressive than predicted by the regression model that is uninformed about the coalition’s incomes (negative residuals). During this period, both Argentina and Brazil had relatively right-wing governments that promoted the interests of relatively wealthy groups, as reflected in the figure. During the 2000s, both Argentina and Brazil show a marked jump in progressivity (residuals become much less negative) associated with the coming to power of Luiz Inácio Lula da Silva in the case of Brazil (2003) and Néstor Kirchner in Argentina (2003), two populist leaders backed by poorer groups than their predecessors. While indicative of the theory’s expectations, absent data on the relative income of supporters, we cannot systematically test this prediction. Instead, we return to examining the volatility argument.
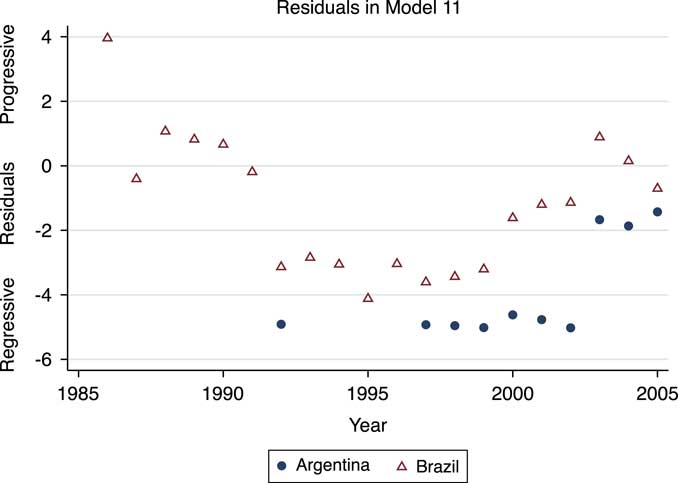
Fig. 6 Model 11 residuals for Argentina and Brazil
To further investigate how institutions affect tax volatility, we explicitly model the heteroskedascity within the progressivity of tax rates. Building on the standard regression model, y it =x it β+ε it , we treat the stochastic error term ε it as normally distributed with mean 0 and variance σ 2. We depart from the standard model by treating σ as a function of institutional and economic variables. Specifically, we model ln(σ) as distributed normally with mean z it γ, where z it is a vector of independent variables and we estimate both β and γ using standard maximum likelihood techniques. Table 6 shows estimates for both the standard linear Xβ term and the variance term, ln(σ). Models 13–16 include region-year fixed effects in the Xβ components (but not in the variance components) and have similar specifications to those reported earlier with largely similar results. Progressivity increases in coalition size, although joint hypothesis tests show this effect to be statistically significant only in model 13. Rich nations are more progressive, as are those with high tax rates assessed on incomes at per capita income. War and civil war reduce progressivity, while natural resource wealth shows no statistically significant effects on progressivity. Given these similarities with earlier results, we move to examining the volatility of tax progressivity.
Table 6 Institutions and Heteroskedascity in Tax Rates and Progressivity

Reg-yr=region-year.
*p<0.10, **p<0.05, ***p<0.01.
The estimates of the ln(σ) equation show the same non-monotonicity observed in the simple comparisons of residuals. As follows from the highly significant joint hypothesis estimates of W
t−5 and
 $$W_{{t{\minus}5}}^{2} $$
coefficients in the ln(σ) equation, the variance in progressivity is highest in intermediate-sized coalition systems, with the largest coalition systems having the lowest predicted variance. Once we control for coalition size, income and population size appear to have no significant influence on the volatility of progressivity. However, models 14, 15 and 16 suggest states with high average tax rates (Avg.Tax) have higher variance in tax progressivity.
$$W_{{t{\minus}5}}^{2} $$
coefficients in the ln(σ) equation, the variance in progressivity is highest in intermediate-sized coalition systems, with the largest coalition systems having the lowest predicted variance. Once we control for coalition size, income and population size appear to have no significant influence on the volatility of progressivity. However, models 14, 15 and 16 suggest states with high average tax rates (Avg.Tax) have higher variance in tax progressivity.
The results in Table 6 support the predictions that intermediate size coalition systems have volatile tax rates. Building from the theory, we expect that all else equal, negative residuals—those indicating the tax system is more regressive that predicted—should be associated with leaders who draw support from relatively rich income groups. In contrast, when political backers are drawn from relatively poor income groups, the residuals are predicted to be positive. Although the cases of Argentina and Brazil fit this pattern, absent a systematic measure of which groups support leaders we can not test these predictions further.
Redistribution
Income redistribution is a natural consequence of progressive taxation, all else equal. Hence, the theory predicts that income inequality is a strategic product of the incentives created by political institutions. Leaders in large coalition systems set highly progressive taxes and so it is natural to expect that a reduction in income inequality follows from these policies. In contrast, small coalition leaders choose relatively regressive taxes that do less to ameliorate income inequality. Figure 7 shows the dramatic effect political institutions have on reducing inequality in middle income countries by showing box plots for ΔGini, which as defined earlier is the difference in GINI coefficients before and after taxation and redistribution. Again, we focus on middle income nations because of data composition concerns. The analogous plot for all nations looks very similar. Within the largest coalition systems (W=1), income inequality is reduced by an average of 12.2. In contrast, in smaller coalition systems (W<1) the reduction in income inequality is only 4.7.
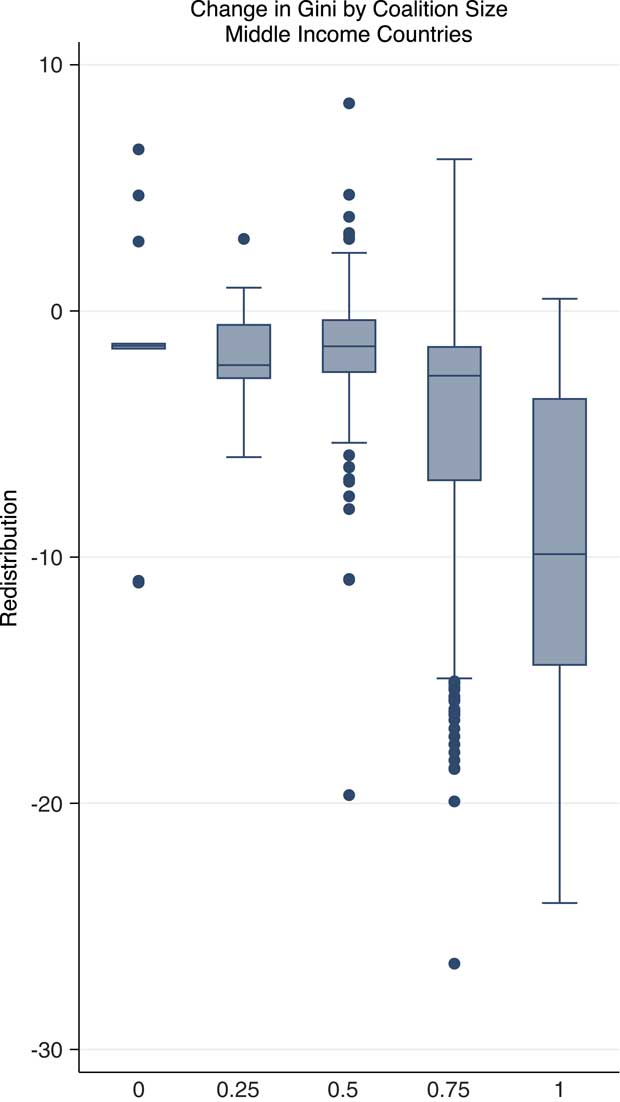
Fig. 7 Redistribution and Coalition Size: Middle Income Nations
Conclusions
We propose a model of income tax policy within the selectorate framework that emphasizes leader motivation to choose taxing and spending decisions designed to maximize their chances of surviving in power. The model is, we believe, the first to address income tax choices across all forms of governance rather than being restricted to democratic political systems or a simple dichotomy between democracy and non-democracy. In the model, income redistribution is an externality of leader survival in large coalition systems, rather than being a leader’s objective function (Barro Reference Barro1998). Leaders seek political equality not out of a normative desire for equity but rather as a positive feature of enhancing their survival prospects. This imperative to treat supporters equally means that tax rates become more progressive and less volatile as the winning coalition on which an incumbent depends increases in size. Small coalition leaders, in contrast, more often choose flat taxes to enhance their survival prospects. Because they are able to draw their small coalition from a narrow income band and that band may be situated at any place in the income distribution, their tax rates tend to be more volatile than is true for large coalition incumbents. These and other novel implications of the model are tested and found to be strongly supported by the empirical record for >100 countries over 25 years.
Past studies of taxation in democracies assume that left parties tend to favor income redistribution through taxation while right parties are less inclined toward redistribution. Here, we have shown that these choices are part of an equilibrium strategy. When the winning coalition’s average member’s income is low, tax rates are higher than when the average member’s income is high. In that sense, we can say that the differences, for instance, between the tax policies of Republicans and Democrats in the United States can be explained without appeal to ideology. Each draws on a coalition of supporters from a somewhat different part of the income distribution and pursues the tax policies that maximize leader survival given the interests of their coalition. Likewise, the model offers an explanation both for populist and elitist smaller coalition regimes, with the former expected to have lower taxes on the poor than the latter. Consider, for instance, that the tax rate on per capita income under Hugo Chavez’s populist small coalition government in Venezuela was 0 percent. His larger coalition predecessors taxed per capita income on average by nearly 6 percent even though oil and ore revenue was about the same in both periods.
The selectorate model of taxation offers new insights into income tax policy as a function of governance institutions. Much, however, remains to be done. Many nuances of the theory here require data on the income of the population subset in an incumbent’s winning coalition. To the extent that such data can be assembled, a big question, it will be possible to probe tax policy in much greater depth. Nevertheless, the model developed here provides a basis for tying tax policy to governance institutions whether left or right leaning and whether democratic or not.