Introduction
Documenting the organization and host specificities of plant–herbivore food webs is of great importance for understanding biodiversity patterns and the processes that maintain these patterns (e.g., Lewinsohn et al. Reference Lewinsohn, Novotny and Basset2005; Novotny et al. Reference Novotny, Miller, Baje, Balagawi, Basset, Cizek, Craft, Dem, Drew, Hulcr, Leps, Lewis, Pokon, Stewart, Samuelson and Weiblen2010; Nyman Reference Nyman2010; de Araújo et al. Reference De Araújo, Vieira, Lewinsohn and Almeida-Neto2015). Today, biodiversity is distributed heterogeneously across the Earth, and determining why differences occur has long been a core objective for scientists. In the last decade, the number of studies on patterns of biodiversity distribution has greatly increased (Engemann et al. Reference Engemann, Sandel, Enquist, Jorgensen, Kraft, Marcuse-Kubitza, McGill, Morueta-Holme, Peet, Violle, Wiser and Svenning2016; Pärtel et al. Reference Pärtel, Bennett and Zobel2016), perhaps in association with increased concern about the future of biodiversity. Predicting the response of biodiversity to global changes has been identified as a research priority because of its utility in identifying the most effective scheme for diversity conservation actions (Gaston Reference Gaston2000).
The modern world is characterized by a strong latitudinal diversity gradient in which the number of species and higher taxa peaks in equatorial regions and declines toward the poles (Willig et al. Reference Willig, Kaufman and Stevens2003; Hillebrand Reference Hillebrand2004). The tropics and subtropics, characterized by high temperature and precipitation and relative environmental stability, have the highest plant and insect biodiversity and strong biotic interactions (Erwin Reference Erwin1982; Coley and Barone Reference Coley and Barone1996; Pennings and Silliman Reference Pennings and Silliman2005; Dyer et al. Reference Dyer, Singer, Lill, Stireman, Gentry, Marquis, Ricklefs, Greeney, Wagner, Morais, Diniz, Kursar and Coley2007; Adams et al. Reference Adams, Ahn, Ainuddin and Lee2011). These regions also display high plant and insect beta diversity and considerable changes in species composition over short distances (Lewinsohn and Roslin Reference Lewinsohn and Roslin2008; Jankowski et al. Reference Jankowski, Ciecka, Meyer and Rabenold2009). Janzen (Reference Janzen1967) hypothesized that the more predictable the environment, both in terms of the range and regularity of changes, the smaller the change required to serve as a barrier to dispersal. Organisms that live in less stable environments, like the present-day highly seasonal temperate zone, may be better adapted to a wider range of conditions than organisms that live in stable environments, like the wet tropics. Thus, “mountain passes appear higher in the tropics” than in the temperate zone (Janzen Reference Janzen1967), a result that has been supported by a variety of modern studies (Ghalambor et al. Reference Ghalambor, Huey, Martin, Tewksbury and Wang2006; Calosi et al. Reference Calosi, Bilton, Spicer, Votier and Atfield2010).
Archibald and colleagues (Reference Archibald, Greenwood and Mathewes2013) tested Janzen's hypothesis using high paleoelevation midlatitude insect faunas from the warm early Eocene. They compared insect fossils at five sites spanning ~1000 km in the Okanagan Highlands, Canada, and found that less than 5% of insect species occurred at more than one site (Archibald et al. Reference Archibald, Greenwood and Mathewes2013). Although these faunas occur in temperate latitudes, the climate in which they lived more closely resembled that of the modern subtropics due to a shallower latitudinal temperature gradient and globally low temperature seasonality during the early Eocene (Bijl et al. Reference Bijl, Schouten, Sluijs, Reichart, Zachos and Brinkhuis2009; Huber and Caballero Reference Huber and Caballero2011; Eberle and Greenwood Reference Eberle and Greenwood2012; Archibald et al. Reference Archibald, Greenwood and Mathewes2013). Archibald and colleagues’ work suggests that a rewrite of Janzen's original hypothesis to “mountain passes appear higher in equable, low-seasonality regions” is warranted.
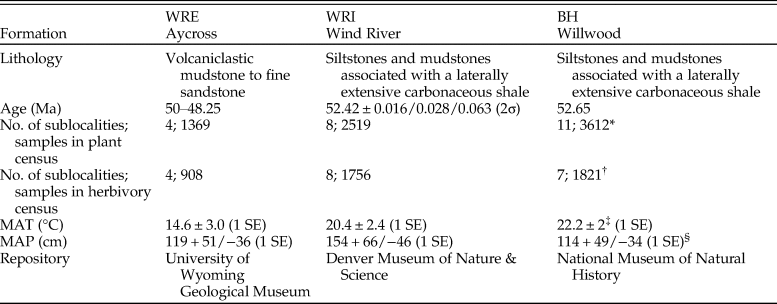
Here, we present new plant and insect herbivore damage census data from the warmest interval of the last 66 Myr, the early Eocene climatic optimum (EECO, 52.6–50.3 Ma; Payros et al. Reference Payros, Ortiz, Millán, Arostegi, Orue-Etxebarria and Apellaniz2015), when mean annual surface air temperatures were more than 10°C warmer than during the preindustrial period (Caballero and Huber Reference Caballero and Huber2013; Loptson et al. Reference Loptson, Lunt and Francis2014). Our new floodplain paleofloral sites in the Wind River Basin, central Wyoming, capture the basin interior (WRI) and the basin edge (WRE) ecosystems and can be compared with published data from an EECO paleoflora in the neighboring Bighorn (BH) Basin that occurs in the same depositional environment as the WRI flora (Davies-Vollum and Wing Reference Davies-Vollum and Wing1998; Currano Reference Currano2009). Our main goals are to: (1) analyze whether there is a uniform distribution and diversity of plant species across the study area and 2) determine whether there are similar suites and diversities of insect herbivore damage on the paleofloras in the study area. By looking for endemism in both plant and insect herbivore communities during the EECO, we can test Janzen's ideas on the importance of mountain passes in driving macro-ecological patterns and investigate which modern macro-ecological patterns also occur during greenhouse intervals. Additionally, we can clarify the extent to which studies in the Bighorn Basin, one of the best-cited records for ecosystem response to climate change in deep time (e.g., Currano et al. Reference Currano, Labandeira and Wilf2010, Reference Currano, Laker, Flynn, Fogt, Stradtman and Wing2016; Wing and Currano Reference Wing and Currano2013), can be generalized.
Materials and Methods
Geological Setting.—Tectonic activity associated with the Sevier Orogeny created a large foreland basin in the Late Jurassic that extended from northern Canada to the Gulf of Mexico. During the Late Cretaceous through the Eocene, Laramide deformation dissected this large basin and divided it into a series of smaller basins separated by basement-cored highlands (Dickinson et al. Reference Dickinson, Klute, Hayes, Janecke, Lundin, McKittrick and Olivares1988). In this study, we compare paleobotanical assemblages from neighboring Laramide basins: the Wind River and Bighorn Basins of central and northwestern Wyoming, respectively. Today, the Wind River Basin is surrounded on all sides by mountains (Fig. 1), with the Washakie Range and Owl Creek Mountains forming the northern boundary and topographic barrier from the Bighorn Basin. Sedimentology, sandstone petrography, detrital zircon ages, and stable isotopic analyses of Paleogene sedimentary rocks in the Wind River Basin indicate uplift of the Washakie and Wind River ranges by 54.5 Ma (Fan et al. Reference Fan, DeCelles, Gehrels, Dettman, Quade and Peyton2011), at least 2 Myr before our study interval. Local paleorelief between the Washakie, Owl Creek, and Wind River Mountains and the Wind River Basin floor is estimated to have reached at least 2 km by the early Eocene, and the paleoelevation of the Wind River Basin floor was likely within 500 m of sea level (Fan et al. Reference Fan, DeCelles, Gehrels, Dettman, Quade and Peyton2011; Fan and Carrapa Reference Fan and Carrapa2014). Thus, significant mountain ranges separated the two basins during our study interval, and the WRE locality (modern elevation of 2800 m) was likely higher than the basin interior sites (modern elevation of ~1500 m for both the BH and WRI paleofloras).
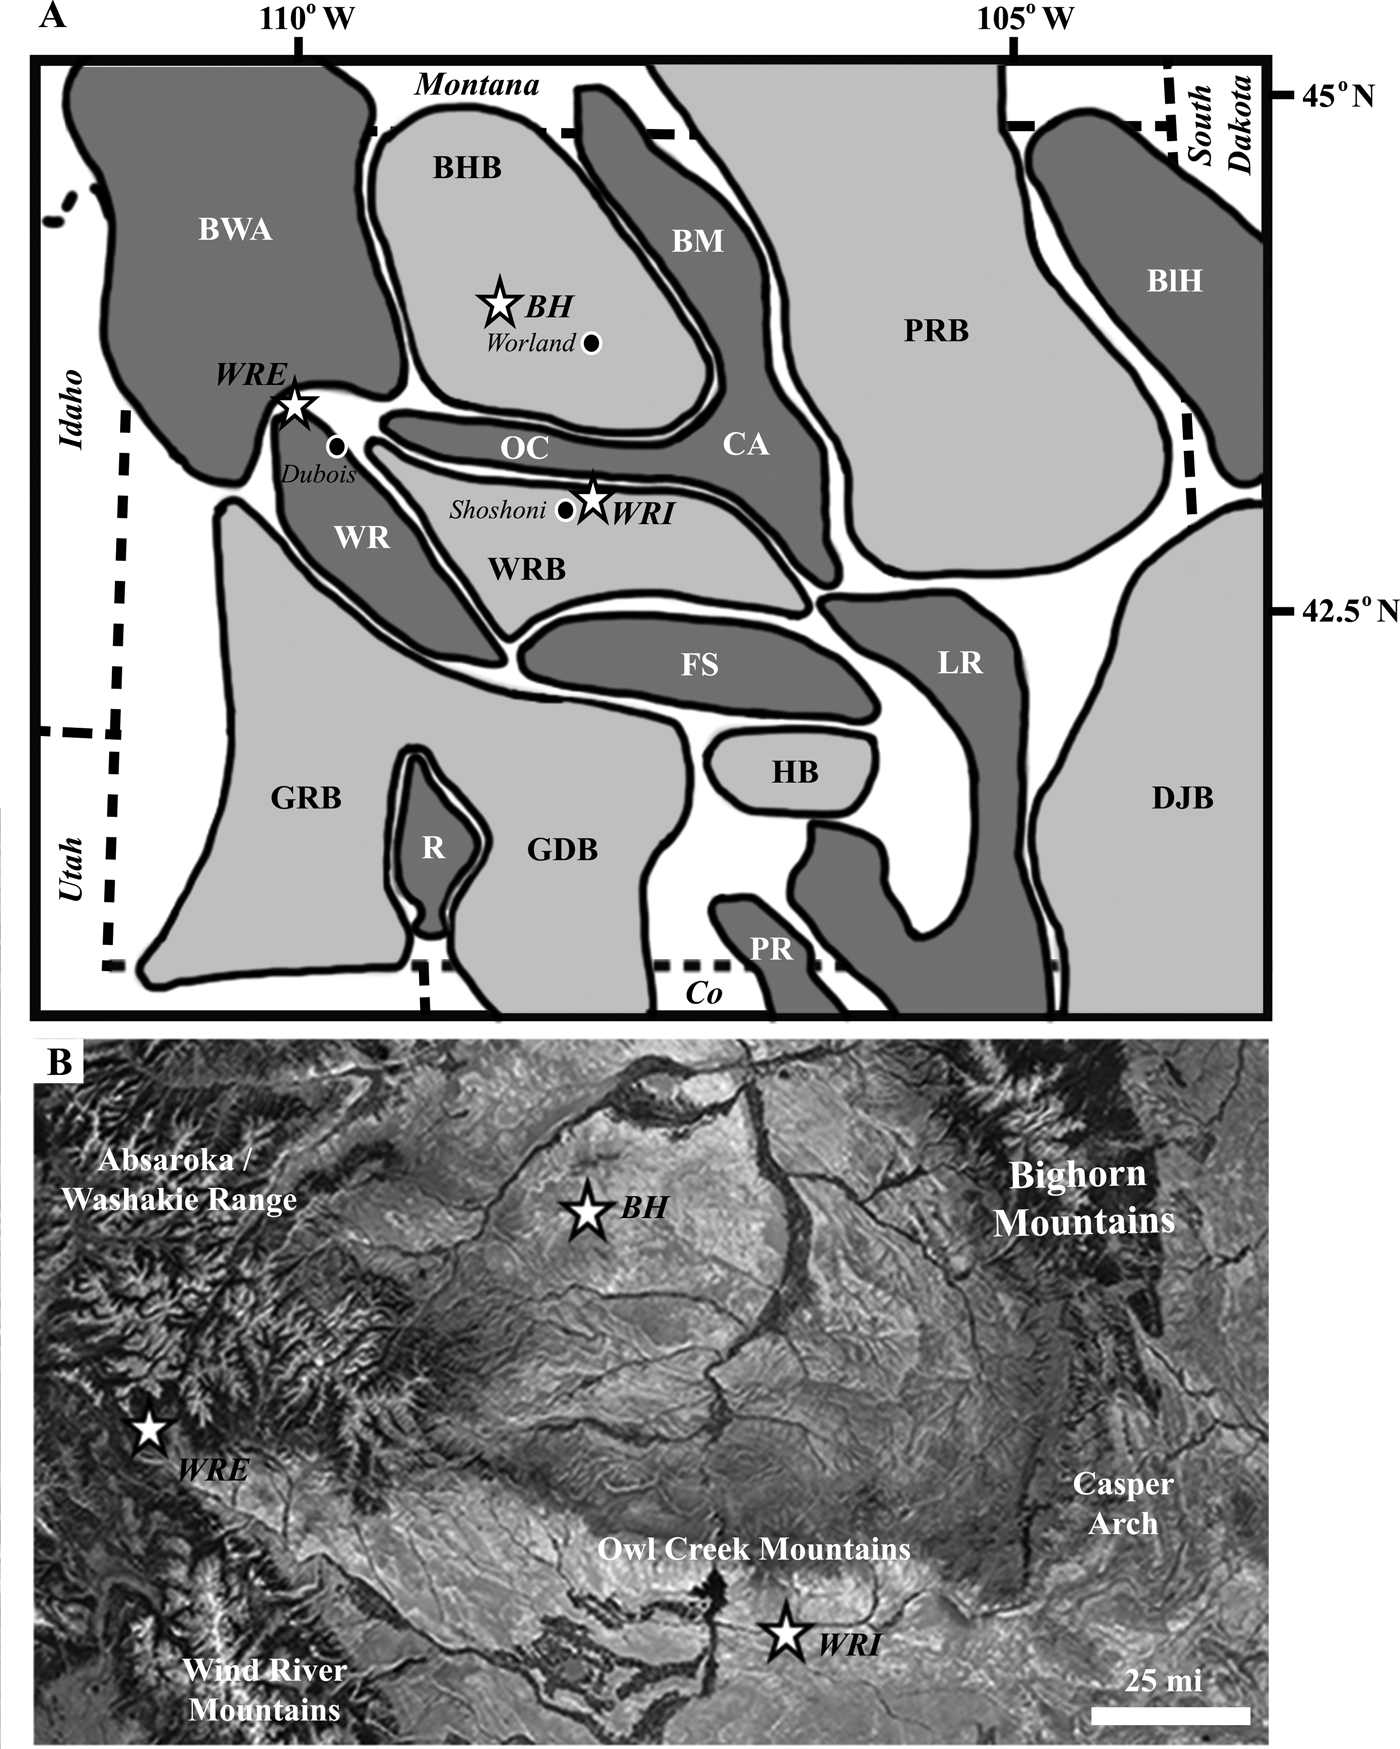
Figure 1. Studied early Eocene floras (BH, WRI, WRE) plotted on (A) a base map of the basins and uplifts of Wyoming, after Heller and Lui (Reference Heller and Liu2016), and (B) a satellite image. Nearby towns (Dubois, Shoshoni, and Worland) are shown to provide geographic context for each fossil flora within the state of Wyoming. Basins (light gray): BHB, Bighorn Basin; DJB, Denver-Julesburg Basin; GDB, Great Divide Basin; GRB, Green River Basin; HB, Hanna Basin; PRB, Powder River Basin; WRB, Wind River Basin. Uplifts (dark gray): BM, Bighorn Mountains; BlH, Black Hills; CA, Casper Arch; BWA, Beartooth–Washakie–Absaroka Ranges; FS, Ferris, Green, Seminoe, Shirley Mountains; LR, Laramie Range; OC, Owl Creek Mountains; PR, Park Range; R, Rock Springs uplift; WR, Wind River Mountains.
The WRI site occurs within the Lostcabin Member of the Wind River Formation, in the Muskrat Creek area of the central Wind River Basin (Keefer Reference Keefer1965; Seeland Reference Seeland1978). Plant compression fossils and in situ tree stumps are preserved in interfingering mudstones, siltstones, and sandstones that overlie a thick, laterally extensive carbonaceous shale layer. We interpret the depositional environment as fluvial to paludal, with plant remains being preserved on the floodplains of low-sinuosity, meandering streams. The paleofloras can be dated to the Wasatachian 7 North American Land Mammal Age (53–52 Ma; Gradstein et al. Reference Gradstein, Ogg, Orr and Smith2012) based on the presence of Lambdotherium popoagicum (Brontotheriidae) in nearby and laterally equivalent strata. A U-Pb date of 52.416 ± 0.016/0.028/0.063 (2σ) on zircons from a volcanic ash (sample IM0955) within a lignite in close stratigraphic proximity to the WRI floras is consistent with this age estimate as well (see the Supplementary Material, posted on Dryad, for complete U-Pb methods and data). Plant and insect damage censuses were conducted at eight sublocalities, with a maximum lateral distance of 3.7 km. All censuses were conducted on paleofloras collected from silty claystone layers, because this lithology has the best preservation of dicotyledenous angiosperm leaves.
The WRE site is approximately 200 km northwest of WRI and is 2 to 3 Myr younger in age. This site, known in the literature as the Kissinger Lakes flora, was discovered by Rohrer in the early 1960s and extensively collected by MacGinitie, who focused on the taxonomy of the paleobotanical remains and their use in paleoclimate reconstruction (MacGinitie et al. Reference MacGinitie, Leopold and Rohrer1974). Compressions of foliar material and reproductive organs occur in the Aycross Formation, which overlies the Wind River Formation and is the lowest part of the Absaroka volcanic field in western north-central Wyoming (Torres Reference Torres1985). The formation has an age of 50–48.25 Ma according to Smith et al. (Reference Smith, Carroll and Singer2008) and a maximum depositional age of 50.05 ± 0.65 Ma based on detrital zircon dating (Malone et al. Reference Malone, Craddock, Garber and Trela2017). The Aycross Formation is characterized by rapid lateral facies changes from variegated bentonitic mudstones to tuffaceous sandstones and conglomerates to tuffs and breccias (Winterfeld and Conard Reference Winterfeld, Conard and Lowell1983). Fossil remains in the study area occur within drab volcaniclastic mudstones to fine sandstones and have been interpreted as subtropical to tropical floodplain floras (MacGinitie et al. Reference MacGinitie, Leopold and Rohrer1974). Plant and insect herbivore damage censuses were conducted at four sublocalities, and all sites are within 0.5 km. We chose to make new collections, rather than use MacGinitie's, to ensure that our data were not biased against common species or leaves with insect herbivore damage.
EECO paleofloras in the Bighorn Basin are preserved in the uppermost Willwood Formation, which is well exposed along the south side of Fifteenmile Creek. Sedimentology, paleobotany, and insect herbivory have been described previously (Davies-Vollum and Wing Reference Davies-Vollum and Wing1998; Currano Reference Currano2009), and an age of 52.65 Ma has been assigned based on the presence of a dated tuff located 13 m below the fossiliferous unit (Smith et al. Reference Smith, Singer and Carroll2004; Currano Reference Currano2009). Lithology and depositional setting at Fifteenmile Creek are extremely similar to the WRI site, with interfingering subunits of sandstones, siltstones, and mudstones overlying a thick, laterally extensive carbonaceous shale (Davies-Vollum and Wing Reference Davies-Vollum and Wing1998; Currano Reference Currano2009). The best fossil leaves are preserved in silty claystones that we interpret as distal floodplain deposits formed during intervals of high sediment discharge. Currano (Reference Currano2009) conducted insect herbivore damage censuses at seven sublocalities across a total lateral distance of 0.21 km. However, non-dicot plant fossils were not included in this analysis, and so when comparing plant diversity and composition among sites, we also consider the paleobotanical censuses of Davies-Vollum and Wing (Reference Davies-Vollum and Wing1998), whose data include 11 sublocalities collected within 0.2 km of one another. Paleobotanical proxies for paleoclimate reconstructed a mean annual temperature of 22.2 ± 2°C (1 SE; Wing et al. Reference Wing, Bao, Koch, Huber, MacLeod and Wing2000) and a mean annual precipitation of 114 + 49/−34 cm (1 SE; Diefendorf et al. Reference Diefendorf, Freeman, Wing, Currano and Mueller2015).
Plant and Insect Damage Censuses.—At each site (WRI, WRE, and BH), plant and insect damage censuses were conducted at multiple sublocalities to capture a greater proportion of the regional species pool (Burnham et al. Reference Burnham, Wing and Parker1992; Currano Reference Currano2009; Ellis and Johnson Reference Ellis and Johnson2013) and to investigate floral heterogeneity across the landscape. All sites preserve fluvial systems in which sedimentary subunits interfinger, making it impossible to trace individual fossiliferous layers over long distances. It is unlikely that all sublocalities within a site represent the same forest stand, but we estimate the maximum possible age difference between sublocalities within a site to be ~3000 years, based on research at Fifteenmile Creek in the Bighorn Basin (Kraus and Aslan Reference Kraus and Aslan1993; Davies-Vollum and Wing Reference Davies-Vollum and Wing1998). This small amount of time averaging is useful for capturing more of the regional species pool. Importantly, paleofloras from all sublocalities within a site were collected from the same lithological regime to minimize, and possibly even eliminate, compositional change that may occur among paleofloras as a result of depositional environment.
At each sublocality, a bench quarry was excavated, and the fossiliferous layer was extracted in as large blocks as possible. The number of fossils extracted from each bench quarry varies based on accessibility of the fossiliferous horizon and density of well-preserved plant material. Foliage of ferns, conifers, and monocots at least 5 cm long were identified and counted as individuals in the plant census. Non-monocotyledonous angiosperm (referred to hereafter by the polyphyletic but useful term “dicot”) leaves or leaflets with 50% or more of the leaf tissue preserved were divided into morphotypes using the shape and venation characters of Ellis et al. (Reference Ellis, Daly, Hickey, Johnson, Mitchell, Wilf and Wing2009) and included in the plant census. Many morphotypes could not be assigned scientific names, but based on our own experiences studying living plants as well as published reports on the systematic value of leaf architecture (e.g., Hickey and Wolfe Reference Hickey and Wolfe1975; Doyle Reference Doyle2007), we feel that they represent real biological taxa and refer to both named species and unnamed morphotypes as morphospecies. We compared morphospecies across sites to ensure continuity in identification across space and time. Reproductive organs were not included in analyses because of uncertainty over which reproductive organs are associated with which leaves.
Dicot leaves were scored for insect herbivore damage according to Labandeira et al. (Reference Labandeira, Wilf, Johnson and Marsh2007). We restricted our herbivory work to dicots, because they are most frequently consumed by insects (Grubb et al. Reference Grubb, Jackson, Barberis, Bee, Coomes, Dominy, de la Fuente, Lucas, Metcalfe, Svenning, Turner and Vargas2008), and they have been well studied in the Paleogene Rocky Mountain basins (Wilf and Labandeira Reference Wilf and Labandeira1999; Wilf et al. Reference Wilf, Labandeira, Johnson, Coley and Cutter2001; Currano et al. Reference Currano, Labandeira and Wilf2010, Reference Currano, Laker, Flynn, Fogt, Stradtman and Wing2016). Leaf damage morphotypes (DTs) were grouped into the functional feeding groups (FFGs) of Labandeira et al. (Reference Labandeira, Wilf, Johnson and Marsh2007) as follows: hole feeding, margin feeding, skeletonization, surface feeding, mining galling, and piercing and sucking. We also observed oviposition scars and fungal or other pathogen damage. DTs were subdivided into generalized damage types, made by insects that eat many different plant species, and specialized damage types, made by insects that feed on a single or a few closely related plant species (e.g., galls and mines), as laid out in Labandeira et al. (Reference Labandeira, Wilf, Johnson and Marsh2007). Specialized damage is recognized through comparisons with extant specialized damage patterns and through recognition of damage patterns that are restricted to particular host-plant species (Labandeira et al. Reference Labandeira, Johnson and Wilf2002, Reference Labandeira, Wilf, Johnson and Marsh2007).
Voucher specimens are curated at the Denver Museum of Nature & Science (WRI specimens), the University of Wyoming Geological Museum (WRE specimens), and the National Museum of Natural History (BH specimens). Photographs and descriptions of all leaf morphospecies and floral and insect damage census data for the WRI and WRE sites are included in the Supplementary Material. Photos of all the specimens from WRI are archived at the Denver Museum of Nature & Science.
Data Analyses.—To determine whether differences among sites could be driven by differences in paleoclimate, mean annual temperature (MAT) and mean annual precipitation (MAP) were reconstructed at the WRI and WRE sites using the pooled sublocality data for each site. Leaf margin analysis (Wing and Greenwood Reference Wing and Greenwood1993) was used to estimate MAT; leaf area analysis (Wilf et al. Reference Wilf, Wing, Greenwood and Greenwood1998) was used to estimate MAP. Published reconstructions for the BH used an identical protocol (Wing et al. Reference Wing, Bao, Koch, Huber, MacLeod and Wing2000; Diefendorf et al. Reference Diefendorf, Freeman, Wing, Currano and Mueller2015).
Floral composition, diversity, and evenness were compared among sites considering two data sets—all plant morphospecies and only dicot morphospecies. The all-plant data set provides a comprehensive view of the landscape, whereas the dicot data set focuses on the vegetation most often consumed by insect herbivores (Grubb et al. Reference Grubb, Jackson, Barberis, Bee, Coomes, Dominy, de la Fuente, Lucas, Metcalfe, Svenning, Turner and Vargas2008). Variability in plant composition was analyzed by first calculating the relative abundance of each morphospecies and each major plant group (fern, conifer, monocot, dicot) in each sample. We then compared floristic composition among sublocalities using nonmetric multidimensional scaling (NMDS). Relative abundance data were arcsine square-root transformed to improve normality (Sokal and Rohlf Reference Sokal and Rohlf1995), and the metaMDS function was run (Bray-Curtis distances specified) to produce the NMDS ordinations. Only morphospecies that occur at more than one quarry were included in the analysis. Analysis of similarity (ANOSIM) was used to test whether sublocalities within a site are more similar to one another than to sublocalities from different sites.
Richness (the number of plant species in a sample) was tabulated for each sublocality and site, and rarefaction (function rarefy in R; RStudio v. 1.0.153) was used to standardize for sample size. Floral diversity was also examined using Simpson's D, which considers abundance data and therefore emphasizes common species over rare ones (Patzkowsky and Holland Reference Patzkowsky and Holland2007). Following Lande (Reference Lande1996), we partitioned total diversity at a site (WRI, WRE, or BH) into additive components that represent average diversity within a sublocality (α diversity) and among sublocality diversity (β diversity). We conducted this analysis using both species richness and Simpson's D, and we weighted all diversity measures by sample size. Evenness was calculated using Pielou's J.
We analyzed insect damage frequency, composition, and diversity on the bulk floras at each sublocality, and we pooled the data from sublocalities within a site to obtain values for each site. We also analyzed herbivory on each plant host with at least 20 specimens at a site. Damage frequency is the proportion of leaves in a sample with damage, and we calculated this for total and specialized insect damage. NMDS was used to visualize variation in damage composition across sublocalities and plant hosts, and ANOSIM to test the statistical significance of differences among sites. We used a matrix of the arcsine square-root transformed proportion of leaves in a sample (either at a sublocality or within a plant host) with each functional feeding group, Bray-Curtis distances, and R's metaMDS function. FFG data were used rather than DT data to increase the signal-to-noise ratio.
Damage richness is expressed as the number of DTs in a sample, which is highly dependent on the number of leaves observed (i.e., sample size). We standardized for sample size using an extension of Heck et al.’s (Reference Heck, van Belle and Simberloff1975) analytical rarefaction published by Gunkel and Wappler (Reference Gunkel and Wappler2015) that allows for leaves with no damage or with more than one DT per leaf. We generated rarefaction curves for total and specialized feeding damage diversity on the bulk floras at each sublocality and at each site, as well as for individual plant hosts. To test how important the addition of plant hosts at a site is to increasing overall DT diversity at each site, we used a variation of Lande's (Reference Lande1996) additive diversity analysis. In this scenario, α diversity represents the number of damage types observed on a plant host, β diversity is among host DT diversity, and γ diversity is the number of DTs observed at a site. Plant hosts were weighted by sample size in the calculations.
Results
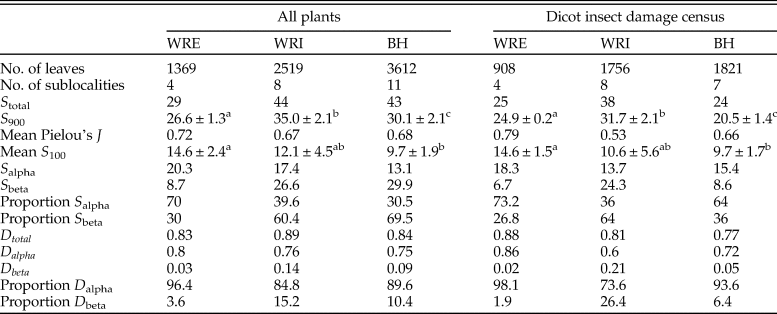
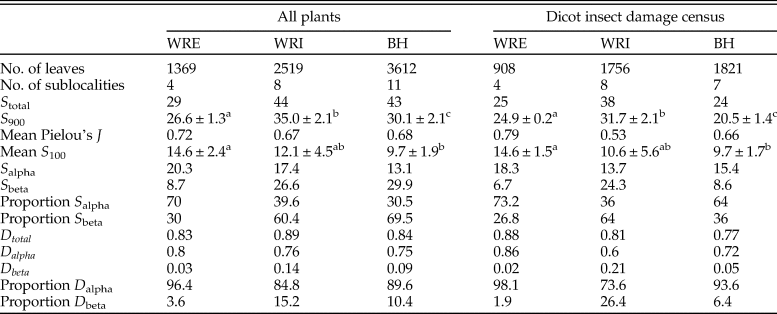
Flora.—In total, our analysis includes 2519 leaves (1756 dicots) from WRI, 1369 (908 dicots) from WRE, and 3612 (1821 dicots) from BH (Table 1). These samples capture 44 plant morphospecies (38 dicots) at WRI, 29 morphospecies (25 dicots) at WRE, and 43 morphospecies (24 dicots) at BH (Table 2). Paleoclimate reconstructions show MAT estimates above 20°C in the basin interior sites (20.4 ± 2.4°C at WRI and 22.2 ± 2°C at BH) and a lower temperature of 14.6 ± 3.0°C (1SE) at WRE (Table 1). Mean annual precipitation is not significantly different among sites and ranges from 114 (+49/−34, 1 SE) cm at BH to 154 (+66/−46, 1 SE) cm at WRI.
Table 1. Locality information for Early Eocene paleofloras in the Wind River (WRE and WRI) and Bighorn (BH) Basins, Wyoming, USA. GPS coordinates are available from the author pending consent of the Bureau of Land Management (WRI and BH) and U.S. Forest Service (WRE). *Davies-Vollum and Wing Reference Davies-Vollum and Wing1998; †Currano Reference Currano2009; ‡Wing et al. Reference Wing, Bao, Koch, Huber, MacLeod and Wing2000; §Diefendorf et al. Reference Diefendorf, Freeman, Wing, Currano and Mueller2015. MAP, mean annual precipitation; MAT, mean annual temperature.
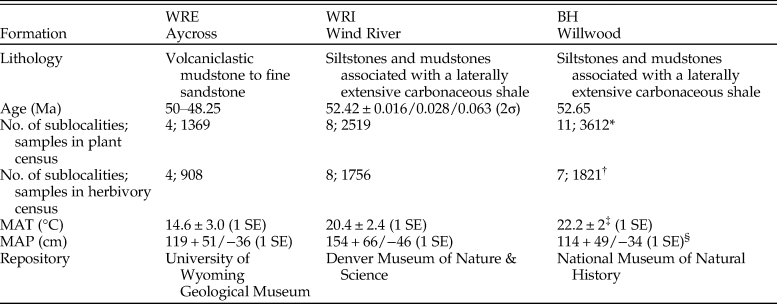
Table 2. Ecological parameters of fossil plant assemblages. S total is the number of plant species observed at each site (BH, WRI, and WRE); S 900 is γ richness observed at 900 specimens, calculated using analytical rarefaction, and standard errors were calculated according to Heck et al. (Reference Heck, van Belle and Simberloff1975); S 100 is average plant species richness at a sublocality, rarefied to 100 specimens, and the error reported is 1 SD; S alpha is within-sublocality plant species richness; S beta is among-sublocality plant species richness, calculated using Lande's additive diversity partitioning formula, with sublocalities weighted according to sample size; D total is Simpson's diversity index for each site; D alpha is within-sublocality Simpson's diversity index; D beta is among-sublocality Simpson's diversity index, calculated using Lande's additive diversity partitioning formula, with sublocalities weighted according to sample sizes. Sublocalities were weighted according to sample sizes in calculations of S alpha, S beta, D alpha, and D beta. Superscripts for diversity measurements of S 900 and mean S 100 denote whether error estimates overlap.
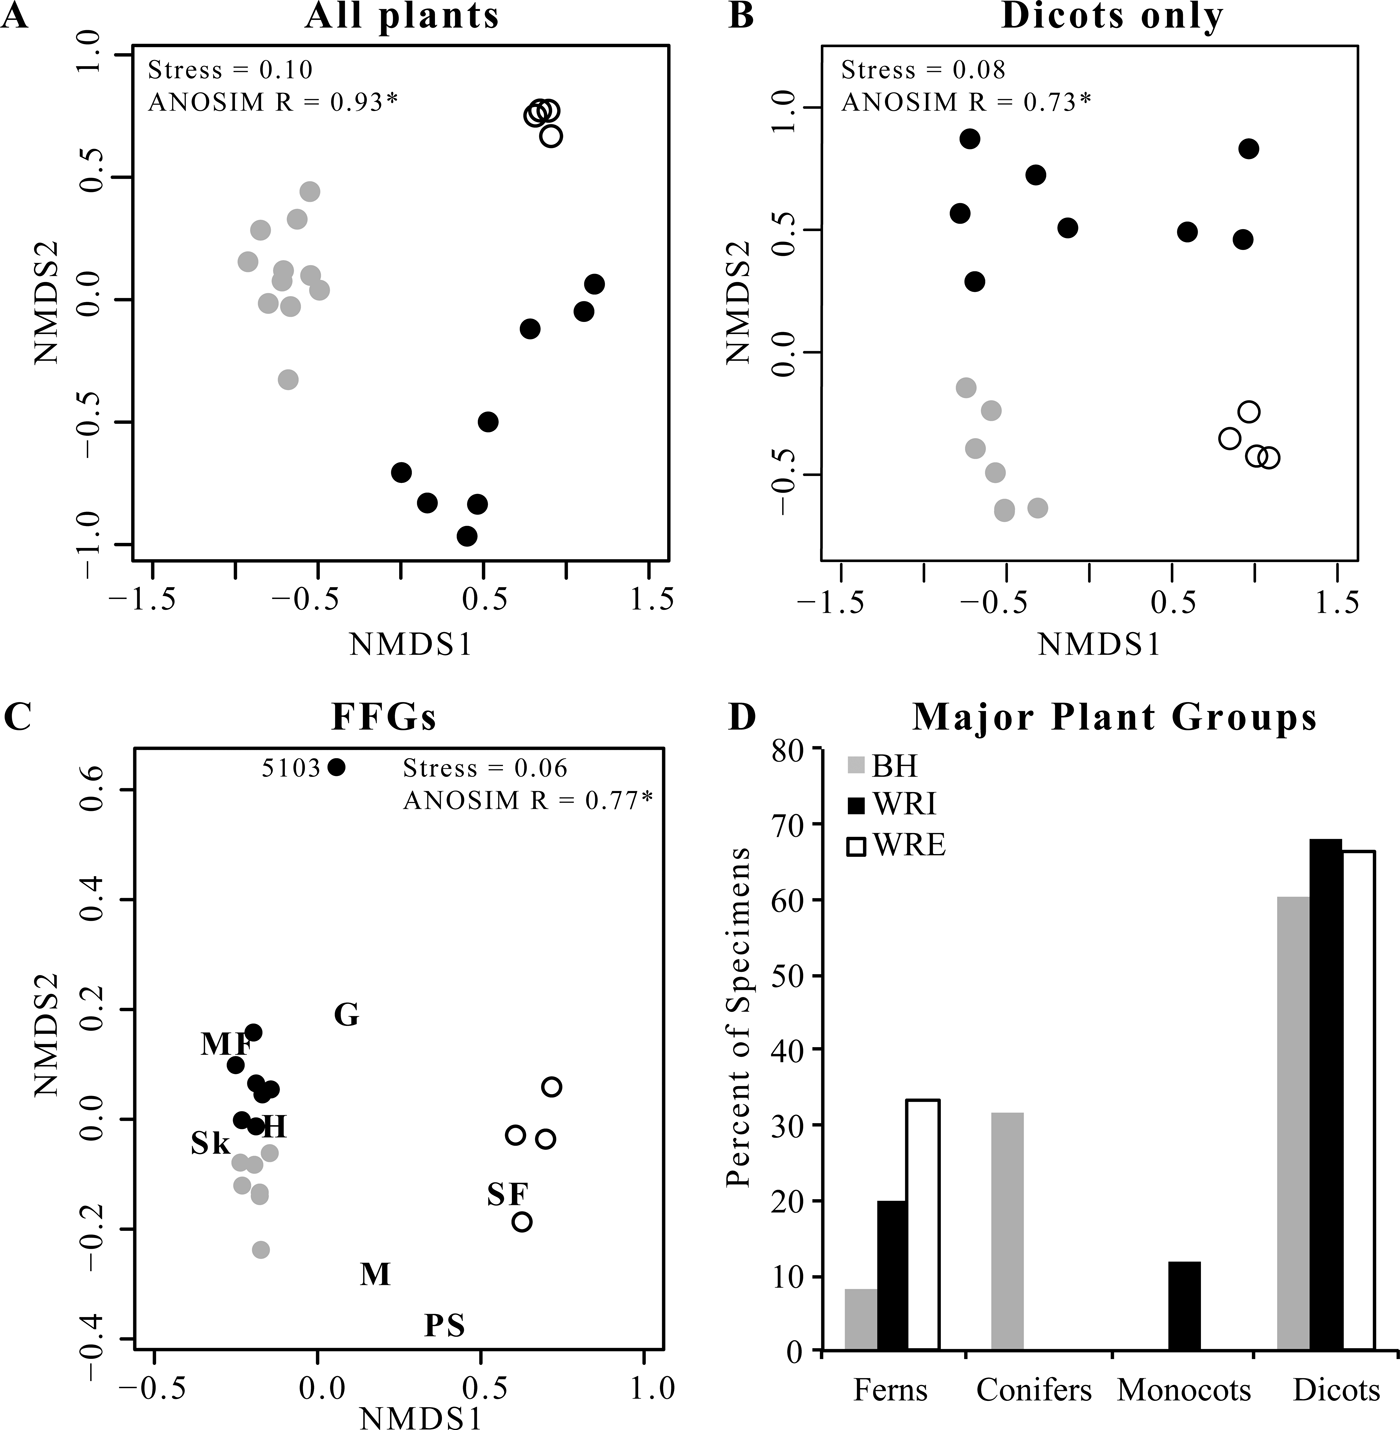
Floral composition at WRI, WRE, and BH differs significantly. Individual sublocalities plot in distinct site groups in the NMDS ordinations (Fig. 2A, B), and high ANOSIM scores confirm the significance of these groups. Of the 108 plant morphospecies in our data set, only 6 (horsetail Equisetum sp., ferns Lygodium kaulfussi and Thelypteris iddingsii, and dicots “Dicot III,” Platycarya castaneopsis, and Populus cinnamomoides) occur at all three sites. Both L. kaulfussi and “Dicot III” are in the top 10 most abundant morphospecies at all sites; P. cinnamomoides is in the top 10 at both WRE and WRI, and P. castaneopsis is in the top 10 at WRI and BH (Table 3). An additional six taxa occur at both Wind River Basin sites, the two basin interiors have three additional taxa in common, and two taxa are shared by WRE and BH. Six taxa that occur at WRE or WRI are known from other localities in the Bighorn Basin, including non-census sites that are stratigraphically equivalent to the Fifteenmile Creek flora or within a few meters of that stratigraphic level (Wing et al. Reference Wing, Alroy and Hickey1995; Wing and Currano Reference Wing and Currano2013); if we add these taxa to our comparisons, then dicots Canavalia diuturna and Platanites raynoldsii also occur in all three sites. At the major clade level, dicots make up greater than 60% of floral entities at all sites (Fig. 2D). The conifer Glyptostrobus europaeus dominates the BH assemblage, although its abundance varies greatly across the Fifteenmile Creek bed as a whole; conifers are absent at the two other sites. Monocots only occur in our data set at WRI and are represented by Zingiberopsis isonervosa and an unnamed Pandanaceous species. However, historic collections from Fifteenmile Creek (BH) and Kissinger Lakes (WRE) do include monocots (MacGinitie et al. Reference MacGinitie, Leopold and Rohrer1974; Wing et al. Reference Wing, Alroy and Hickey1995), and Z. isonervosa is abundant throughout the Paleocene and Eocene in the Bighorn Basin. Ferns are most abundant at WRE, where L. kaulfussi is the dominant taxa.
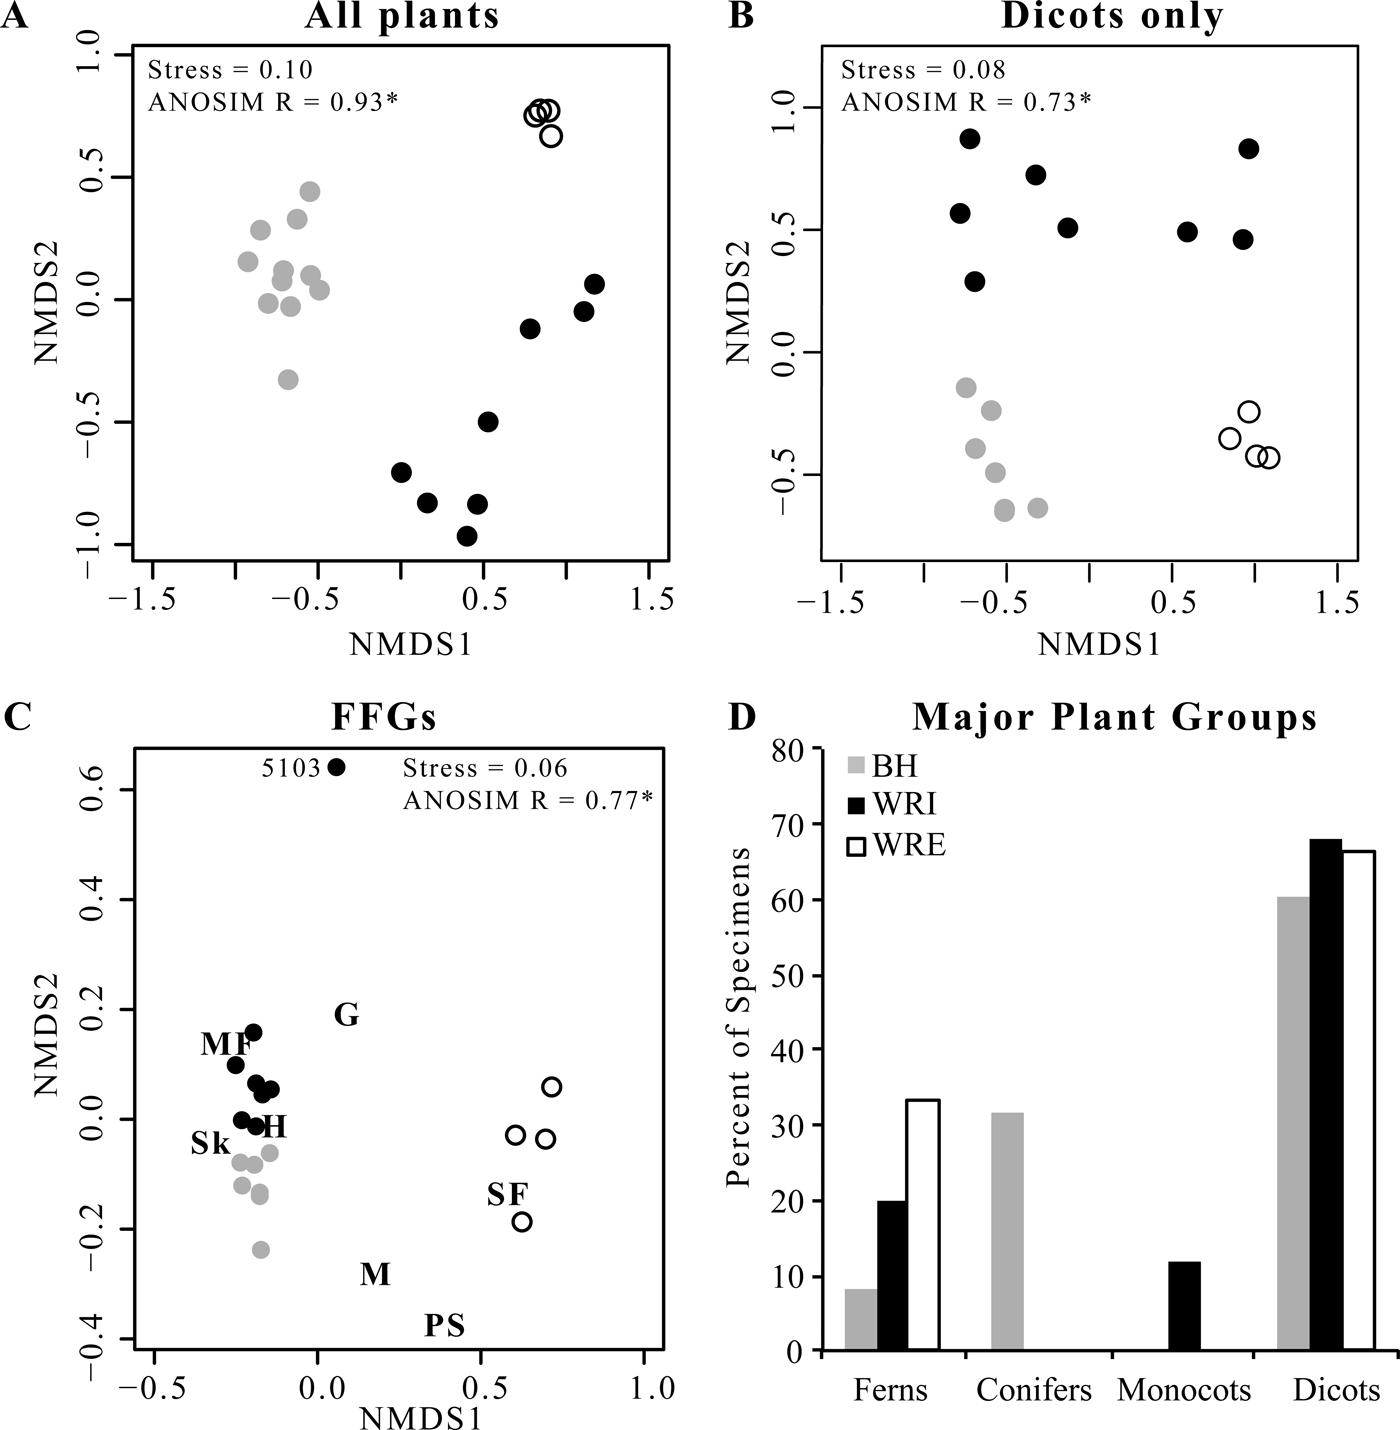
Figure 2. Plant and insect herbivore damage composition. A, Nonmetric multidimensional scaling ordination (NMDS) of plant composition at each quarry. B, NMDS ordination of dicot species composition at each quarry. C, NMDS ordination of functional feeding group (FFG) representation at each quarry. FFGs are hole feeding (H), margin feeding (MF), skeletonization (Sk), surface feeding (SF), galling (G), mining (M), and piercing and sucking (PS). D, Proportion of leaves at each site belonging to each major plant group. In all panels, gray symbols are from BH, black symbols from WRI, and open symbols from WRE.
Table 3. The 10 most frequent plant morphospecies from the Eocene localities of the Wind River Basin (WRE and WRI) and the Bighorn Basin (BH), Wyoming, USA. Bold type indicates morphospecies found at all three sites, and superscripts indicate another site at which a morphospecies occurs. Taxa marked BH* are known to occur in the Bighorn Basin but do not occur in the censused flora. BH morphospecies “Dicot III,” “Dicot XXXVI,” “Dicot XXXII,” and “Dicot X” are described in Wing (Reference Wing1981). All other unnamed morphospecies are described in the Supplementary Material.

Alpha diversity, or average diversity at a sublocality, is highest at WRE for both all-plant types and for dicots only, whether considering richness (mean S 100) or Simpson's D (Table 2). The difference in mean S 100 is significant for WRE versus BH but not for WRE versus WRI. All-plant mean S 100 is higher at WRI than at BH, although the 1σ error bars overlap, and the two sites have comparable mean all-plant D alpha. Dicot α richness is comparable at WRI and BH, and dicot mean D alpha is higher at BH than at WRI. In contrast to the α-diversity results, β diversity is lowest at WRE, both in terms of the number of taxa added and the proportion of γ diversity it comprises. WRI has high β richness for both all plants (60% of site-level richness) and for dicots only (64% of site-level richness), although the low-proportion D beta values (15% for all plants and 26% for dicots only) indicate that it is mostly rare species that vary among sublocalities. BH has the highest all-plant S beta but relatively low dicot-only D beta, indicating that conifers and ferns vary more among sublocalities than dicots do. As β diversity is related to differences in composition among sublocalities within a site, differences in β diversity among WRE, WRI, and BH are represented visually in the NMDS ordinations (Fig. 2A,B). The WRE sublocalities plot most closely, indicating the greatest compositional similarity and thereby the lowest β diversity; in contrast, WRI sublocalities occupy the greatest amount of compositional space, although they do not overlap with the BH or WRE sublocalities. Gamma diversity, or site-level diversity, is highest for all plant types at WRI, followed by BH and then WRE, and differences in richness are significant. Dicot γ diversity is higher at WRI and WRE than it is at BH, with WRI significantly higher in the rarefaction analyses and WRE slightly higher in Simpson's D.
Average all-plant evenness at a sublocality is similar at all three sites, whereas average dicot evenness varies considerably among sites (Table 2). WRE has the highest dicot evenness (J = 0.78) and WRI the lowest average dicot evenness (J = 0.53).
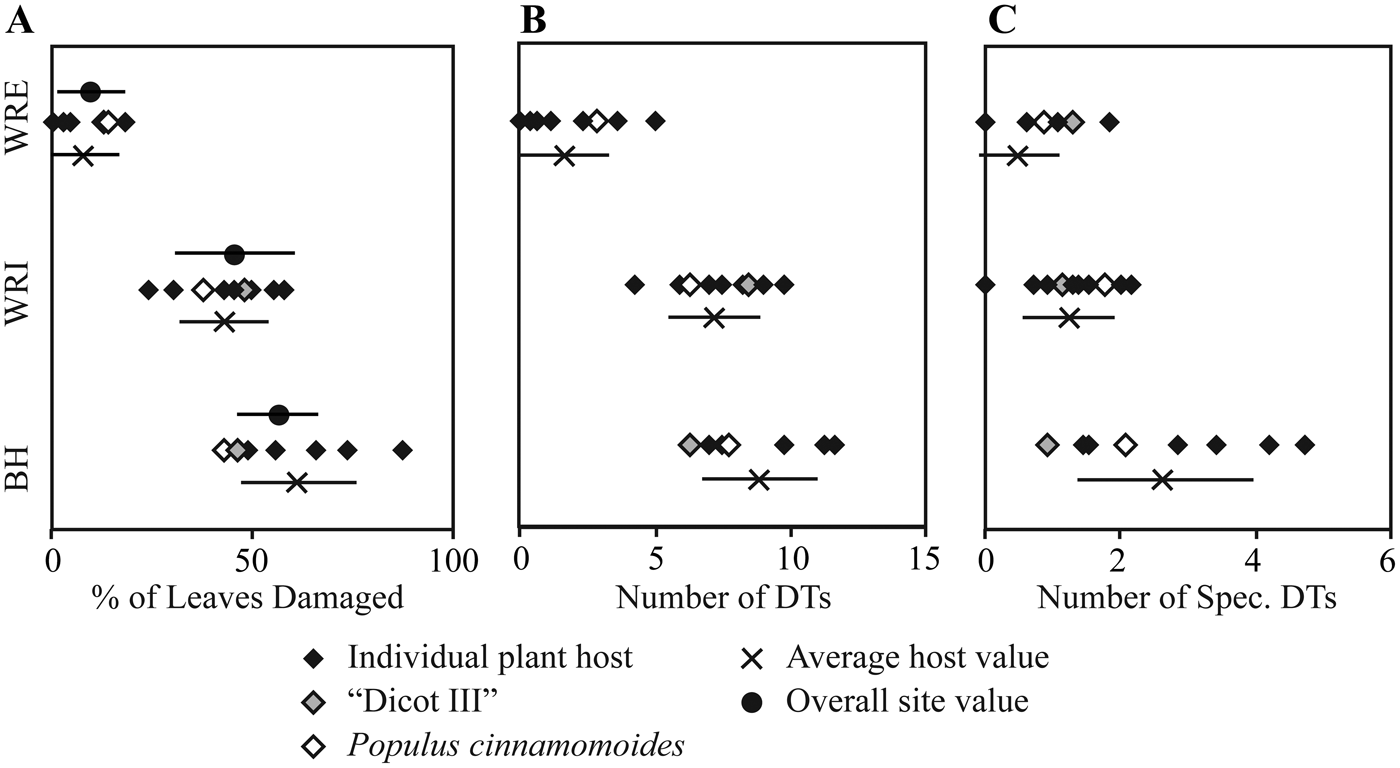
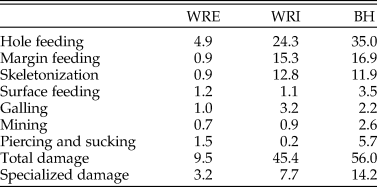
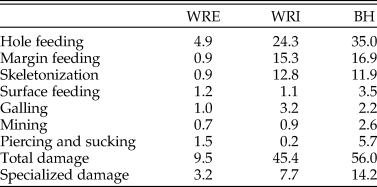
Dicot Leaf Feeding Damage.—Frequency of insect feeding damage is highly variable across the three sites. Insect herbivore damage was present on 9.5% of dicot leaves sampled from WRE, 45.4% from WRI, and 56.0% from BH (Table 4). This pattern of low damage frequency at WRE, intermediate damage frequency at WRI, and high damage frequency at BH is also observed if considering specialized feeding damage (Table 4) or total damage frequency on individual taxa (Fig. 3A). Hole feeding is the most prevalent FFG at all sites, followed by margin feeding and skeletonization at WRI and BH, and piercing and sucking and surface feeding at WRE (Table 4).
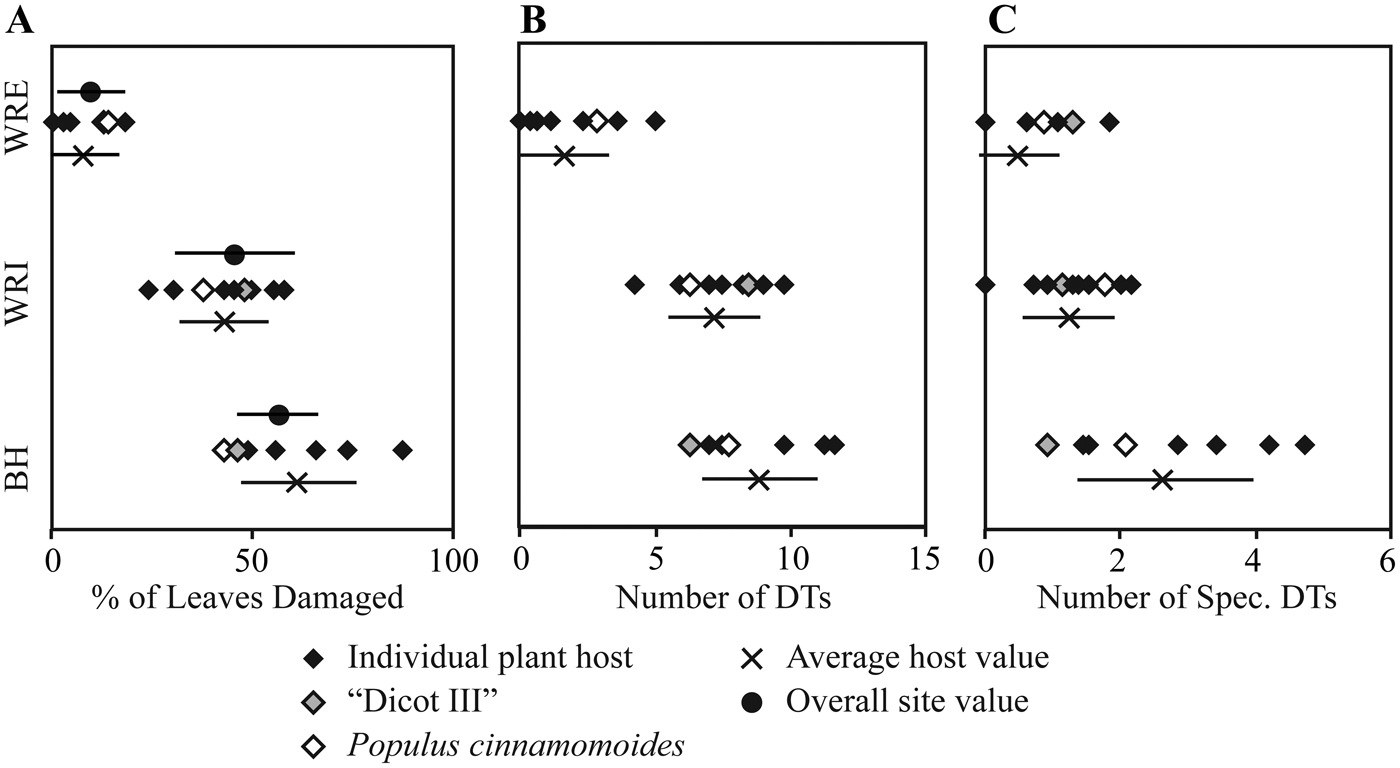
Figure 3. Insect herbivore damage frequency and diversity on individual plant hosts. A, Damage frequency; B, total damage diversity; C, specialized damage diversity.
Table 4. Percent of leaves with each functional feeding group, total damage, and specialized damage at each site.
Seventy insect herbivore damage types were observed in our study (Fig. 4). Fourteen DTs (20%) occur at all three sites, 12 occur at WRI and BH, 5 occur at WRE and BH, 4 occur at WRI and WRE, and 35 (50%) occur at only one site. The majority of DTs that occur at multiple sites are nondiagnostic (e.g., generalized hole or margin feeding DTs, nonspecific gall types), but there are highly specific DTs that occur on the same plant host in both the Wind River and Bighorn Basins. The best example of this is DT164 (Fig. 4E), a large and robust mine with distinct frass trail, on “Dombeya” novi-mundi at WRI and at a previously published site in the Bighorn Basin that is 54.2 Myr old and captures a cooler interval (reconstructed MAT of 11.1°C; Currano et al. Reference Currano, Labandeira and Wilf2010).
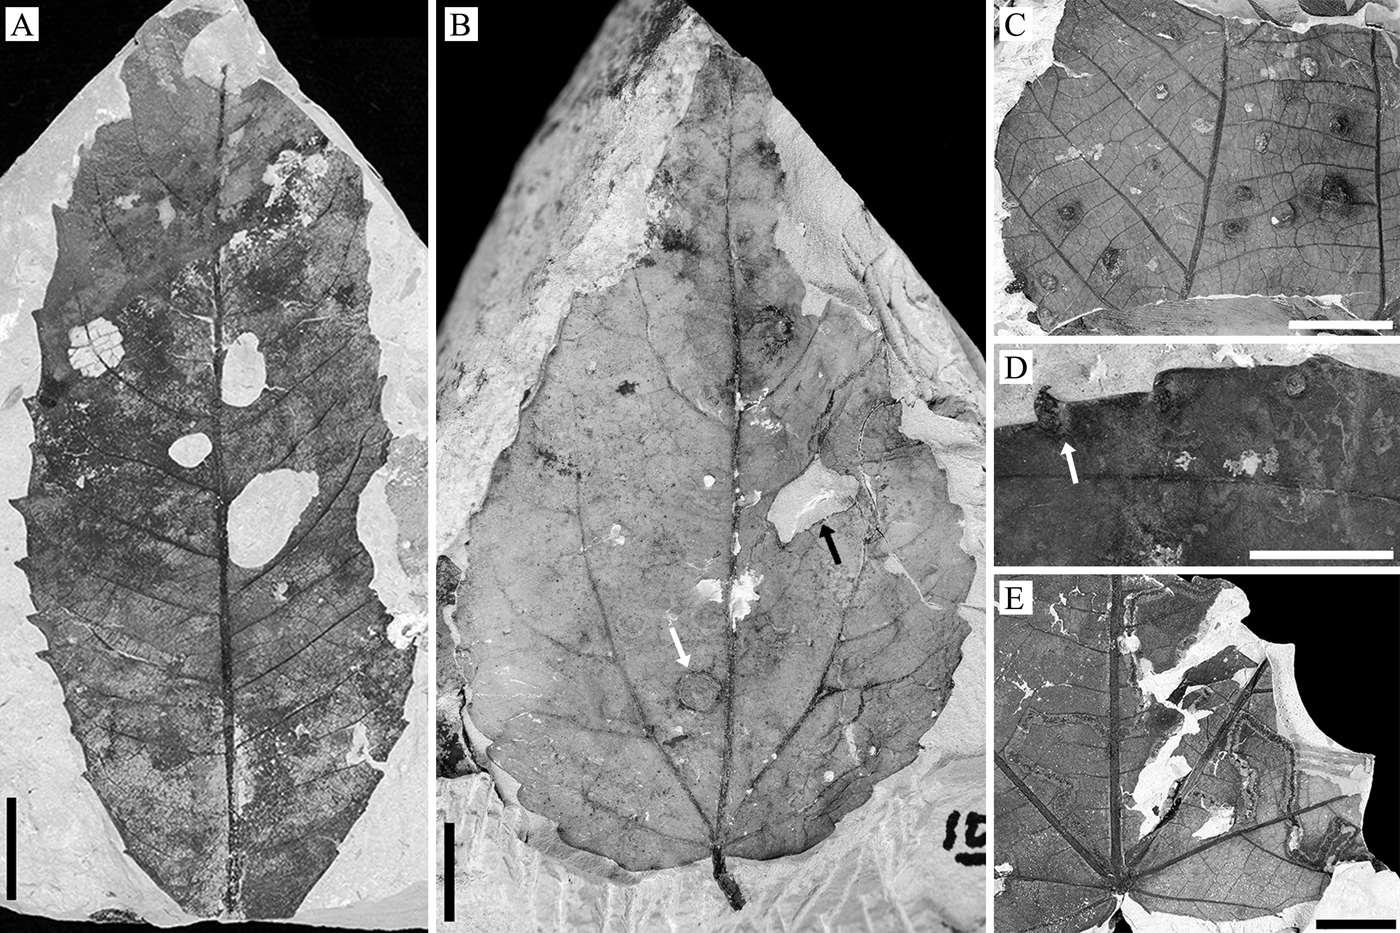
Figure 4. Examples of insect herbivore damage on the WRI flora. A, Large, circular holes (DT 4) and ovoidal skeletonization associated with a secondary vein (DT 24) on Platycarya castaneopsis (EPI.45344; loc. DMNH 5101). B, Blotch mine (white arrow; DT 35) and polylobate hole feeding (black arrow; DT 5) on Populus cinnamomoides (EPI.41640; loc. DMNH 5098). C, Globose, woody galls (DT 153) on “Dombeya” novi-mundi likely made by cynipid wasps (EPI.45420; loc. DMNH 5100). D, Globose, woody galls (white arrows; DT 153) on P. cinnamomoides likely made by cynipid wasps (EPI.45287; loc. DMNH 5102). E, Serpentine mine with thick outer rim and distinct frass trail (DT 164) on “Dombeya” novi-mundi likely made by beetle larvae in the family Buprestidae (EPI.45507; loc. DMNH 5100). Scale bars, 1 cm.
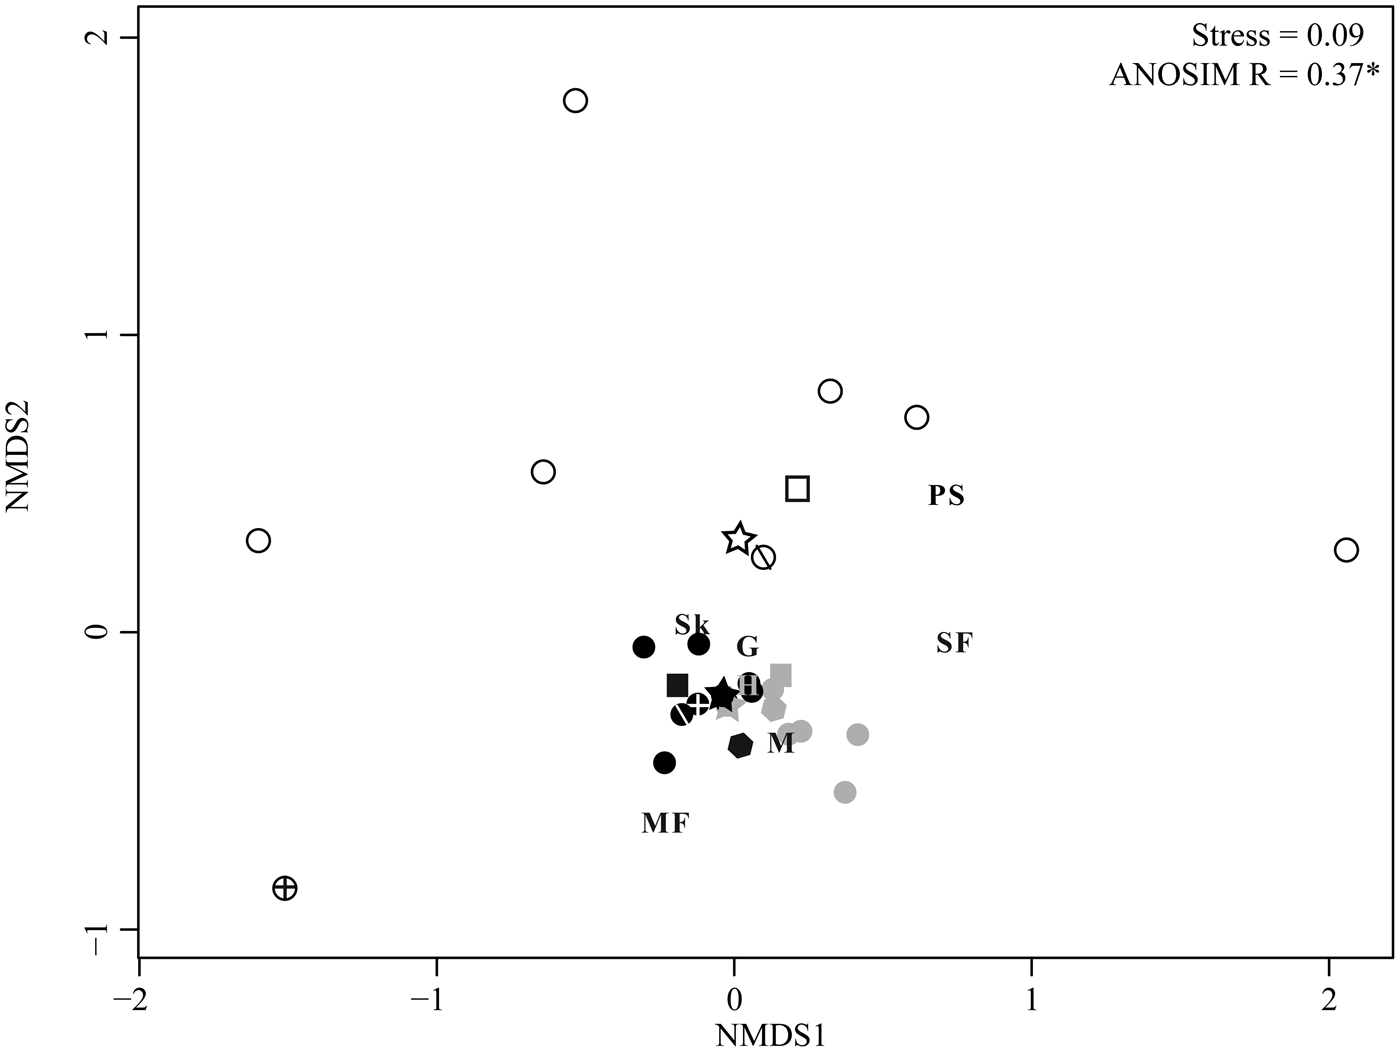
NMDS allows for additional comparison of herbivory across sites and among plant hosts. As in the ordinations of floral composition (Fig. 2A, B), an ordination of individual sublocalities by proportion of leaves with each FFG shows that the three sites form distinct groups (Fig. 2C; ANOSIM R = 0.77), and the WRI and BH groups are adjacent and of similar distance from the WRE group. WRI sublocality DMNH 5103 has no skeletonization, surface feeding, mining, or piercing and sucking, and plots alone with very high axis 2 scores. A similar pattern, although with a lower ANOSIM value (0.37), is observed when plant hosts are ordinated based on the proportion of leaves with each functional feeding group at each site (Fig. 5); hosts from WRI and BH are adjacent and form a tight cluster, and hosts from WRE are distant. Excluding DMNH 5103, sublocalities from the same site plot close to one another and indicate similar variations in herbivory among sublocalities at WRI, BH, and WRE. Comparisons of host plants that occur at more than one site allow the effect of taxon-specific defenses to be isolated from intersite differences in herbivory. The points for “Dicot III” at BH and at WRI plot nearly on top of each other, and “Dicot III” at WRE is the second closest (after Symplocos incondita) WRE taxon to the WRI–BH group. Similarly, the nearest point to WRI “Dombeya” novi-mundi is BH “Dombeya” novi-mundi. In contrast, WRI P. cinnamomoides does not plot adjacent to BH P. cinnaomoides. WRE P. cinnamomides has an axis 1 score that falls between the score for this taxon at WRI and BH, and its axis 2 score is similar to other WRE taxa.
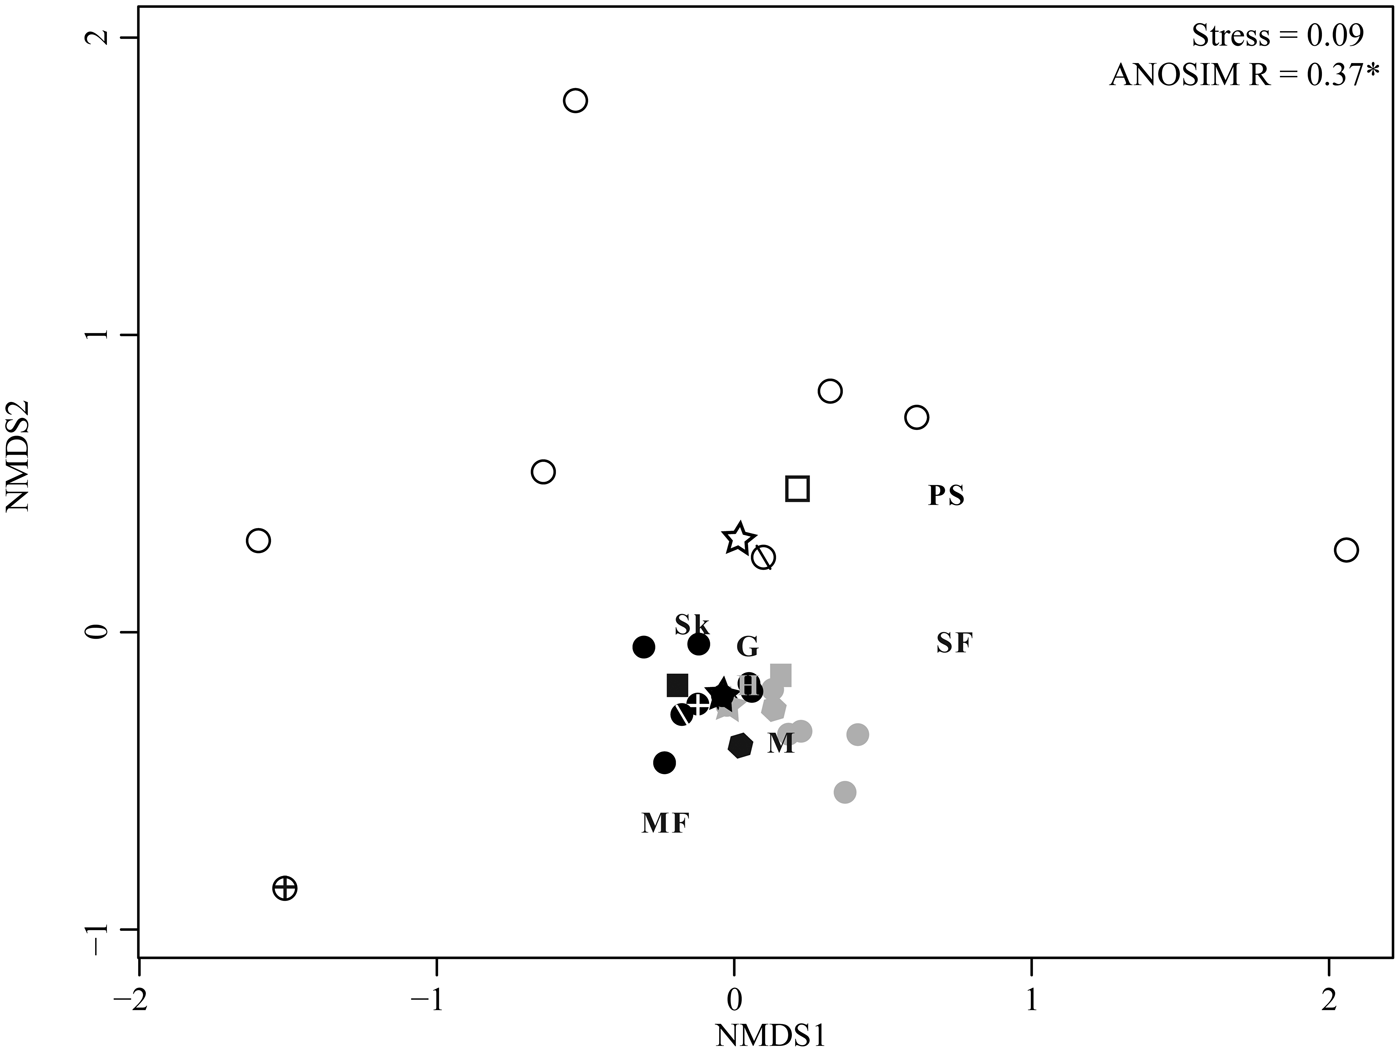
Figure 5. Nonmetric multidimensional scaling (NMDS) ordination of plant hosts by the proportion of leaves with each functional feeding group. All host plants with at least 20 leaves at a site are included in the analysis. Plant hosts are color coded by site; open symbols, WRE; black symbols, WRI; and gray symbols, BH. Plant hosts found at more than one site are given unique symbols: squares are Populus cinnamomoides, stars are “Dicot III,” hexagons are “Dombeya” novi-mundi, circles with crosses are Platanites raynoldsii, and circles with one diagonal line are Symplocos incondita. Functional feeding groups (FFGs) are hole feeding (H), margin feeding (MF), skeletonization (Sk), surface feeding (SF), galling (G), mining (M), and piercing and sucking (PS).
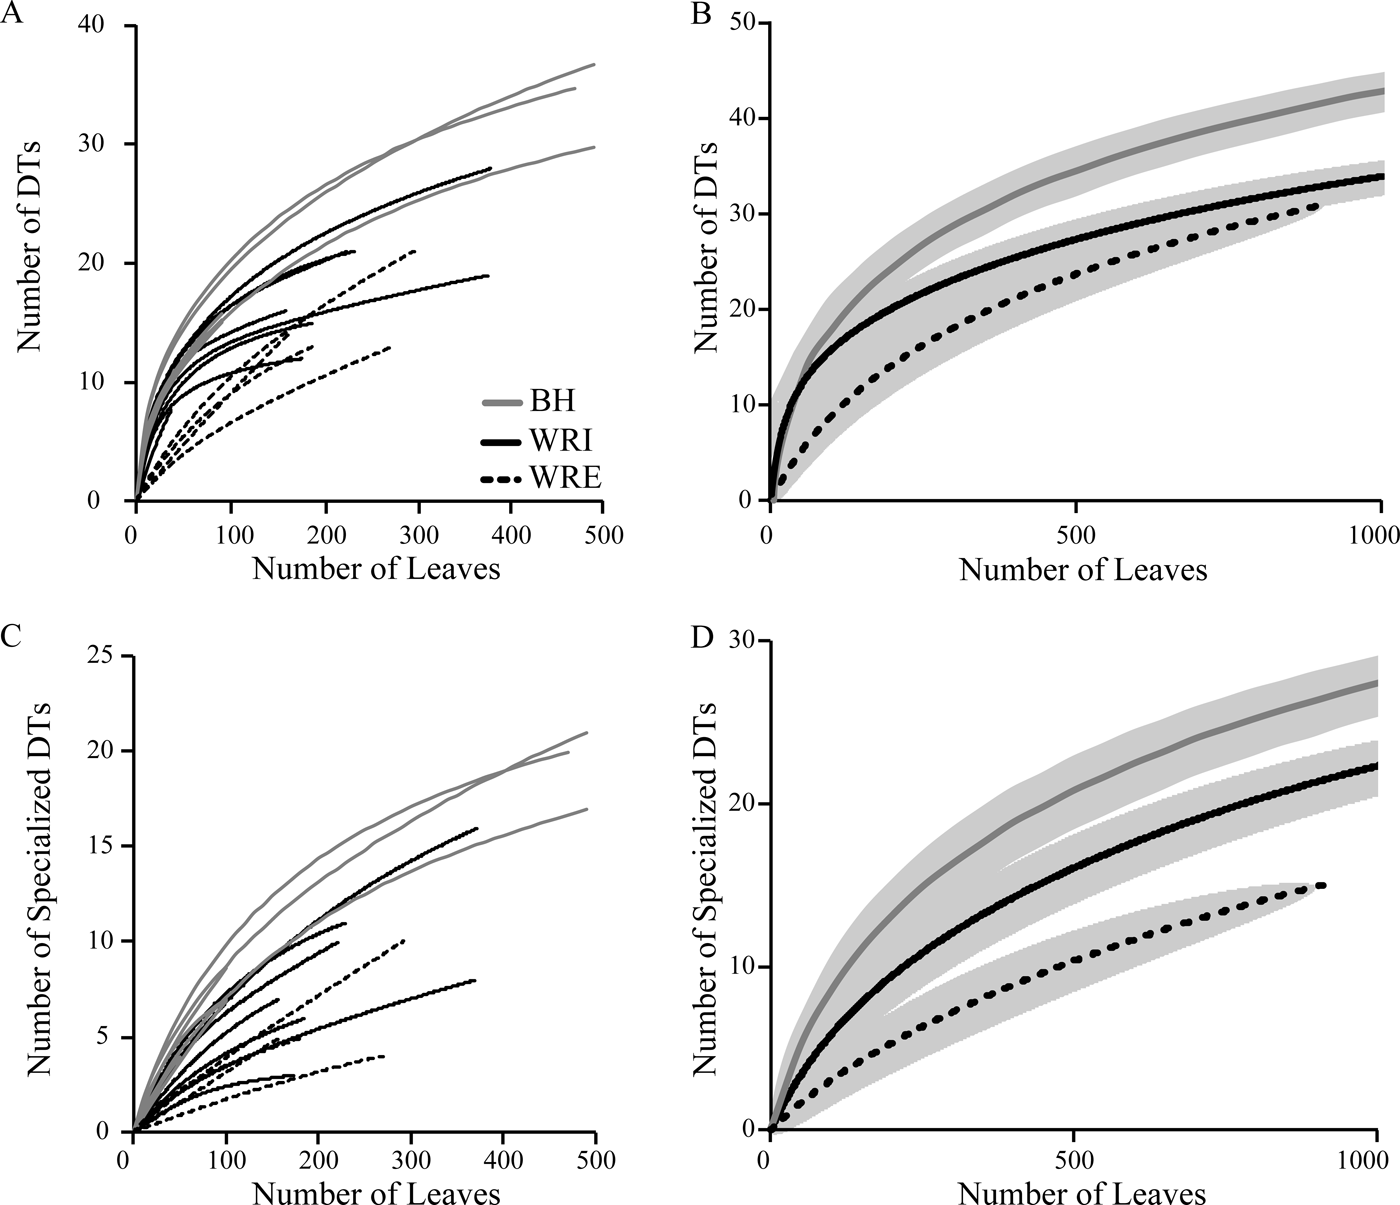
Total and specialized damage richness are highest at BH, followed by WRI and WRE (Fig. 6). All differences are significant, except for total damage diversity at WRI and WRE. With additional sampling, it is possible that the WRE total damage rarefaction curve will achieve higher values than the WRI curve. Total damage richness and specialized damage richness on an individual plant host, standardized to 20 leaves, are, on average, highest at BH and lowest at WRE, although only the difference between average host value for BH and WRE is significant (Fig. 3B, C). Plant taxa at BH show high variability in specialized damage richness; “Dicot III,” P. castaneopsis, “Dombeya” novi-mundi, and P. cinnaomoides have relatively low specialized damage richnesses comparable to taxa at WRI and WRE, whereas Alnus sp., Lauraceae sp. WW061, Allophylus flexifolia, and Aleurites fremontensis have the highest values observed. When we compare damage richness on the morphospecies P. cinnamomoides and “Dicot III,” the only taxa with more than 20 leaves at all three sites, we see different results. Total and specialized DT richness on P. cinnamomoides follows the same trend as that of the bulk floras: highest DT richness in the BH, followed by WRI and WRE (Fig. 3B, C). Total damage richness on “Dicot III” differs from the overall trend, as it is higher in the WRI than BH (Fig. 3B,C). Specialized damage richness on “Dicot III” is similar at all three sites.
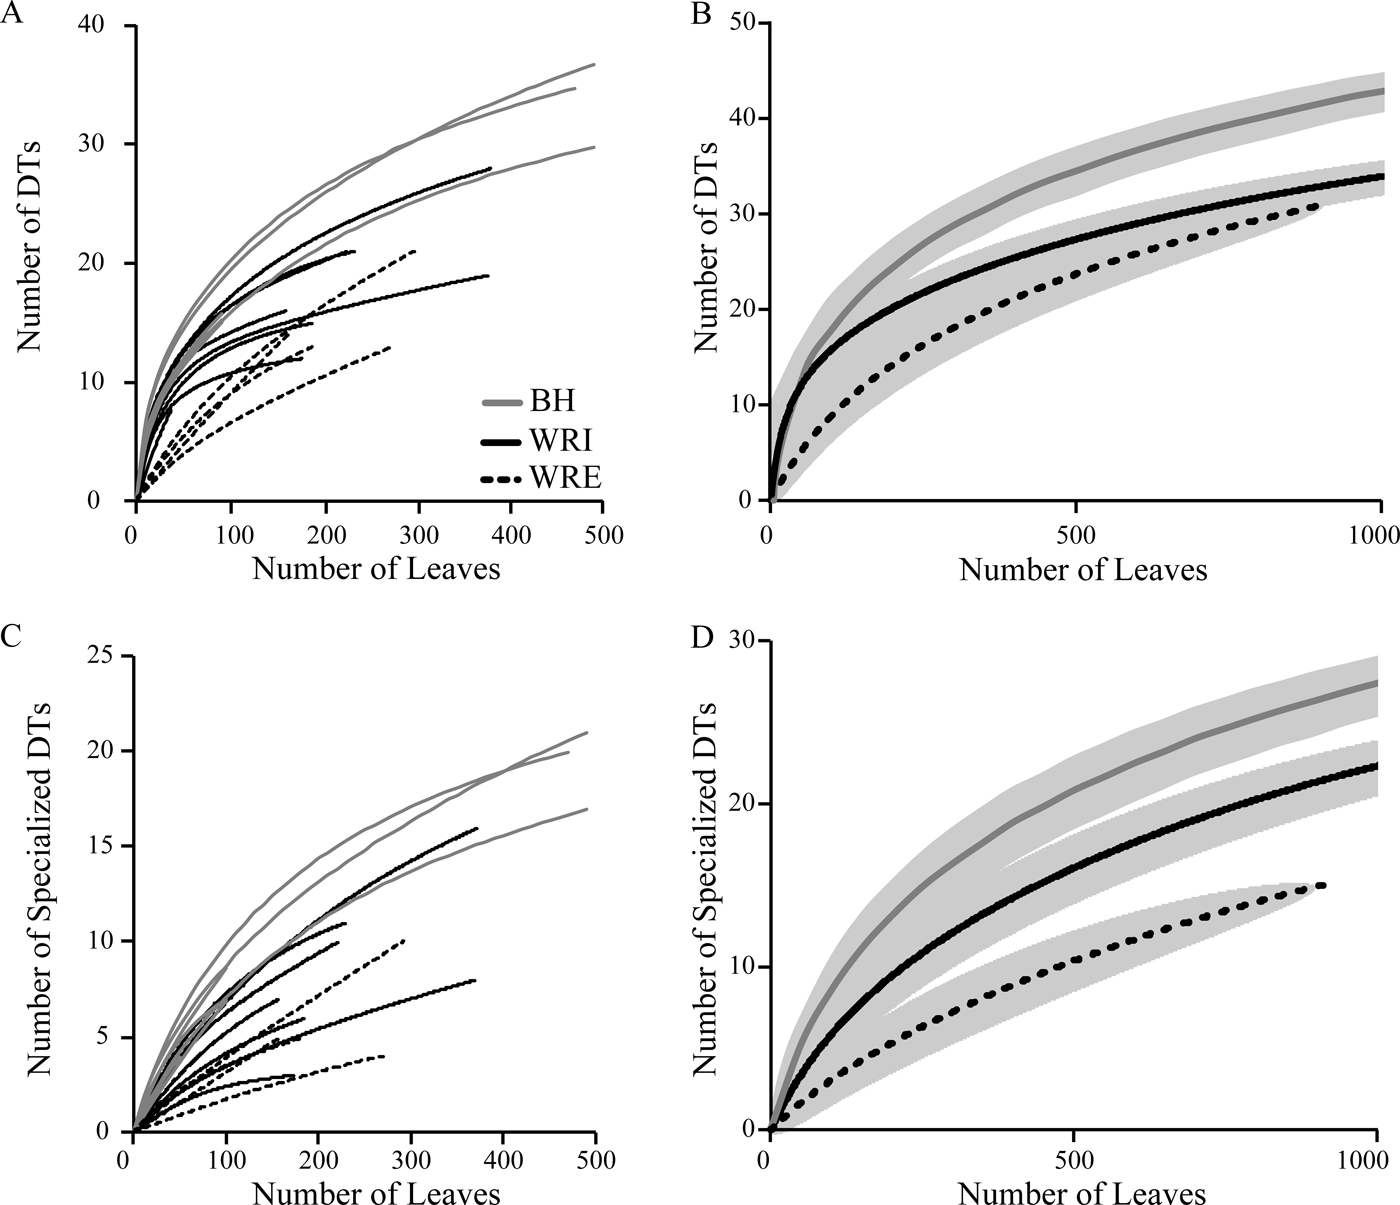
Figure 6. Rarefaction curves of total (A, B) and specialized (C, D) damage diversity. Curves in A and C represent individual sublocalities; pooled DT diversity at BH (gray), WRI (solid black), and WRE (dashed black) is shown in B and D. Gray shaded area indicates 1σ error bars.
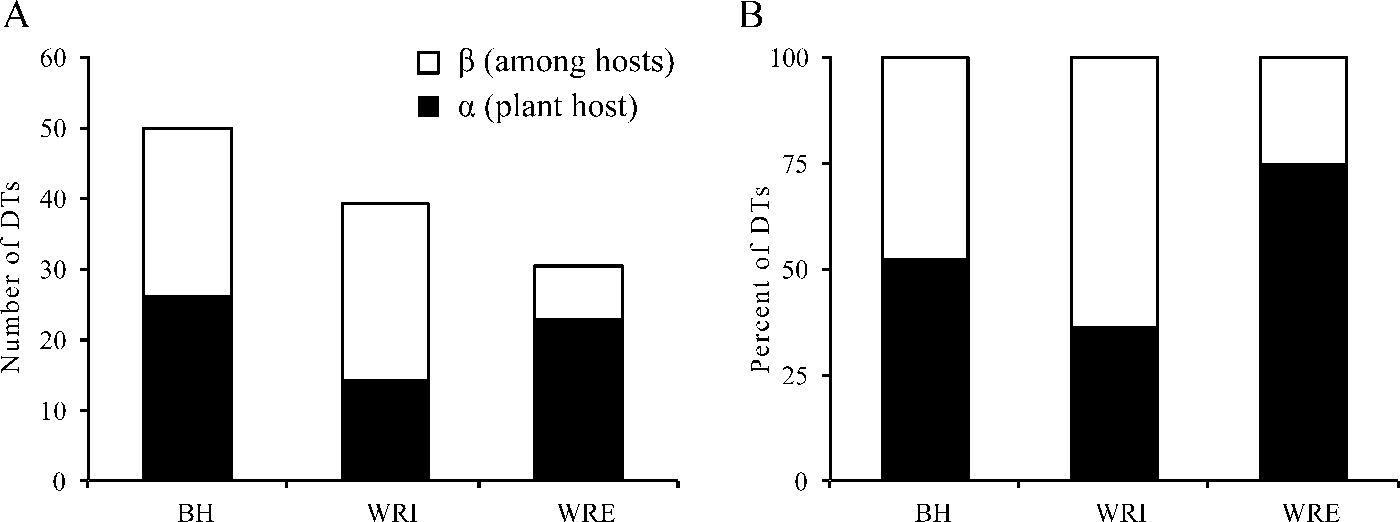
Our herbivory additive diversity analysis illustrates that adding plant hosts has a greater effect on site-level DT diversity at WRI than at any other site (Fig. 7). Beta DT diversity is slightly higher at WRI than at BH, and it comprises a greater percent of site-level DT diversity at WRI than any other site. Alpha and beta DT diversity are nearly equal at BH, and alpha DT diversity comprises about 74% of site-level DT diversity at WRE.
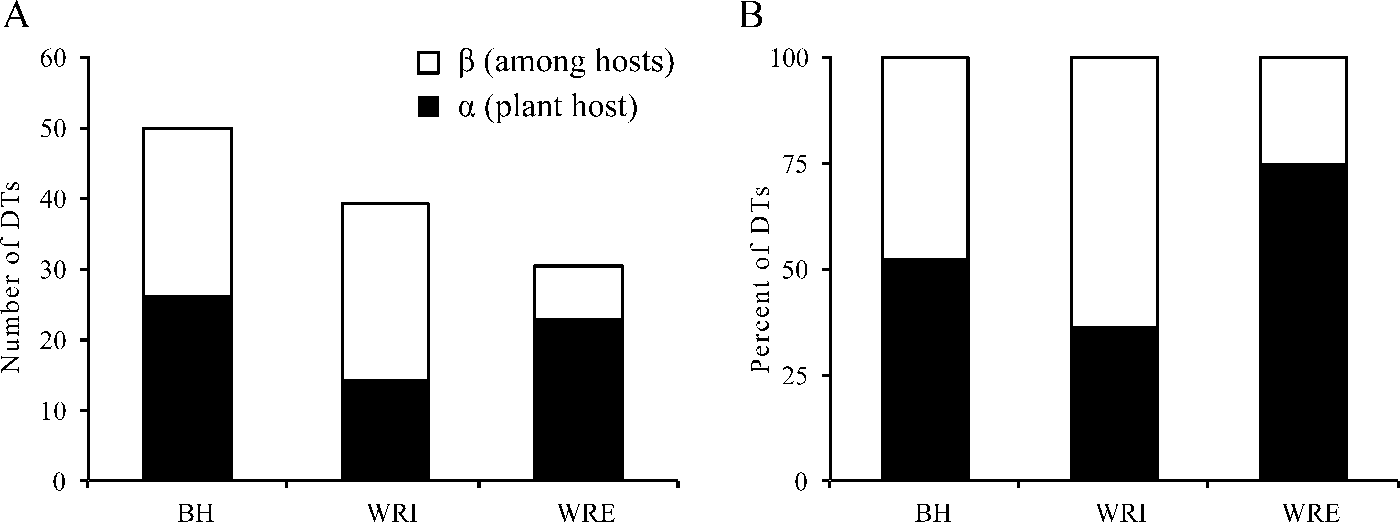
Figure 7. Additive diversity partitioning of damage morphotype (DT) diversity on plant hosts. A, DT richness; B, proportion of DT richness. Alpha diversity is the average number of DTs on a plant host, weighted by the sample size. Beta diversity is among host DT richness.
Discussion
Compositional Differences among Sites.—Plant and damage type (i.e., insect herbivore species) composition is highly variable across our study area. Just 5.6% of plant taxa occur at all three sites, 15.7% occur at more than one site, and 10.2% occur in both the Wind River and Bighorn Basins. Incorporating taxa known from other Bighorn Basin localities raises these to 7.4% occurring at all three sites, 21.3% at more than one site, and 15.7% in both basins (Supplementary Material). The use of insect damage data, rather than body fossils, makes it impossible to determine what percent of insect herbivore species occurs at more than one study site, and we suspect it was considerably lower than 50%, the percent of DTs found at more than one site. Insect herbivore composition may directly track plant species composition, as the majority of insect species display some degree of feeding specialization in response to the complex and diverse physical barriers, toxic chemicals, and recruitment of natural enemies employed by different plant species (Bernays and Chapman Reference Bernays and Chapman1994; Novotny et al. Reference Novotny, Drozd, Miller, Kulfan, Janda, Basset and Weiblen2006; Rasmann and Agrawal Reference Rasmann and Agrawal2009). Additionally, analysis of P. cinnamomoides demonstrates that different insect taxa consumed the same plant taxon across sites, although this is not consistent with analyses of “Dicot III” and “Dombeya” novi-mundi (Fig. 5).
Our sampling scheme of multiple, laterally spaced quarries that average a couple thousand years of time support large differences in regional species pools rather than differential capture of patchy landscapes. A future compilation of all known macrofossil data from the late Paleocene and early Eocene in the Bighorn and Wind River Basins will allow for further comparison of regional species pools in the three study areas, as will work on pollen and biomarkers, which are subject to different taphonomic biases and capture a greater spatial area than macrofossils. Additional work on the systematics of these floras will allow for a greater understanding of the ability of different plant groups to disperse over mountain ranges and among basins and for determination of whether particular lineages underwent radiations or extirpations within a specific basin.
Unfortunately, our floras are not exactly contemporaneous. If the WRE flora occurs at the top of the Aycross Formation (48.25 Ma), it may be as much as 4.4 Myr younger than the BH flora. A younger age for WRE would place it within the interval of cooling after the EECO and during an interval of pronounced faunal turnover in western North America (Woodburne et al. Reference Woodburne, Gunnell and Stucky2009). Our paleoclimate reconstructions indicate that MAT at the WRE site was at least 5°C cooler than at WRI or BH; it is unknown how much of this temperature difference is due to age versus elevation. Temperature has a critical influence on plant and insect distributions, and therefore it is unsurprising that WRE plant and insect herbivore communities would be distinct. Furthermore, abundant coal and carbonaceous shale deposits occur at WRI and BH but not at WRE. This suggests higher water availability and more water-logged soil conditions year-round in the basin interiors than along the basin margin. The dominance of L. kaulfussi at WRE further supports greater seasonality in water availability along the basin margin. This extant genus is most abundant in wet but not permanently inundated environments and displays high tolerance to a wide range of hydrological conditions (Volin et al. Reference Volin, Parent, Dreiss, Jose, Singh, Batish and Kohli2013). Alternatively, abundant L. kaulfussi at WRE might indicate more regular disturbances, as many modern species are opportunistic invaders capable of quickly colonizing canopy gaps and disturbed soils (Lynch et al. Reference Lynch, Chen, Brandt and Mazzotti2009). Finally, the sediments preserving macrofossils at WRE are more ash-rich than at WRI or BH and may represent a more instantaneous ashfall deposit. If leaves were stripped from the trees by ashfall, rather than dehiscing at the end of their leaf lifetime, then they may not have been subjected to an entire season of herbivory.
Differences between WRE and the two basin interior sites may be driven by varying ages, depositional environments, paleoclimate conditions, and/or taphonomic biases, but additional explanations must be sought to explain the unique distributions of plants and associated herbivores at BH and WRI. The BH and WRI floras are only ~200 kyr apart, certainly enough time for some floral turnover due to evolutionary processes and/or migration, but not for the extent of turnover observed here, especially given that both floras postdate known climate events like the ETM2 and H2 hyperthermals (Abels et al. Reference Abels, Clyde, Gingerich, Hilgen, Fricke, Bowen and Lourens2012). Furthermore, both floras occur in nearly identical lithologies and grew at very similar MAT and MAP levels. One possible environmental factor that may differ between these two sites is nutrient availability. The most abundant dicot taxon at BH is Alnus sp., a genus that today has a symbiotic association with nitrogen-fixing bacteria, increasing soil fertility and photosynthetic rates (Quispel Reference Quispel1954; Arnone and Gordon Reference Arnone and Gordon1990). Higher nitrogen availability at BH could support different, and more diverse, plant and insect herbivore communities. Alternatively, geographic isolation and barriers to migration may have been a powerful factor controlling species distributions during the EECO. As documented by Archibald and colleagues (Reference Archibald, Greenwood and Mathewes2013) for insect faunas in the early Eocene Okanagan Highlands, our study demonstrates high endemism in both plant (direct evidence) and insect (indirect evidence via herbivore damage) faunas in Wyoming. While site-specific environmental parameters could account for differences in species dominance between WRI and BH, it seems unlikely to explain the absence of locally abundant taxa at the other sites. The Owl Creek Mountains “appearing higher” during EECO warmth and acting as a topographic barrier to dispersal is a more likely explanation.
Our results reinforce the need to collect well-dated, high-resolution paleontological data from multiple basins to understand regional to continental patterns in biogeography and biodiversity during hothouse time intervals. The high endemism documented here suggests that the particular plant and insect herbivore taxa that occur and the precise timing of biotic turnover within a basin can vary greatly from basin to basin. However, high endemism during hothouse time intervals does not indicate that temporal or spatial patterns observed within a basin, such as the strong correlation between temperature and insect herbivore damage diversity in the Bighorn Basin (Currano et al. Reference Currano, Labandeira and Wilf2010), are unique to the basin in which they were documented. We further hypothesize that profound, global environmental perturbations like the Paleocene–Eocene thermal maximum or the Cretaceous–Paleogene bolide impact would have similar biotic effects in neighboring basins.
Diversity Patterns.—Significant differences in plant and insect damage diversity exist among our study sites, and interpretations of these may inform about ecological processes operating during the early Eocene hothouse. Previous research documented a strong, positive correlation between MAT and damage diversity and a significant positive correlation between MAT and damage frequency (e.g., Wilf and Labandeira Reference Wilf and Labandeira1999; Currano et al. Reference Currano, Labandeira and Wilf2010); our data set provides additional support for this pattern, as the WRE flora has the lowest total and specialized damage diversity and frequency. Somewhat surprisingly, damage richness does not appear to be affected by plant diversity (either all plant or dicots only). All plant γ richness is highest at WRI and lowest at WRE, and dicot γ richness is highest at WRI and lowest at BH (Table 2). In contrast, total richness and specialized DT richness are significantly higher at BH than at the other two sites. A more taxonomically diverse flora might be expected to have a greater variety of resources and support more insect herbivore species, and this pattern has been observed in some studies (Siemann et al. Reference Siemann, Tilman and Haarstad1996; Wright and Samways Reference Wright and Samways1998; Knops et al. Reference Knops, Tilman, Haddad, Naeem, Mitchell, Haarstad, Ritchie, Howe, Reich and Siemann1999) but not others (Bröse Reference Bröse2003; Hawkins and Porter Reference Hawkins and Porter2003; Currano et al. Reference Currano, Labandeira and Wilf2010). The absence of a significant correlation between plant and insect herbivore diversity could be due to the apparency, or conspicuousness, of dominant plant species to insects (following Feeny Reference Feeny, Wallace and Mansell1976), the importance of plant structural heterogeneity over taxonomic heterogeneity (Bröse Reference Bröse2003), variations in plant defenses (Currano et al. Reference Currano, Labandeira and Wilf2010), and different responses of plants and insects to environmental parameters (Hawkins and Porter Reference Hawkins and Porter2003; Currano et al. Reference Currano, Labandeira and Wilf2010). It is difficult to evaluate the latter three using fossils, but the influence of apparency can be tested. Considering plant hosts with at least 20 specimens in the dicot census, there is no relationship between a plant host's relative abundance in the dicot census and DT richness on that host, either when lumping all three sites together (R 2 < 0.01) or considering each site separately (all R 2 values are less than 0.06).
An alternate explanation for BH's high DT and low plant diversity is that the BH plant hosts were more palatable to insect herbivores than host plants at the other sites. Using the protocol of Royer et al. (Reference Royer, Sack, Wilf, Lusk, Jordan, Niinemets, Wright, Westoby, Cariglino, Coley, Cutter, Johnson, Labandeira, Moles, Palmer and Valladares2007), we reconstructed leaf mass per area (M A) for as many morphospecies as possible at WRI and BH (see the Supplementary Material for methods and full results). Not enough specimens at WRE had petiole attachments preserved to allow for meaningful results. Leaves with high M A tend to have longer leaf life spans and to be thicker and tougher, making them less palatable to insect herbivores (Royer et al. Reference Royer, Sack, Wilf, Lusk, Jordan, Niinemets, Wright, Westoby, Cariglino, Coley, Cutter, Johnson, Labandeira, Moles, Palmer and Valladares2007). The 13 morphospecies reconstructed at WRI range in M A from 58.3 g/m2 (P. raynoldsii) to 104 g/m2 (Dicot species WR010), with a mean of 87.7 g/m2 (95% prediction interval of 77.8–98.8 g/m2). The seven morphospecies reconstructed at BH have a range of 64.3 (Alnus sp.) to 115.4 (P. castaneopsis) and a mean of 81.4 g/m2 (95% prediction interval of 70.0–94.6 g/m2). Thus, there is no significant difference in M A between the two floras, suggesting similar palatability of the two floras. However, the BH flora is unique in its abundance of Alnus sp., whose symbiotic nitrogen-fixing bacteria may have produced higher nitrogen availability ecosystem-wide. More available nitrogen could support greater insect populations (Currano et al. Reference Currano, Laker, Flynn, Fogt, Stradtman and Wing2016) and potentially also greater diversity. We note that feeding on Alnus sp. itself is not responsible for the elevated DT richness at BH; when damage rarefactions were rerun without Alnus, BH remains significantly higher than WRI or WRE.
A second interesting result documented here is the difference in diversity partitioning among sites. The WRE site displays high α diversity but very low β diversity, and this pattern exists for all plants, dicots only, and DTs (where DT diversity partitioning refers to diversity on host taxa). In contrast, β diversity is an important component of γ diversity at WRI and BH. The basin margin likely represents a somewhat different environment from the basin interior, as evidenced by the lower MAT reconstruction as well as lithological differences. The abundance of L. kaulfussi in the WRE also suggests a regime of more frequent disturbances at WRE compared with WRI and BH. Longer time between disturbances would allow time for long-lived successors to replace early pioneers and for species differences to accumulate across the landscape as this process occurs.
Conclusion
Our data set of 7500 fossil leaves, including 4485 fossil dicot leaves scored for insect herbivore damage, documents significant variability in early Eocene plant and insect herbivore composition and diversity between the Bighorn and Wind River Basins. Biotic differences between the WRE site and the basin interior sites are likely due to age and paleoenvironmental differences, whereas differences between BH and WRI plant and insect communities are more likely driven by environmental variables not easily measured in the fossil record (e.g., nutrient availability) or by the presence of the Owl Creek Mountains, a potentially significant topographic barrier to species migration. Given the indication of subtropical conditions in the Wind River and Bighorn Basins at the EECO, our data support Janzen's hypothesis that mountain passes appear higher in tropical environments both in the present and the past. Future study of pollen and biomarkers, which preserve a more regional signal than macrofossils, as well as a temporally and spatially expanded leaf macrofossil record for the Wind River Basin will allow further documentation of endemism in Wyoming plant and insect herbivore communities during the early Eocene hothouse.
Acknowledgments
We thank S. Wing for many, many years of discussions and inspiration and for comments on this article. The fossil sites are located on land presently managed by the Bureau of Land Management (BH and WRI) and the U.S. Forest Service (WRE) and are part of the ancestral home of the Eastern Shoshone people. We thank all for their stewardship of these lands. We are grateful to J. Hannon, W. Harrison, A. Jijina, and K. Schlanser for being such enthusiastic field assistants; to T. Wappler for the R code used to conduct the insect damage diversity analyses; and to S. Fanning for help with photography. S. Manchester helped us locate the WRE site, and M. Smith provided our age estimate for the Aycross Formation. The new radiometric date was acquired with financial and laboratory support from S. Bowring. The ideas and research agenda presented here also benefited from discussions with C. Labandeira, M. Patzkowsky, and P. Wilf. D. Peppe and J. Huntley provided constructive reviews that improved this article. This research was supported by a research fellowship to E.R.S.P. from the Conselho Nacional de Desenvolvimento Científico e Tecnológico of Brazil (CNPq; 32656/2014-2), National Science Foundation (NSF) EAR 145031 and Miami University funding to E.D.C., and NSF EAR 0643158 to S. Bowring.
List of Supplemental Material Posted on Dryad
1. U-Pb geochronology methods and data.
2. Wind River Basin morphospecies descriptions.
3. Wind River Basin floral census data.
4. Plant occurrences compared among study sites.
5. Leaf mass per area reconstructions.
6. Wind River Basin insect damage census data.

