Clinoptilolite (CLI) is a naturally occurring microporous zeolite that belongs to the heulandite (HEU) group (Hernández et al., Reference Hernández, Rojas and Lara2000). Its structure is built of interchanging ten- and eight-member rings that form two parallel channels, intersecting with an eight-member ring. The secondary building units forming the two-dimensional system of the channel in CLI/HEU are 4-4-1. The CLI structure consists of [SiO4] and [AlO4] tetrahedra and has a Si/Al ratio of 4.0–5.2. This results in an unbalanced negative charge of the zeolite structure, which is compensated by cations such as Na+, K+, Ca2+ and Mg2+.
Clinoptilolite belongs to C2/m space group with unit-cell parameters a = 17.523 Å, b = 17.644 Å and c = 7.401 Å (http://europe.iza-structure.org). Crystallographic studies (Stolz et al., Reference Stolz, Yang and Armbruster2000; Armbruster et al., Reference Armbruster, Simoncic, Döbelin, Malsy and Yang2003) on the locations of other cations in zeolites belonging to HEU group of minerals showed that these materials might exchange cations. Several additional extra-framework cations were identified for cation-exchanged samples (e.g. Ag+, Pb2+, Cd2+, Ba2+, Rb+, Zn2+, Cu2+, Co2+, Ni2+ or NH4+). Studies on CLI show its efficacy as a sorbent for the removal of dyes (Qiu et al. Reference Qiu, Qian, Xu, Wu and Wang2009; Hernández-Montoya et al., Reference Hernández-Montoya, Pérez-Cruz, Mendoza-Castillo, Moreno-Virgen and Bonilla-Petriciolet2013) as well as heavy metals (Mozgawa et al., Reference Mozgawa, Król and Pichór2009; Jovanović et al., Reference Jovanović, Nevenka and Obradovic2012).
Rich deposits of natural CLI may be used to obtain attractive sorption materials (Karakaya et al., Reference Karakaya, Karakaya and Yavuz2017). The crystalline framework of CLI has a high ion exchange capacity. To improve the sorption properties of zeolites, their structure may be modified via desilication or dealumination processes (Cakicioglu-Ozkan & Ulku, Reference Cakicioglu-Ozkan and Ulku2005). Zeolite treated with HCl acid showed good sorption of water vapour, although the selected concentration of HCl solution and temperature proved ineffective for removing sodium and potassium cations. Lin et al. (Reference Lin, Liu, Dong, He and Wang2015) investigated the physicochemical properties of desilicated CLI. The modification with alkaline solutions increased mesopore formation and improved cation-exchange properties. It was considered that the NaOH modification mechanism based mainly on the removal of silicon increased the proportion of mesopores.
In summary, CLI was previously exposed to acids and bases (Garcia-Basabe et al., Reference Garcia-Basabe, Rodriguez-Iznaga, Menorval, Llewellyn, Maurin, Lewis, Binions, Autie and Ruiz-Salvador2010). The aim of the present study was to analyse the changes in the mineralogical and physicochemical properties of natural CLI subjected to desilication, dealumination and a combination of both treatments. It is very important to obtain a sorbent with a large specific surface area and mesoporous structure.
The material used is characterized by a low Si/Al ratio and requires a controlled process of dealumination. The modification conditions were selected to minimize the loss of crystal order and porosity while obtaining a hierarchical material with potential catalytic and sorption properties. Special attention was paid to the role of Al content in the modified CLI samples. The selection of appropriate modification parameters allows a hierarchical material characterized by improved specific surface area and mesoporous structure to be obtained.
Materials
Materials preparation
Natural CLI (Ca,K-CLI, Si/Al = 4.9) from the Carpathian Sokirnica deposit was used in the study. The zeolite was modified with: (1) 0.5, 1.0 and 1.5 M NaOH solutions; (2) 0.3, 0.6 and 0.9 M HNO3 solutions; and (3) a combination of methods (1) and (2). The treatment involved the reaction of 3 g of zeolite with 100 mL of the modification agent (MA) with a given concentration in a round-bottomed flask at 65°C in an oil bath. After the appropriate time, samples were filtered and washed with distilled water. Finally, both the parent (Ca,K-CLI) sample and modified samples were subjected to a threefold ion exchange with 0.5 M NH4NO3 solution at 60°C for 1 h. Afterwards, the samples were filtered, washed and dried at room temperature. The conditions of modification of the samples are presented in Table 1.
Table 1. Summary of zeolite samples with the analytical procedure for material modification.
Methods
X-ray diffraction (XRD) analyses were carried out on an X'Pert (PANalytical) diffractometer using Cu-Kα radiation in the range 5–90°2θ. Crystallographic data were determined using the Rietveld method (a, b and c parameters of the unit cell). In addition, the degrees of crystal order (percentages of crystal order) of the modified samples were determined according to the following equation: crystal order (%) = (sum of total sample intensity / sum of total intensity of original zeolite) × 100. Only well-separated signals (marked in Fig. 1) were taken for estimation of the crystal order of the samples. The (hkl) indices used were (020), (200), ( $\bar 2$01), (111), (
 $\bar 3$11), (400), (011), (111), (113), (
 $\bar 4$22), (11
 $\bar 3$) and (440).
Fig. 1. (a,b) XRD patterns of modified clinoptilolite analogues.
An X-ray fluorescence (XRF) spectrometer (WDXRF, Axios Max 4 kW, PANalytical) was used to determine the chemical composition of the parent zeolite material and its modified counterparts. In addition, the Si/Al ratios of the materials analysed were determined. The chemical compositions of all of the formulations are listed in Table 2.
Table 2. Chemical composition of the original Ca,K-CLI material (wt.%).

Textural parameters of CLI samples were determined by N2 adsorption/desorption at –196°C (NOVA 1200E, Quantachrome Instruments). The samples were degassed under vacuum for 12 h. The data collected allowed information on the total volume of pores (V total), volume of micropores (V micro) and volume of mesopores (V meso) to be obtained. The V micro was determined using the t-plot method. The V total was estimated by converting the volume of adsorbed nitrogen at p/p 0 = 0.98 into the volume of liquid adsorbate. The V meso was determined using the adsorption isotherm of Barrett–Joyner–Halenda (BJH).
The morphology and chemistry of carbon-coated CLI samples were determined by scanning electron microscopy (SEM) using an FEI Nova NanoSEM 200. Fourier-transform infrared (FTIR) spectra of the samples were collected with a vacuum Bruker VERTEX 70 FTIR spectrometer using the KBr pellet method. The spectra were the averages of 128 scans recorded in the mid-infrared range (MIR) with a resolution of 4 cm–1. The thermal stability of CLI was determined by differential thermogravimetry (DTG) using an STA 449 F1 Jupiter (Netzsch) thermal analyser. A total of 60 mg of the sample was placed in a platinum crucible and heated to 900°C with a heating rate of 10°C/min in air flow.
Results and discussion
The Ca,K-CLI XRD traces of the original, the ammonium form (CLI_1) and the modified CLI samples are shown in Fig. 1. The XRD traces of the original sample and its modified analogues are typical of CLI (Alver et al., Reference Alver, Sakizci and Yorukoğullari2011). The ion exchange of NH4+ by Ca2+ and K+ ions did not modify the XRD traces.
The modification of the zeolite with alkaline and acid solutions yielded slight disorders of the crystalline structure, which suggests that the stability of the natural CLI might have been disrupted. In order to determine the influence of the desilication and dealumination processes on the structure, the unit-cell parameters were calculated (Table 3) based on the XRD patterns and Bragg's equation. Treatment of the zeolite with acid results in hydrolysis of some –O–Al–O– bonds (Dziedzicka et al., Reference Dziedzicka, Sulikowski and Ruggiero-Mikołajczyk2015). Rapid aluminium extraction may lead to partial or total loss of zeolite crystal order (Datka et al., Reference Datka, Klinowski and Sulikowski1994). The change in crystal order and unit-cell parameters of the CLI modified with HNO3 solution indicates that the loss in crystal order is insignificant. An observed change in unit-cell parameters may be associated with the removal of aluminium cations from the zeolite framework (Table 3).
Table 3. Unit-cell parameters of the original and modified zeolites.
In the case of the desilication process, an increase in the concentration of the NaOH modified the unit-cell parameters. This is particularly evident in the case of the 1.5 M NaOH solution, which indicates that this selected concentration of MA solution might contribute to the extraction of a significant amount of silicon from the CLI framework.
The c parameter, which lies parallel to the channels of CLI, was not affected by the treatment with acidic and basic solutions. Consequently, changes in the a and b parameters may affect the sorption properties of the tested materials.
Crystal order depends largely on the type of zeolite structure and the presence/absence of various cations neutralizing the negative charge of the framework. The presence of K+ and Na+ ions is more important for the thermal stability of the CLI structure than the Si/Al ratio alone (Akkoca et al., Reference Akkoca, Yilgin, Ural, Akcin and Mergen2013). Ion exchange with NH4+ ions may affect the stability of the CLI structure and reduce the crystal order of the samples. The crystal order of the samples decreases with increasing concentration of the MA. Only CLI_C and CLI_D materials showed optimal values of framework parameters and preserved crystal structures of the zeolites. Further studies confirmed these observations.
The following discussion will focus on the characteristics of key samples (Fig. 2, Table 4). The first factor was the analysis of the influence of the MA on the efficiency of the dealumination/desilication processes and the Si/Al ratio of the zeolite materials studied.

Fig. 2. (a–f) Efficiency of the modification processes, chemical compositions and textural parameters of the tested zeolites.
Table 4. Textural characteristics of the original and modified CLI samples.
The data summarized in Table 4 show that the Si/Al ratios determined by XRF do not differ significantly from those determined by SEM energy-dispersive X-ray spectroscopy (EDX). The original CLI_1 sample was characterized by a low Si/Al ratio, equal to ~4.9. Both desilication and dealumination processes modified the Si/Al values. With increasing concentration of desilication agent, a gradual decrease in the Si/Al ratio was observed, which indicates an increasing amount of extracted silicon, but without significant changes in values of the framework parameters, except for CLI_F (Table 3). This indicates that alkalis might dissolve amorphous SiO2 on the CLI surface or the poorly bound SiO2 in the zeolite framework (Shen et al., Reference Shen, Qin, Gao, Lin, Zhou, Shen, Wang, Zhao and Liu2012). This is especially visible for the CLI_F sample. On the other hand, desilication might be accompanied by dealumination or realumination, which limits further dissolution of the framework (Groen et al., Reference Groen, Jansen, Moulijn and Pérez-Ramírez2004). These factors contribute to the formation of defects on the zeolite surface, which might allow multilayer adsorption of nitrogen vapour at a relatively high pressure. The fact that OH– ions from the alkaline solution influence the amount and type of Si being washed out is also significant. Selective dissolution of amorphous SiO2 might occur, as evidenced by decrease in desilication that occurs with an increase in the concentration of NaOH.
The comparison between parent and dealuminated CLI shows that the Si/Al ratio increased from 4.9 to ~12.0 (Fig. 2). An increase in the concentration of MA does not cause any significant changes in the Si/Al ratio, which indicates good efficiency of aluminium extraction from the framework of the materials tested.
After sequential dealumination, a standard desilication with NaOH solution was performed. In contrast to direct desilication, the treatment of CLI with an alkaline solution caused significant dissolution, indicating a lower aluminium content in the sample. The desilication of the dealuminated sample decreased the Si/Al ratio to 8.2.
The changes in textural parameters in CLI samples after the applied modifications were monitored by N2 adsorption (Table 4). The Ca,K-CLI did not have a significant volume of micropores (0.013 cm3/g). The volume of mesopores determined by means of the BJH method was insignificant, indicating the purely microporous character of the initial material. The ion exchange (CLI_1) caused an increase in the micropore volume (V micro = 0.06 cm3/g), which translated into an increase in the V total, thus confirming its microporous structure. Factors which might increase significantly the V micro value include: (1) ion exchange of CLI extra-framework cations, in particular K+ for NH4+; and (2) removal of impurities and dust from pores and sample channels by repeated washing with distilled water and ion exchange with an ammonium nitrate solution (Garcia-Basabe et al., Reference Garcia-Basabe, Rodriguez-Iznaga, Menorval, Llewellyn, Maurin, Lewis, Binions, Autie and Ruiz-Salvador2010). The modification of clinoptilolite preparations with nitric(V) acid caused an increase in the specific surface area of mesopores; this increase remained at a similar level regardless of the concentration of the dealumination agent. In addition, a constant value of micropores at 0.048 cm3/g was preserved.
Treating the parent zeolite with alkaline solutions increased the mesopore surface area, albeit not to the extent of the dealumination process. Therefore, the acid treatment of CLI is more effective (mesopore surface development) than the desilication. The formation of mesopores was accompanied by a significant decrease of the V micro from 0.060 to 0.013 cm3/g in the sequence CLI_1 > CLI_D > CLI_E > CLI_F. Acid treatment resulted in an increase in the volume of mesopores, except for the CLI_F sample. In this sample, a significant decrease in V meso (to 0.013 cm3/g) was observed, which indicates that the crystal structure may have been disrupted. The total pore volume (V meso + V micro) also decreased significantly. This was confirmed by XRD patterns in which the gradual disappearance of some reflections was observed.
To sum up, an increasing concentration of NaOH and the supplementary action of Na+ exchange resulted in a decrease in V micro to ~0. Therefore, desilication with 1.5 M NaOH solution modified to a significant extent the textural properties of CLI, causing significant disorder of the zeolite structure. Modification processes should enhance the formation of mesopores, which may facilitate the diffusion of soluble compounds from a zeolite material, in this case clinoptilolite. This observation explains the increase in V micro + V meso for samples treated with NH4NO3 compared with unmodified clinoptilolite.
Optimal textural properties (developed mesopore area of 39 m2/g and preserved V micro of 0.055 cm3/g) were achieved for CLI treated with 0.5 M NaOH as the desilication reagent (at 65°C for 0.5 h). Further increase in the concentration of the desilication agent caused disruption of microporosity as shown by XRD analysis and the decrease in V micro. Therefore, the most favourable V meso was obtained for CLI_D (Table 4). Hence, the next stage of modification would be the desilication of the previously dealuminated sample (CLI_C) with 0.5 M NaOH solution.
Dealumination of parent zeolite (Ca,K-CLI) with 0.9 M HNO3 solution led to a reduction in V micro (0.048 cm3/g). A subsequent alkaline treatment and dealumination (sample marked as CLI_H) led to a decrease in V micro to 0.033 cm3/g. This relatively small V micro value (CLI_C) may be explained by the presence of amorphous matter (Verboekend et al., Reference Verboekend, Keller, Milina, Hauert and Pérez-Ramírez2013). Subsequent treatment with NaOH dissolved the amorphous matter and dealumination partially increased the V micro (sample CLI_H).
The sample CLI_G has a relatively narrow pore distribution, with pores ~30 nm in size (Fig. 3). Further desilication (CLI_H) resulted in a decrease in the surface area of mesopores and a growth of pores to >40 nm in size.

Fig. 3. Pore-size distribution of parent and modified clinoptilolite analogues.
The SEM images of the microstructures and modified analogues of CLI are shown in Fig. 4. The original sample (CLI_1) consists of heterogeneous particles with irregular shapes. The treatment of CLI with an alkaline solution resulted in morphological changes in the zeolite, as shown in the SEM images. The most significant changes were observed in CLI_F, where a disordered microstructure is visible, which may have resulted from preferential dissolution of SiO2. In addition, samples CLI_G and CLI_H showed much larger grain sizes (especially in the case of CLI_H) and larger intergranular porosity. Furthermore, the microstructures of those materials are more disordered. This may be due to selective dealumination of smaller crystals, which in turn may have led to their preferential dissolution.

Fig. 4. (a–i) SEM images of the parent material and its modified analogues.
Figure 5 shows the different DTG curves of the original zeolite and selected modified analogues. The sample weight loss and total water loss are listed in Table 5. The weight loss visible on the DTG curves is constant during heating up to 900°C. For the parent material, ~10.32% of zeolite weight was lost due to removal of zeolitic water. The maximum weight loss was recorded in the temperature range 25–300°C, decreasing at higher temperatures. According to some studies, weight losses in the low-temperature range are associated with the removal of hygroscopic water and water molecules loosely bound on the zeolite surface (Moreno et al., Reference Moreno, Arellano and Ramirez2004; Orfanoudaki & Perraki, Reference Orfanoudaki and Perraki2004). Water molecules adsorbed on ion-exchange cations are not densely packed on the surface of the zeolite.
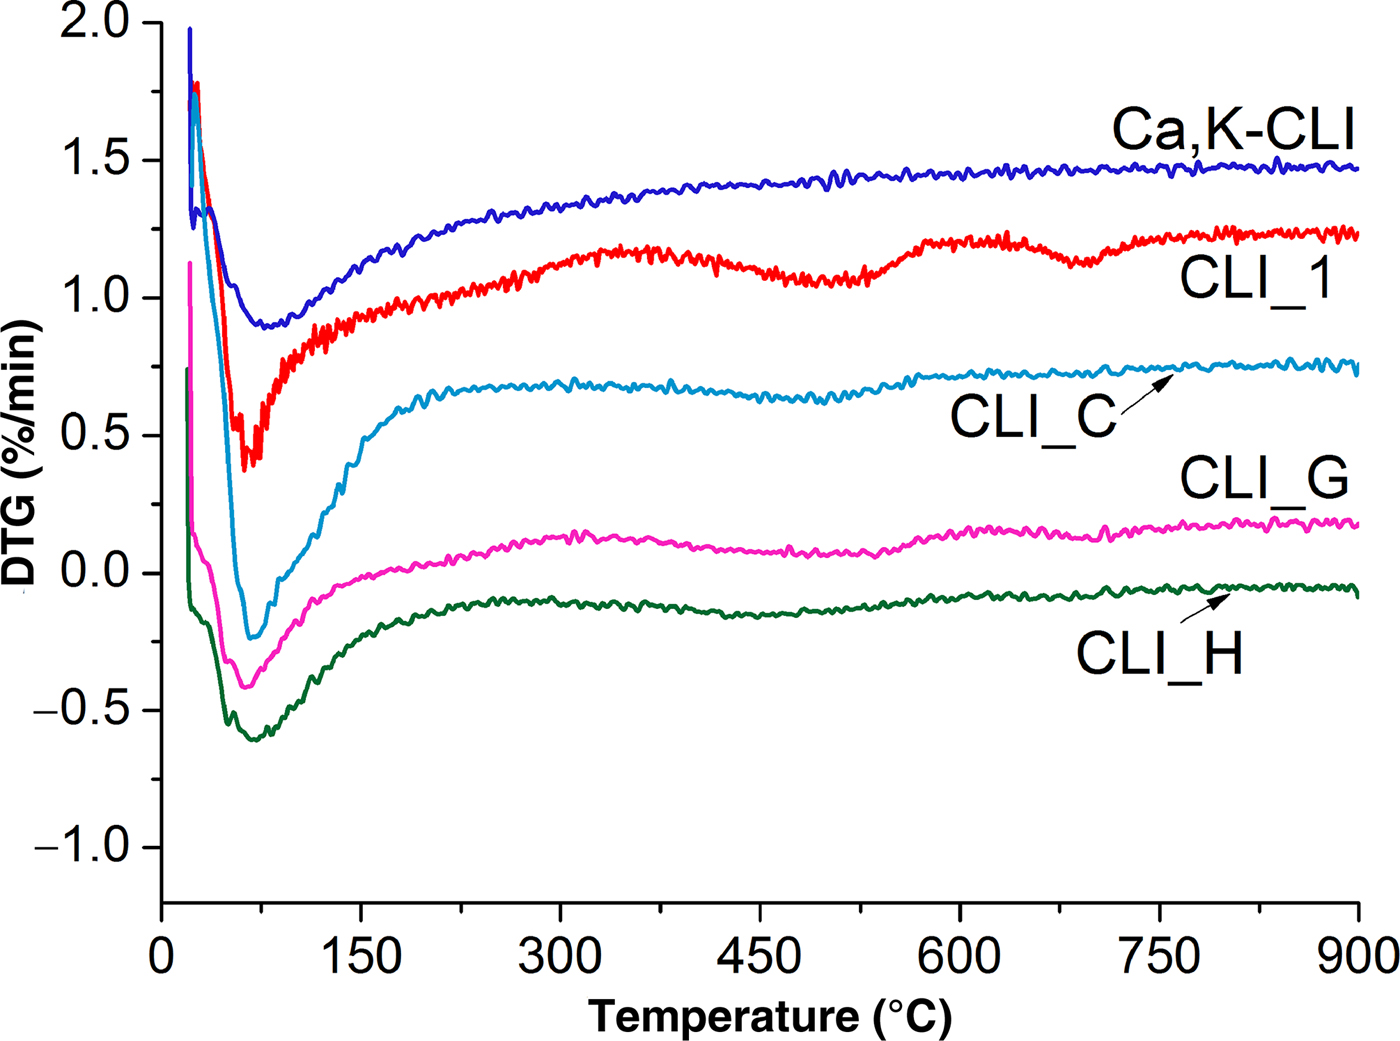
Fig. 5. DTG curves of parent and modified clinoptilolite.
Table 5. Weight loss due to release of water molecules at various dehydration steps.
The zeolite structure also contains inter-package water from hydroxyl groups, which, according to Breck (Reference Breck1974), is eliminated from CLI at ~360°C. At 150°C, only strongly adsorbed water complexes and hydroxyl groups remain on the surface of zeolite (Gorlov, Reference Gorlov and Lobanov2007). Hence, it is assumed that inter-package water at a temperature of ~150°C remains stable in the structure of the zeolite.
Changes in the structure of CLI caused by the proposed modification were described by FTIR spectroscopy. Figure 6 shows the FTIR spectra recorded in the MIR. For a better comparison, the locations of respective bands and their assignments are listed in Table 6. In the OH-stretching vibration range (3900–3400 cm–1), two types of bands were observed at ~3625 and ~3440 cm–1 (Verboekend et al., Reference Verboekend, Keller, Milina, Hauert and Pérez-Ramírez2013). The band at ~3625 cm–1 is assigned to the Si–O(H)–Al bridge acid group (Brönsted sites). These sites are characterized by the highest acidity. The next one, at ~3440 cm–1, is related to Si–OH groups located in framework defects and vibrations coming from OH groups (water adsorbed on free SiOH) (Datka et al., Reference Datka, Boczar and Gil1995; Joshi et al., Reference Joshi, Joshi, Choudhari and Kasture1997). The corresponding bending vibrations are located at ~1640 cm–1. The position of that band changes only slightly when different types of modifications are applied, suggesting that the state of water molecules in all of the tested samples is very similar. The bands at 3160–3240 cm–1 and at ~1400 cm–1 are attributed to the asymmetric stretching and bending vibrations of N–H bonds, respectively (Tomazović et al., Reference Tomazović, Ceranic and Sijaric1996). Both bands are linked to the ammonium groups introduced during ion exchange by NH4NO3.
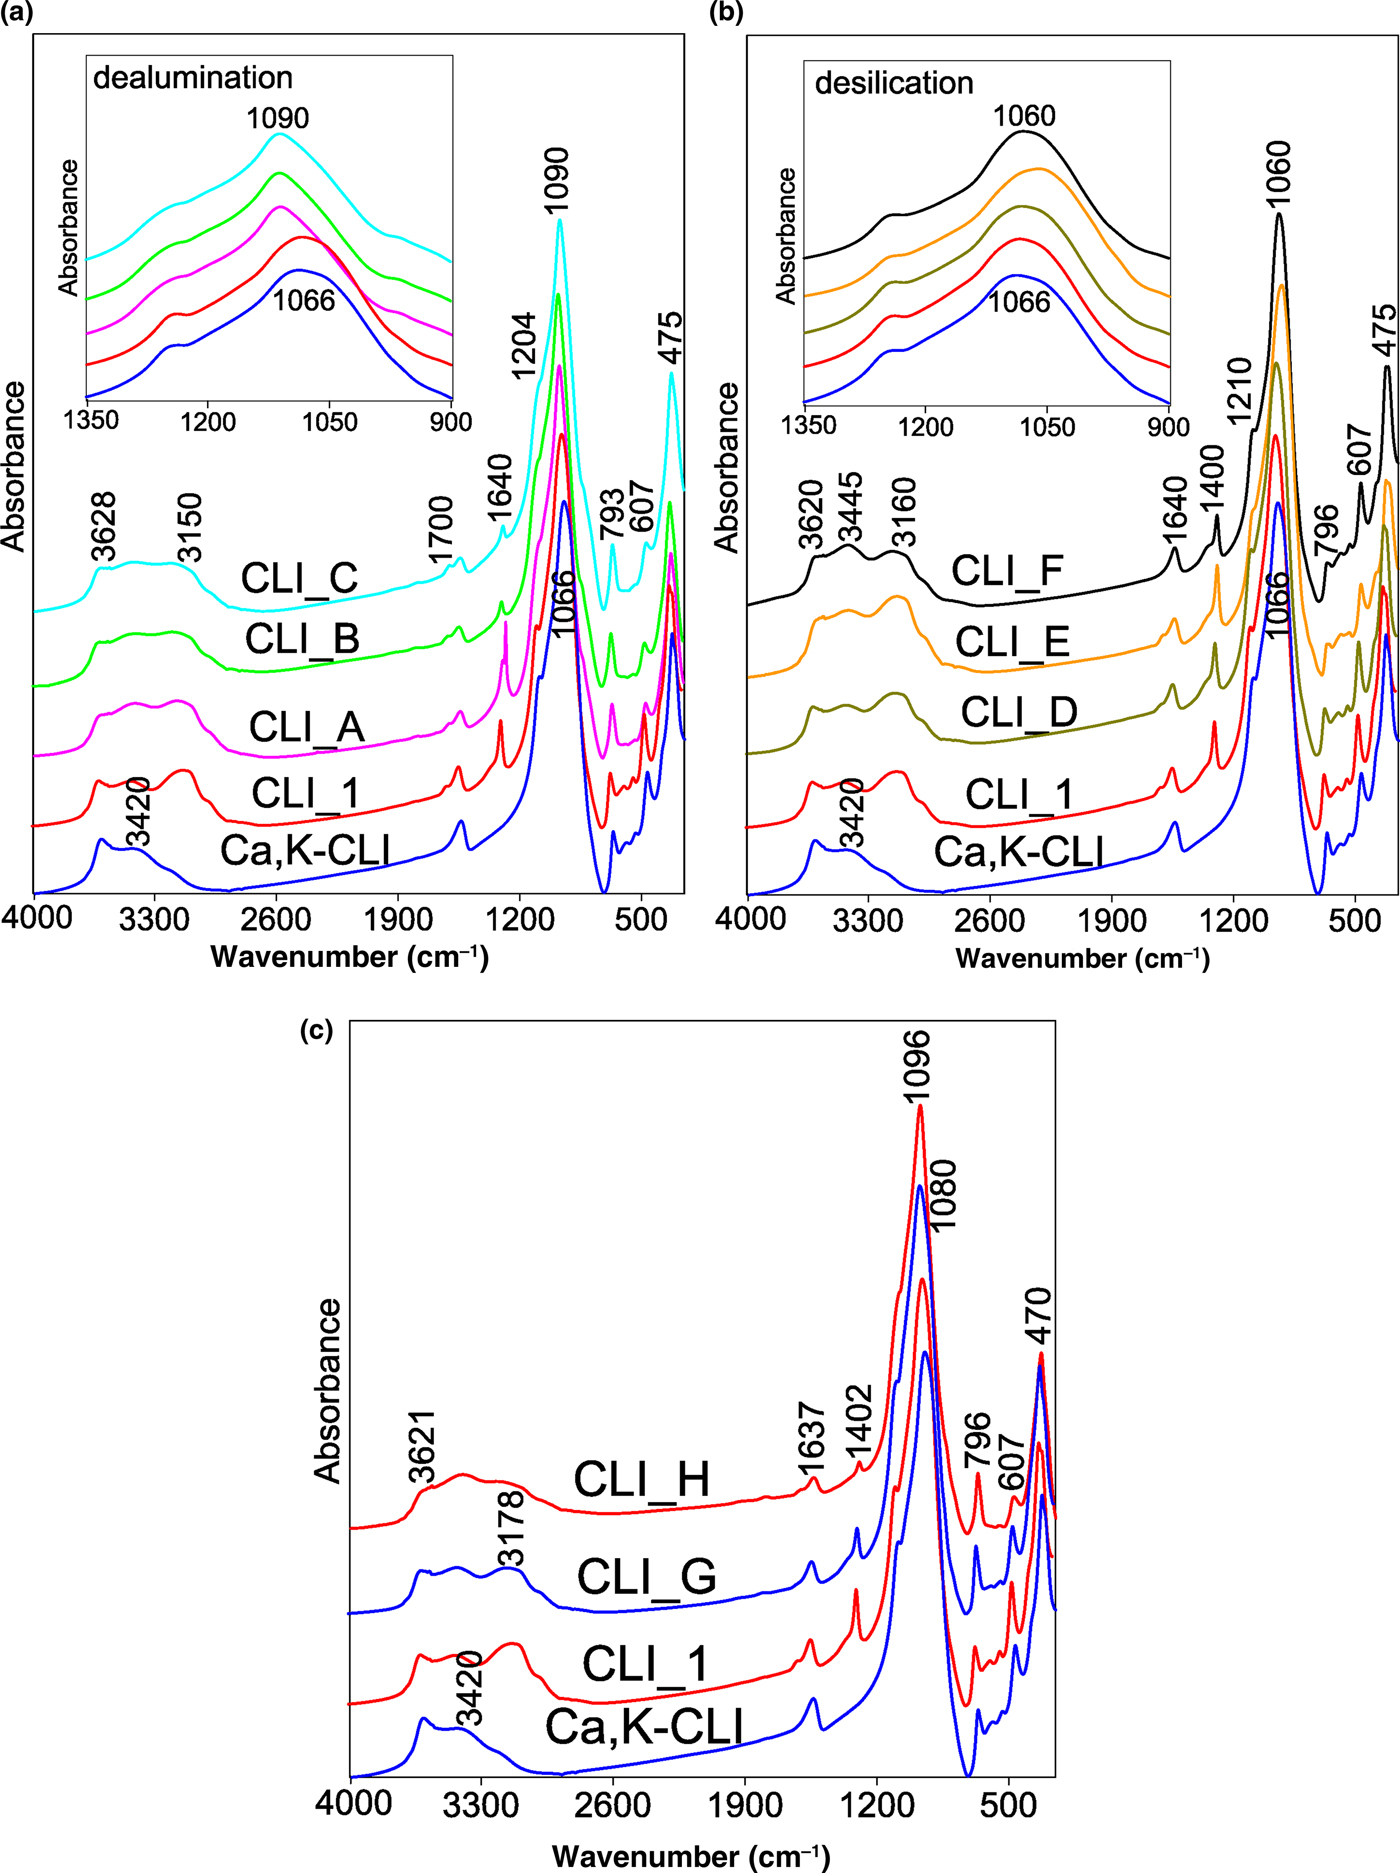
Fig. 6. (a–c) FTIR spectra of parent CLI_1 and modified analogues, recorded in the MIR (4000-450 cm−1).
Table 6. Assignment of the infrared bands for the original CLI.
Modification with acid solutions resulted in partial disappearance (decreases in intensity) of a band at 3625 cm–1, which indicates the removal of Al cations from the zeolite framework. This suggests that the OH vibrations disappear due to modifications of the active sites of CLI. In addition, a slight increase in the bandwidth intensity at 3440 cm–1 is noticeable, which indicates that defects in the silanol nests are generated as a result of the alumina vacancies (Sokol et al., Reference Sokol, Catlow, Garcés and Kuperman2004). The half-width of the aforementioned band increases with the concentration of dealumination agent (Fig. 6a,c). Treating CLI_C with NaOH solution modified the spectrum and rendered it similar to the spectrum of CLI_G. The intensity of the band at ~3625 cm–1 increased during increases in the mesopore surface (S meso). The final acid treatment (CLI_H) led to a widening of the band and to a decrease in the band intensity.
The treatment of CLI with NaOH solution slightly increased the band intensity at 3625 cm–1 due to an increase in the number of Si–OH–Al bridge acid groups with the extraction of Si atoms. The observed increase of hydroxyl group band intensity is related to the increase in Al content in the desilicated zeolite structure and is correlated directly with a decrease in the Si/Al ratio. These observations are in accord with the chemical compositions of the tested materials, which show that the CLI_F zeolite has the lowest Si/Al ratio.
The bands in the range 1210–400 cm–1 are associated with the aluminosilicate framework. In general, the positions of the bands follow the type of modification (i.e. dealumination moves a band towards higher and desilication towards lower wavenumbers). The displacement of Si–O–(Si,Al) bands due to asymmetric stretching towards lower frequencies with increasing Al content (Fig. 6) in the structure is attributed to the greater energy and bond length of the Al–O bond compared to the Si–O bond and indicates its smaller force constant (Fernández-Jiménez & Palomo, Reference Fernández-Jiménez and Palomo2005). In the aforementioned frequency range, the band at ~1210 cm–1 is related to the asymmetric tensile T–O vibrations with F2 symmetry (Doula, Reference Doula2003).
The position of the band at ~1066 cm–1, which is attributed to the asymmetric tetrahedral Si–O–Al and Si–O–Si stretching vibrations (Doula et al., Reference Doula, Ioannou and Dimirkou2002), is sensitive to the composition of the zeolite framework. The band moves towards higher wavenumbers with increasing Si/Al ratio (dealumination process; Fig. 6a). Therefore, the position of this band may be used to quantify the Si/Al ratio. The position of this band changes continuously with increasing concentration of the dealumination agent, until ~1090 cm–1 (Christidis et al., Reference Christidis, Moraetis, Keheyan, Akhalbedashvili, Kekelidze, Gevorkyan, Yeritsyan and Sargsyan2003). This may be explained by the fact that, during dealumination, the average charge on a tetrahedral atom increases, which results in an increase in the T–O bond strength on average and a change in the bond strength and Si–O–Si angle. The opposite trend was observed for the samples subjected to desilication (Fig. 6b). This fact is related to the association of cations in the channels and zeolite cages of CLI (Elaiopoulos et al., Reference Elaiopoulos, Perraki and Grigoropoulou2010; Yosefi et al., Reference Yosefi, Haghighi, Allahyari and Ashkriz2015).
The spectral range 800–400 cm–1 includes bands localized at 795, 720, 680, 610, 524, 467 and 455 cm–1 (Fig. 7). The band at 795 cm–1 is assigned to the symmetric Si–O–S vibrations, while that at 680 cm–1 is due to the symmetric tensile vibrations of the TO4 tetrahedra (Yan et al., Reference Yan, Ma, Jiang, Long, Sun, Zhao, Treacy, Marcus, Bisher and Higgins1998). The low-intensity band at ~720 cm–1 is associated with symmetric Si–O–Al vibrations. This band decreases in intensity and finally disappears, indicating extraction of Al cations from the zeolite tetrahedra due to dealumination. The band at 610 cm–1 denotes the external vibrations of the four-member rings or O–T–O bending vibrations (Doula et al., Reference Doula2007). The band at 524 cm–1 corresponds to ‘pore-opening’ vibrations, and that at 467 cm–1 corresponds to internal TO4 vibrations (Si–O–(Si,Al) bending vibrations; Gao et al., Reference Gao, Lin, Wang, Hwang, Shiu, Chang and Cheng2014). The dealumination process resulted in a slight shift of the band at 610 cm–1 towards higher wavenumbers. Similar shifts were observed for the bands at 467 and 455 cm–1, whereas the position of the band at 1200 cm–1 due to internal asymmetric tensile vibrations did not change. This may be related to the fact that dealumination of the zeolite structure contributed to a slight change of bond length in the tetrahedra expressed as a slight change in the network parameter a (Table 3). Additional desilication did not change the band intensity corresponding to the symmetric Si–O–Si vibrations (795 cm–1). This is in line with the XRD results from which it was concluded that the treatment with NaOH did not significantly affect the structure of the CLI framework (except for the CLI_F sample), only influencing the selective removal of the amorphous SiO2 on the surface of the material.
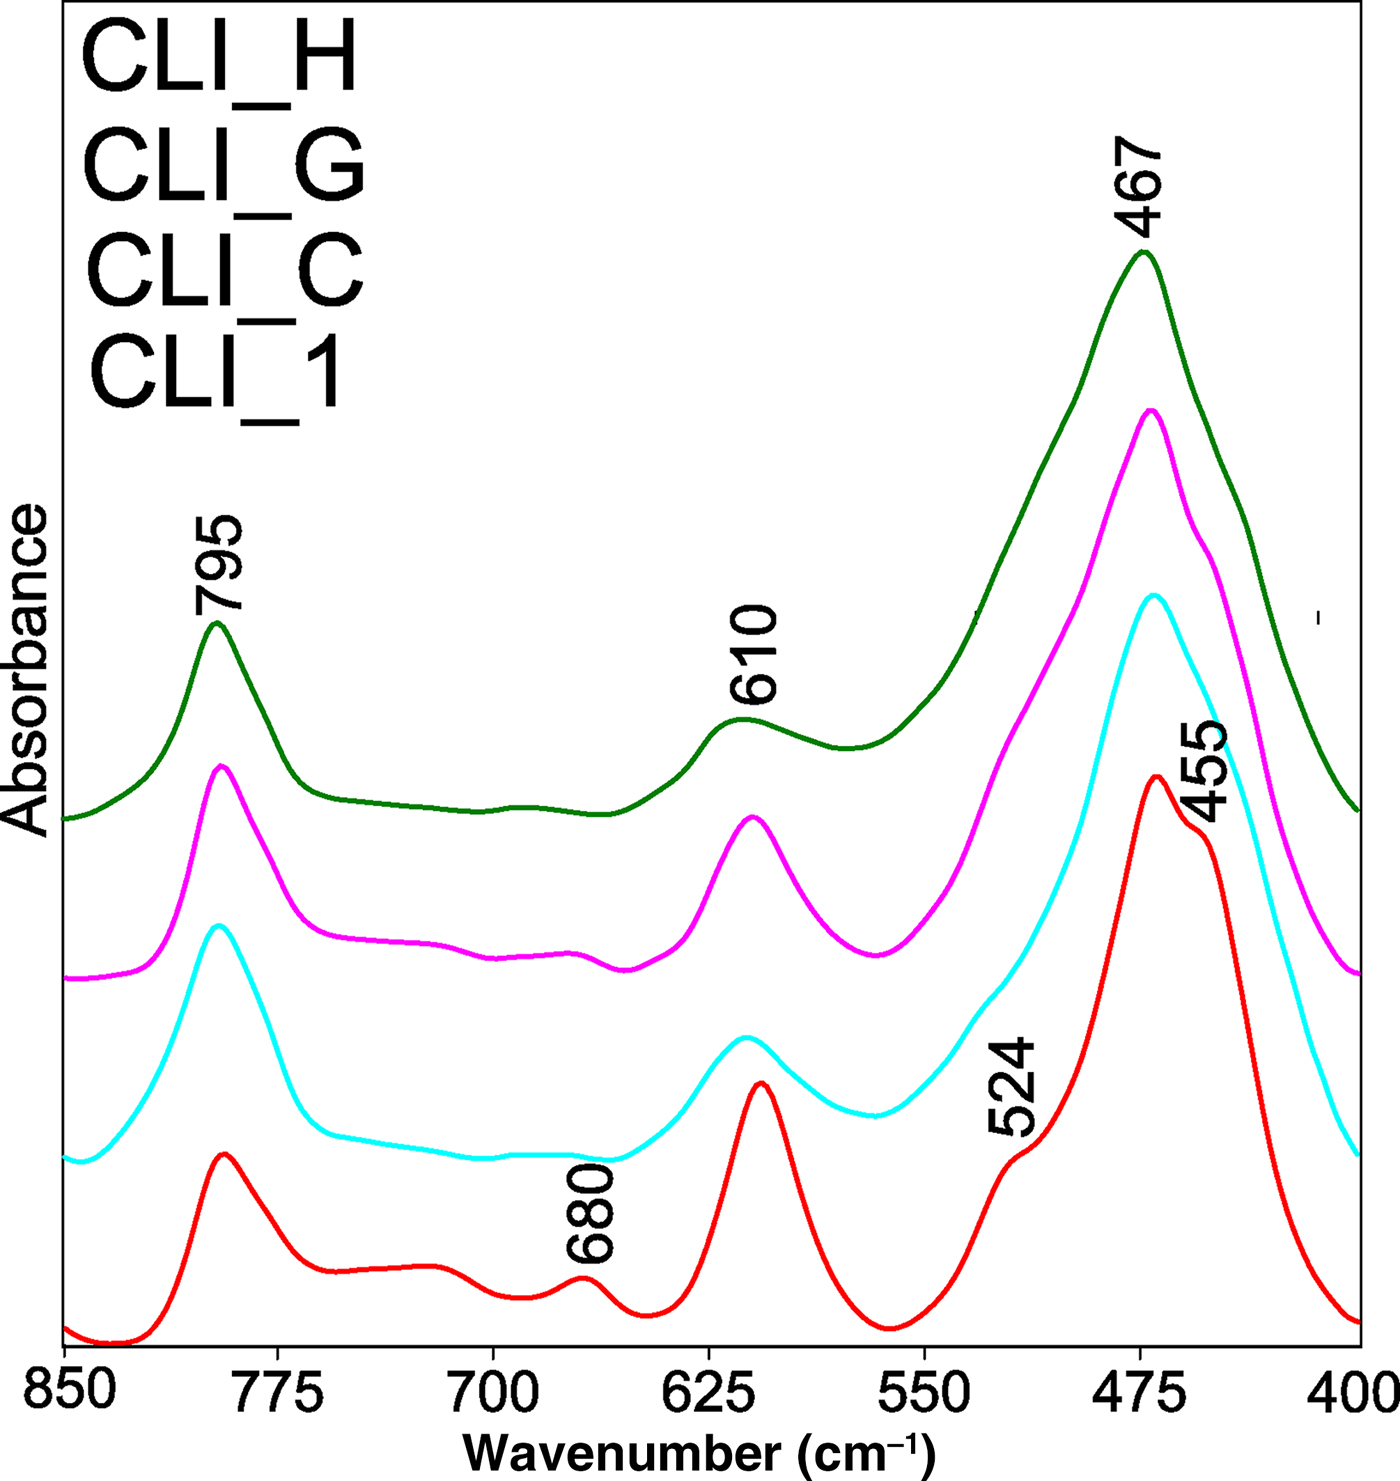
Fig. 7. FTIR spectra of parent CLI_1 and modified analogues, recorded in a narrower frequency range of the MIR (850-400 cm−1).
Summary and conclusions
A natural CLI was treated with acidic and basic solutions. The choice of appropriate conditions for desilication and dealumination yielded a mesoporous material. Clinoptilolite subjected to dealumination and subsequent desilication developed an increased mesopore surface area (CLI_G). The structural characteristics of the modified materials revealed the important role of dealumination during treatment of the original zeolite. A significant amount of Al was removed from the zeolite framework, without significant effect on the crystal order of CLI, although it caused minor changes in framework parameters. Desilication of a previously dealuminated sample was an effective modification tool, which, in addition to introducing a mesoporosity, selectively removed tetrahedral Si from the zeolite framework. Optimization of modification conditions allowed zeolites with a hierarchical pore system to be obtained, characterized by high mesoporosity and a relatively narrow pore size distribution of the modified material (CLI_G). The proposed method of modification of the CLI structure was an effective method for creating a secondary mesopore system in the zeolite structure, which might lead to significant improvements in its sorption properties.
Acknowledgements
This work was supported financially supported by the National Science Centre in Poland as part of grant no. 2016/21/N/ST8/01332.