INTRODUCTION
Although water is probably the most important physical factor affecting the ecology of terrestrial organisms (Krebs Reference KREBS2001), animal groups can respond differently to a given environmental variable. For example, bird species richness in South America is primarily affected by topography, latitude and precipitation (Rahbek & Graves Reference RAHBEK and GRAVES2001), and reptile species richness in China is most influenced by temperature (Qian et al. Reference QIAN, WANG, WANG and LI2007).
Particularly for amphibians, whose life cycle is strongly influenced by the distribution and abundance of water, usually in the form of rain (McDiarmid Reference McDIARMID, Heyer, Donnelly, McDiarmid, Hayek and Foster1994), the influence of abiotic variables has long been recognized as an important factor for structuring frog assemblages (Duellman & Trueb Reference DUELLMAN and TRUEB1994). Few tetrapod vertebrates are as dependent on environmental moisture as amphibians, due to their permeable skin (where cutaneous gas exchange occurs), as well as their dependence on aquatic and terrestrial habitats during their life cycles (Duellman & Trueb Reference DUELLMAN and TRUEB1994). Even species with terrestrial reproductive modes (sensu Duellman & Trueb Reference DUELLMAN and TRUEB1994, Haddad & Prado Reference HADDAD and PRADO2005) are more frequent in environments with continuously highly atmospheric moisture (Duellman & Trueb Reference DUELLMAN and TRUEB1994). Therefore, the species richness of amphibians is higher in areas with high moisture levels and moderate to warm temperatures (Duellman & Trueb Reference DUELLMAN and TRUEB1994). This dependence on climatic variables has shown that, in some areas, abiotic factors are more important for the structuring of frog assemblages than biotic factors are (Parris Reference PARRIS2004, Werner et al. Reference WERNER, SKELLY, RELYEA and YUREWICZ2007), but other studies have shown that spatial effects and stochasticity can also influence amphibian community composition (Ernst & Rödel Reference ERNST and RÖDEL2005, Reference ERNST and RÖDEL2008).
Studies that verify the influence of the climatic variables on patterns of species richness distribution have been performed for amphibians in different regions of the world (Qian et al. Reference QIAN, WANG, WANG and LI2007, Rodríguez et al. Reference RODRÍGUEZ, BELMONTES and HAWKINS2005, Williams & Hero Reference WILLIAMS and HERO2001), and also for different animal groups in Brazil (Diniz-Filho et al. Reference DINIZ-FILHO, BINI, VIEIRA, BLAMIRES, TERRIBILE, BASTOS, OLIVEIRA and BARRETO2008, Terribile & Diniz-Filho Reference TERRIBILE and DINIZ-FILHO2009), but this kind of study is still scarce for South American amphibians. The only study that verifies how spatial distribution of amphibian species richness responds to environmental variables was performed in the Brazilian cerrado biome, but results are inconclusive mainly because of the lack of a more extensive database on species occurrence at the analysed scale (Diniz-Filho et al. Reference DINIZ-FILHO, BINI, VIEIRA, BLAMIRES, TERRIBILE, BASTOS, OLIVEIRA and BARRETO2008). Herein we assess the influence of climatic variables and altitude on anuran species richness of Brazilian localities from different biomes. Because anuran species are highly dependent on environmental variables, we hypothesized that anuran species richness from different Brazilian localities would vary according to climatic (temperature, annual rainfall volume and a measure of the concentration of annual rainfall) and altitudinal variables. Then, we examined not only the total species richness, but also the reproductive diversity (by means of number of reproductive modes in each locality) according to climatic and altitudinal variables.
METHODS
Selection of localities and collection of climatic data variables
Among the available published studies, we selected only those in which there were sequential samplings during the hot and wet months of the year (the suitable period for reproduction and, consequently, the most effective one for recording the majority of anuran species; Bertoluci & Rodrigues Reference BERTOLUCI and RODRIGUES2002, Duellman & Trueb Reference DUELLMAN and TRUEB1994). In this way, we were able to obtain a general list of anuran species from 36 Brazilian localities (Figure 1, Appendix 1). The reproductive modes (sensu Haddad & Prado Reference HADDAD and PRADO2005, updated from Duellman & Trueb Reference DUELLMAN and TRUEB1994) of anuran species from each locality were determined using the information presented by the authors of the lists (when this information was available), and were also determined using information available on the natural history of each species in the literature (Duellman Reference DUELLMAN2005, Haddad & Prado Reference HADDAD and PRADO2005, Haddad et al. Reference HADDAD, TOLEDO and PRADO2008). Lithobates catesbeianus (Shaw, 1802), an exotic species from North America, was excluded from the analysis, as were those species for which information about their reproductive mode was not available, such as Megaelosia goeldii (Baumann, 1912), or species whose reproductive mode is uncertain in a given locality (i.e. species that, according to literature, can exhibit more than one reproductive mode, and for whom there is not sufficient information to determine the reproductive mode for a given locality).
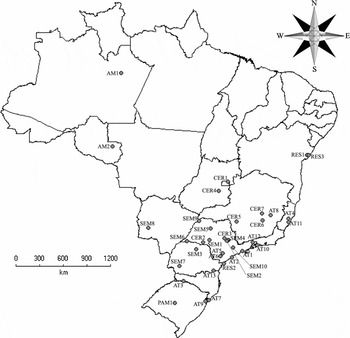
Figure 1. Geographic localization of the 36 Brazilian localities selected for the present study (abbreviations of each locality as in Appendix 1).
The studied localities selected (Appendix 1) come from six Brazilian phytophysiognomies (Ab'Sáber Reference AB'SABER1977, IBGE available at http://www2.ibge.gov.br/download/mapas_murais/biomas_pdf.zip): (1) The Amazonian rain forest: characterized by the predominance of moist forest and a hot and wet climate, where rainfall is well distributed through the year, and located in northern Brazil; (2) Atlantic forest sensu stricto: also characterized by moist forest formation and a hot and wet climate, located from the north-eastern to the southern Brazilian coast; (3) cerrado: characterized by a savanna-like vegetation with riparian forest along streams, and two well-defined seasons in the year, a hot and wet season, and a dry and cold season, and located mainly in central Brazil; (4) pampa: characterized by grassland physiognomy in southern Brazil, well-distributed rains through the year, and sub-zero temperatures during the cold period; (5) mesophytic semideciduous forest: classified as a sub-domain of Atlantic forest, mainly characterized by the partial loss of leaves, as a consequence of low rainfall during the cold period of the year, and located mainly in south and south-eastern Brazil; and (6) restinga: also part of the Atlantic forest domain, comprised of coastal sand dune habitats covered with herbaceous and shrubby vegetation, which is common along the Brazilian coast.
The climate data (mean average, mean minimum and mean maximum annual temperature, and mean total annual rainfall) and altitude in each locality, part of a historical record between 1950 and 2000, were obtained from global land area interpolation of climate point data at a spatial resolution of 2.5 arc-min (~5 km sensu Hijmans et al. Reference HIJMANS, CAMERON, PARRA, JONES and JARVIS2005, available at http://www.worldclim.org). Although selected climate stations were not randomly distributed within the Brazilian territory, the specific localities selected for the present study are within the areas covered by the stations (see Figure 1 in Hijmans et al. Reference HIJMANS, CAMERON, PARRA, JONES and JARVIS2005 to verify the locations of weather stations from which data were used in the interpolation). When necessary, climate stations used in the worldclim data base were removed or corrected when errors were detected (e.g. the wrong coordinates or the use of different units). According to Hijmans et al. (Reference HIJMANS, CAMERON, PARRA, JONES and JARVIS2005), Latin American rainfall data were collected from 18 895 stations, while minimum and maximum temperature was collected from 5321 stations, and mean temperature was collected from 13 842 stations. These data were extracted using DIVA-GIS software (Hijmans et al. Reference HIJMANS, GUARINO and ROJAS2002).
The selected studies vary in relation to the time when the anuran faunas were surveyed. Some studies detected species disappearance or a reduction in population size during the years studied as a possible consequence of human impact (e.g. Crossodactylus dispar Lutz, 1925 at Boracéia, south-eastern Brazil: Heyer et al. Reference HEYER, RAND, CRUZ, PEIXOTO and NELSON1990), but this topic is still open to interpretation, as amphibian populations are known to fluctuate greatly over time, with cycles up to 12 y long (Beebee Reference BEEBEE1996). Therefore, some possible declines may actually represent natural fluctuations (Beebee Reference BEEBEE1996, Vitt & Caldwell Reference VITT and CALDWELL2009). On the other hand, some studies were performed after the period for which climate data were available (1950–2000). However, we are assuming that changes in climate data after 2000 are not so extensive to result in significant changes (local extinction or addition of species) to the selected anuran communities studied after 2000.
Statistical analysis
The influence of rainfall was assessed in two ways: total annual rainfall and a measure of the concentration of annual rainfall. Total annual rainfall was obtained by adding up the rainfall values of each month of the year, while the measure of the concentration of annual rainfall was determined by a circular statistical analysis (Zar Reference ZAR1999), using the software Oriana for Windows 2.02 (developed by Kovach Computer Services, available at http://www.kovcomp.com). Months were converted into angles (at intervals of 30°) and the volume of rainfall of each month was measured as the frequency of each angle (month) observed (Both et al. Reference BOTH, KAEFER, SANTOS and CECHIN2008). We estimated the length of the mean vector (r), representing a measure of data concentration around the circle (year), ranging from 0 (scattered data = homogeneous rainfall through the year) to 1 (concentrated data = concentrated rainfall in any season of the year).
In this study, we considered only data on the average minimum temperature of each locality, because this variable was the one that had the largest coefficient of variation (CV = 19.5%) when compared with the average maximum temperature (CV = 10.9%) and the average annual temperature (CV = 13.5%) (Ayres et al. Reference AYRES, AYRES, AYRES and SANTOS2003).
In order to evaluate the effects of climate variables (total annual rainfall, measure of concentration of annual rainfall and minimum temperature) and altitude on anuran species richness and the number of reproductive modes of selected localities, we used a partial constrained linear ordination method (partial redundancy analysis: pRDA), which is analogous to a multiple regression analysis (Legendre & Legendre Reference LEGENDRE and LEGENDRE1998). Because locality area was not held constant among the selected localities, we first regressed species richness and number of reproductive modes, separately, on locality size area in order to statistically remove the effect of locality area before we conduct pRDA (Qian et al. Reference QIAN, WANG, WANG and LI2007). Then, we used the residual values as biotic variables for pRDA, because they contain the true information on species richness and reproductive modes. Species richness, the number of reproductive modes, and locality area were log10-transformed in order to remove the heterogeneity of variance of the original data (correction of the heteroscedasticity of the data, sensu Zar Reference ZAR1999). Next, we constructed three matrices for pRDA: (1) a biotic matrix containing the residual values of species richness and the number of reproductive modes; (2) an environmental variable matrix containing the explanatory variables (total annual rainfall, measure of concentration of annual rainfall, average minimum temperature, and altitude); and (3) a covariable matrix, containing geographic coordinates of each locality (latitude and longitude expressed in decimal degree). This last matrix was used to evaluate the variation in terms of spatial-autocorrelation, because our data set was not randomly distributed in Brazil (Figure 1). Before running pRDA, all environmental variables were normalized using standard deviation and the significance of each explanatory variable was manually tested through forward selection (analogous to forward stepwise regression), using 999 Monte Carlo permutations. In this way, we retained only variables that explained a statistically significant proportion of the variation in the species matrix in the model, and used alpha set at 0.05. The Variance Inflation Factor (VIF) was also calculated for each explanatory variable, and was related to the (partial) multiple correlation between two environmental variables. A high VIF of a variable (>20) indicates multicollinearity with the other variables and therefore has no unique contribution to the regression equation, which renders its regression coefficient unstable, and does not require interpretation (ter Braak Reference TER BRAAK1986). Significance of the first canonical axis was tested using 999 Monte Carlo permutations, which were constrained by the covariable matrix. We also performed a variation partitioning analysis (Borcard et al. Reference BORCARD, LEGENDRE and DRAPEAU1992, Both et al. Reference BOTH, SOLÉ, SANTOS and CECHIN2009) in order to verify (1) the contribution of environmental variables alone (without spatial effect, i.e. geographic position); (2) the contribution of geographic position alone; and (3) the contribution of spatially structured environmental variables (i.e. indistinguishable effect of environment and space). We were then able to calculate an environmental RDA, a spatial RDA, a pRDA using environmental variables and geographic coordinates (with this last variable being covariable data), and a pRDA using geographic coordinates and environmental variables (this last one as covariable data). The total variation (total inertia) equals the sum of all eigenvalues of a Redundancy Analysis of biotic data. The sum of all canonical eigenvalues represents the part of total inertia explained by RDA. To transform these measurements into percentages of the total variation of biotic data, one divides the sum of all the canonical eigenvalues by the total inertia (Borcard et al. Reference BORCARD, LEGENDRE and DRAPEAU1992, Both et al. Reference BOTH, SOLÉ, SANTOS and CECHIN2009). All permutation tests and pRDA were performed using CANOCO 4.5 for Windows software (ter Braak & Smilauer Reference TER BRAAK and SMILAUER2002).
RESULTS
Among the 36 selected localities, species richness varied from 16 to 65 and the number of reproductive modes varied from four to 17 in each locality (Appendix 1). After forward selection analysis, pRDA retained all environmental variables (P < 0.05 for all explanatory variables). These variables are not collinear, since the VIF values varied from 1.21 (total annual rainfall) to 11.5 (temperature). The first pRDA axis relating species richness and number of reproductive modes to environmental variables was significant (F = 5.77, P = 0.001). The first two axes explained 23.5% of the variation, but interpretation on the second axis becomes unfeasible because the first axis alone explained 22.5% of the total inertia (Figure 2). The first axis was positively correlated with total annual rainfall (r = 0.25) and altitude (r = 0.15), and negatively correlated with the concentration of annual rainfall (r = −0.29) and temperature (r = −0.23). In the triplot, anuran species richness and the number of reproductive modes were directly associated with total annual rainfall and altitude vectors, and indirectly associated with the concentration of annual rainfall vector and temperature (Figure 2). In general, Atlantic forest localities were widely scattered in the triplot, but seven out of 13 localities (AT1, AT2, AT5, AT7, AT9, AT10 and AT11) were more closely associated with the total annual rainfall vector (Figure 2). On the other hand, most mesophytic semideciduous forest (SEM1, SEM2, SEM4, SEM5 and SEM9) and cerrado localities (CER1, CER2, CER3 and CER4) were most closely associated to the concentration of annual rainfall (Figure 2). As altitude and temperature vectors are more closely associated with the second axis, no conclusive association could be determined between these environmental variables and selected localities. The few other localities from the Amazonian rain forest, pampa and restinga did not show a common pattern.
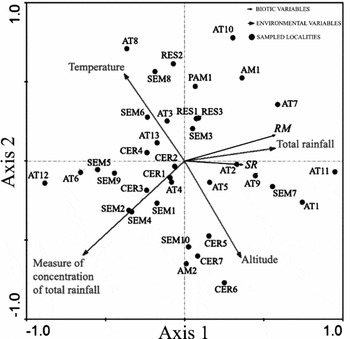
Figure 2. Ordination triplot showing the two axis of the partial RDA, considering the biotic variables (SR = total anuran species richness; RM = number of reproductive modes), environmental variables, and sampled localities whose anuran species richness and reproductive modes were considered in the current study (abbreviation of each locality means the predominant phytophysiognomy, as in Appendix 1). Eigenvalues: axis 1 = 0.194; axis 2 = 0.008. Percentage variance of species data: axis 1 = 22.5%; axis 2 = 1%.
The variation partitioning showed that 15.5% of the variation was explained solely by the environmental matrix, 6.6% was explained by geographic position (i.e. due to spatial autocorrelation), and 1.43% was explained by the indistinguishable effect of environment and space. The remaining 76.5% of the variation was unexplained.
DISCUSSION
In the present study, much of the variance remained unexplained by explanatory variables (76.5%), which may be made up of other variables not tested. Among the few studies that analysed patterns of amphibian species richness distribution, habitat heterogeneity (e.g. rain-forest area and shape, and diversity of structural vegetation types), altitudinal diversity, and latitude are important for determining patterns of frog species richness in Australia (Williams & Hero Reference WILLIAMS and HERO2001, Williams & Pearson Reference WILLIAMS and PEARSON1997). Other variables considered important for amphibians are those concerning environmental productivity, such as net primary productivity explaining part of distribution of amphibian species richness in China (Qian et al. Reference QIAN, WANG, WANG and LI2007) and the amount of plant biomass as one of the main predictors of amphibian species richness in Europe (Rodríguez et al. Reference RODRÍGUEZ, BELMONTES and HAWKINS2005). However, these variables are not considered the most important predictors of amphibian species richness in their respective localities, instead, rainfall has been pointed out as the main factor for determining species richness (Australia: Williams & Hero Reference WILLIAMS and HERO2001; China: Qian et al. Reference QIAN, WANG, WANG and LI2007). Although Rodríguez et al. (Reference RODRÍGUEZ, BELMONTES and HAWKINS2005) did not find a direct relationship between rainfall and amphibian species richness in Europe, water availability and energy (primary productivity) were the main factors related to species richness there. On the other hand, recent studies have shown that a large number of stochastic events can lead to variation in community composition (Ernst & Rödel Reference ERNST and RÖDEL2005). In addition, some studies have found that anuran species diversity of some guilds is also associated with historical biogeography (especially extinctions and subsequent recolonizations) of a given area (Williams & Hero Reference WILLIAMS and HERO2001).
Among the explanatory variables studied herein (which explained 23.5% of the variance), the present study found that rainfall was the main variable related to species richness of anuran amphibians in Brazil, as it was in the previous studies performed in Australia (Williams & Hero Reference WILLIAMS and HERO2001) and China (Qian et al. Reference QIAN, WANG, WANG and LI2007). The association of amphibians with humid areas is expected based on their physiological requirements (moist environments prevent desiccation of the animal, and allow cutaneous gas exchange) and also based on their reproductive requirements (anamniotic eggs that depend on water bodies or moist environments for an adequate development), which are unique characteristics of this animal group (Duellman & Trueb Reference DUELLMAN and TRUEB1994). This becomes evident in the current study because of the higher species richness in localities with higher values of total annual rainfall (e.g. Boracéia – AT1 and Manaus – AM1, with 65 and 50 species respectively; Heyer et al. Reference HEYER, RAND, CRUZ, PEIXOTO and NELSON1990 and Lima et al. Reference LIMA, MAGNUSSON, MENIN, ERDTMANN, RODRIGUES, KELLER and HÖDL2006, respectively). The same result occurs in the case of the relationship between rainfall and the number of reproductive modes. Even though species richness is considered moderate in a humid locality, the number of reproductive modes tends to be high, because humidity can provide a suitable microhabitat for terrestrial reproductive modes (Hödl Reference HÖDL1990). For example, the Estação Ecológica Juréia-Itatins (AT2; Pombal & Gordo Reference POMBAL, GORDO, Marques and Duleba2004) shelters 30 anuran species (lower species richness than most of the localities in the Atlantic forest sensu stricto), but there are 14 known reproductive modes in this area, six of them with terrestrial or arboreal eggs (modes 19, 23, 24, 25, 32 and 36, sensu Haddad & Prado Reference HADDAD and PRADO2005). The importance of total annual rainfall is more evident for Atlantic forest sensu stricto localities, where the rainfall is continuous throughout the year (Haddad et al. Reference HADDAD, TOLEDO and PRADO2008). Thus, one possible explanation for the high diversity of reproductive modes in Atlantic forest frogs is their successful adaptations to reproduce in the different available humid microhabitats found in the moist forest (Haddad & Prado Reference HADDAD and PRADO2005).
On the other hand, the measure of the concentration of annual rainfall was negatively correlated with species richness and the number of reproductive modes. According to Duellman (Reference DUELLMAN1988) and Hödl (Reference HÖDL1990), areas with little seasonal variation (that is, with continuous high humidity) favour semi-terrestrial and terrestrial reproductive modes, which are generally absent or rarely represented in anuran assemblages from seasonally dry areas. In the present study, localities with less seasonal variation tend to shelter moderate-to-high species richness and numbers of reproductive modes, as is seen in Mangaratiba, Rio de Janeiro State (with 54 species and 17 different reproductive modes: Carvalho-e-Silva et al. Reference CARVALHO-E-SILVA, SILVA and CARVALHO-E-SILVA2008, Silva et al. Reference SILVA, CARVALHO and BITTENCOURT-SILVA2008), and São José do Barreiro, São Paulo State (with 35 species and 13 different reproductive modes: Serafim et al. Reference SERAFIM, IENNE, CICCHI and JIM2008), which are localities where rainfall is continuous through the year. On the other hand, anuran species richness and number of reproductive modes of seasonal localities (most cerrado and mesophytic semideciduous forest localities) were most closely associated with the concentration of annual rainfall in the triplot; that is to say, anuran assemblages in seasonal areas of Brazil are more affected by climatic seasonality of rainfall than they are by other climatic variables analysed. In fact, the high overlap between cerrado and mesophytic semideciduous forest localities recorded herein was expected due to the high climatic seasonality of these two phytophysiognomies, which makes the occurrence of most typical anuran species from Atlantic forest sensu stricto impossible (Santos et al. Reference SANTOS, VASCONCELOS, ROSSA-FERES and HADDAD2009).
In the present study, species richness and the number of reproductive modes were not associated with temperature. Although temperature is often correlated with breeding activities of anuran species throughout the year in the Neotropical region (Canavero et al. Reference CANAVERO, ARIM, NAYA, CAMARGO, ROSA and MANEYRO2008, Duellman & Trueb Reference DUELLMAN and TRUEB1994, Vasconcelos & Rossa-Feres Reference VASCONCELOS and ROSSA-FERES2005), it is believed that this variable plays a secondary role in the regulation of reproductive activity of anurans (Heyer Reference HEYER1973), because it is probably correlated with rainfall occurrence, mainly in regions with climatic seasonality (Santos et al. Reference SANTOS, CASATTI and ROSSA-FERES2007, Toledo et al. Reference TOLEDO, ZINA and HADDAD2003, Vasconcelos & Rossa-Feres Reference VASCONCELOS and ROSSA-FERES2005). Despite this probable secondary importance of temperature, a stronger influence of this variable on anuran assemblages might be recorded in future studies with the inclusion of more localities in the southernmost Brazilian region, because while variation in precipitation decreases, temperature markedly increases its seasonality at higher latitudes, which in turn influences anuran activities at these locations (Canavero et al. Reference CANAVERO, ARIM and BRAZEIRO2009).
We identified here that altitude was positively correlated with species richness and the number of reproductive modes. Neither Rodríguez et al. (Reference RODRÍGUEZ, BELMONTES and HAWKINS2005) in Europe nor Qian et al. (Reference QIAN, WANG, WANG and LI2007) in China found any correlation between altitudinal variables (topographic relief, minimum and maximum elevation) and amphibian species richness in those regions. Although Williams & Hero (Reference WILLIAMS and HERO2001) found a positive correlation between altitudinal diversity and amphibian species richness in Australia, altitudinal importance should be considered carefully in this case, since differences in elevation may also be associated with differences in climate at finer scales (Rodríguez et al. Reference RODRÍGUEZ, BELMONTES and HAWKINS2005), and increasing elevation results in decreasing temperature (Qian et al. Reference QIAN, WANG, WANG and LI2007, Williams & Hero Reference WILLIAMS and HERO2001). No association between elevation and temperature was found in the present study, maybe because we did not include high-altitude sites. Altitude can be important for providing habitat diversity in a given locality, which can differ substantially if elevation range starts at a different base elevation (Qian et al. Reference QIAN, WANG, WANG and LI2007). Although it had not been possible to measure the true values of geographic isolation of selected localities in order to assess topographic diversity, mountainous areas are known to contain many different habitats, producing more geographic isolation of populations, and may therefore promote speciation (Krebs Reference KREBS2001). In the same way, the rough topography of Atlantic forest in the Brazilian coastal area is one of the explanations for the high diversity of anurans in this biome, because it breaks the biome up into many small microhabitats, and could lead to high rates of endemism and geographic isolation among populations (Haddad & Prado Reference HADDAD and PRADO2005). Thus, in order to generalize such a hypothesis for Brazilian anurans, we recommend more surveys in high-altitude sites in different Brazilian areas, particularly in those not studied, such as the North Amazonian upland region.
In conclusion, total annual rainfall was the main climatic variable predicting anuran species richness and the number of reproductive modes in the Brazilian localities studied. However, only 23.5% of the total variance of the data was explained by the climatic variables, altitudinal variables and the geographic position of studied localities, whereas only 15.5% was explained solely by climatic and altitudinal variables. These findings suggest that other factors not analysed herein (e.g. habitat heterogeneity, primary productivity, phylogenetic constraints and even stochastic events) may also be important for predicting anuran species richness and the number of reproductive modes throughout the Brazilian territory. In addition to the inclusion of more environmental variables, we strongly recommend the inclusion of new localities in future studies, particularly those located in Brazilian biomes that were insufficiently represented or not included herein, such as the seasonally flooded area of Brazil (the Pantanal) and the north-eastern Brazilian semi-arid region (caatinga).
ACKNOWLEDGEMENTS
The authors are grateful to João Gabriel R. Giovanelli, for support with the software DIVA-GIS, and an anonymous reviewer for comments and suggestions in the first version of the manuscript. This study was supported by FAPESP (Biota/Fapesp proc. 01/13341-3, 02/13602-4, 08/50928-1, and 09/17195-3), CNPq and Capes.
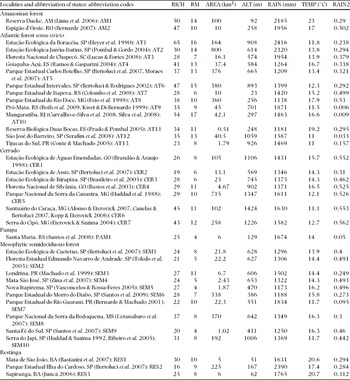
Appendix 1. Predominant phytophysiognomy of the Brazilian localities whose species richness and reproductive modes were considered in the current study (cited references and abbreviations follow after the name of their respective localities). RICH = species richness of each locality; RM = number of reproductive modes in each locality; AREA = total sampled area; ALT = altitude; RAIN = total annual rainfall; TEMP = mean minimum temperature; RAIN2 = measure of concentration of annual rainfall.