1. Introduction
During the Late Cretaceous and Cenozoic, numerous structural entities or basins in central and northern Europe underwent several phases of uplift or inversion (Ziegler, Reference Ziegler1990). The initial or Late Cretaceous ‘Sub-Hercynian’ compressional inversion phase was characterized by narrow uplift of the Mesozoic rifts with strong reverse activation of faults, and the formation of deep marginal troughs in their flanks (de Jager, Reference De Jager2003; Kockel, Reference Kockel2003 and references therein). The subsequent or middle Paleocene ‘Laramide’ phase was characterized by longer-wavelength vertical surface movements, expressed by non-ruptural domal uplifts and the formation of shallow troughs (Nielsen et al. Reference Nielsen, Thomsen, Hansen and Clausen2005). In westernmost Europe, middle Paleocene domal uplift was triggered by upwelling of a mantle plume during the development of the North Atlantic Igneous Province (Meyer, van Wijk & Gernigon, Reference Meyer, van Wijk, Gernigon, Foulger and Jurdy2007 and references therein). Further east of the North Atlantic Igneous Province or in west and central Europe, middle Paleocene domal uplift took place on top of several Late Cretaceous inverted basins, while their distal areas experienced subsidence, and was therefore interpreted as the result of a relaxation inversion (relaxation of in-plane stress after compression; Nielsen et al. Reference Nielsen, Thomsen, Hansen and Clausen2005; Nielsen, Stephenson & Thomsen, Reference Nielsen, Stephenson and Thomsen2007). Deckers (Reference Deckers2015), however, showed that some Late Cretaceous inverted basins subsided, while their distal areas experienced domal uplift during the middle Paleocene phase, in other words the complete opposite vertical surface movements of a relaxation inversion. He therefore introduced lithospheric folding as a possible mechanism in order to explain the vertical surface movements during the Laramide phase. He used the middle Paleocene subsidence of the Late Cretaceous inverted Roer Valley Graben and simultaneous uplift of the distal London–Brabant Massif as his type examples. Middle Paleocene subsidence of the Roer Valley Graben and surrounding areas is indeed well known (Demyttenaere, Reference Demyttenaere1989; Michon et al. Reference Michon, Van Balen, Merle and Pagnier2003; Deckers & Matthijs, Reference Deckers and Matthijs2014; Deckers et al. Reference Deckers, Broothaers, Lagrou and Matthijs2014), but little information exists on the geometry (lateral extent) and precise timing of simultaneous uplift of the London–Brabant Massif. Episodic uplift of the London–Brabant Massif during the early Paleogene was discussed by Vandenberghe et al. (Reference Vandenberghe, Laga, Steurbaut, Hardenbol, Vail, de Graciansky, Hardenbol, Jacquin and Vail1998, Reference Vandenberghe, Van Simaeys, Steurbaut, Jagt and Felder2004), but their timing was not consistent with the entire middle Paleocene range as proposed by Deckers (Reference Deckers2015).
The aim of this study is to combine new insights with available literature data and geological maps in Belgium, the southern Netherlands and southeastern England in order to better comprehend the geometry and timing of middle Paleocene uplift of the London–Brabant Massif. By comparing these results with other data on middle Paleocene vertical surface movements in west and central Europe, we will discuss the most likely mechanism that might have driven them (dynamic support by mantle convection, relaxation inversion or lithospheric folding).
2. Geological background
2.a. Structural entities
The Brabant Massif (Fig. 1) consists of a largely concealed WNW–ESE-directed fold belt that developed during Early Palaeozoic times and is documented in the subsurface of central and north Belgium (Fourmarier, Reference Fourmarier1920; Legrand, Reference Legrand1968; De Vos et al. Reference De Vos, Verniers, Herbosch and Vanguestaine1993; Piessens, Vancampenhout & De Vos, Reference Piessens, Vancampenhout and De Vos2006). It appears as a gently ESE-plunging broad anticlinal structure that consists of lower Palaeozoic strata that were deformed during the Caledonian orogeny. The London Platform in southeast England forms the western continuation of the Brabant Massif in Belgium (Lee et al. Reference Lee, Pharao, Williamson, Green and De Vos1993), which resulted in the often-used term ‘London–Brabant Massif’. Vandenberghe et al. (Reference Vandenberghe, Laga, Steurbaut, Hardenbol, Vail, de Graciansky, Hardenbol, Jacquin and Vail1998, Reference Vandenberghe, Van Simaeys, Steurbaut, Jagt and Felder2004) discuss that the Brabant Massif has experienced repetitive positive and negative vertical surface movements since Palaeozoic times.

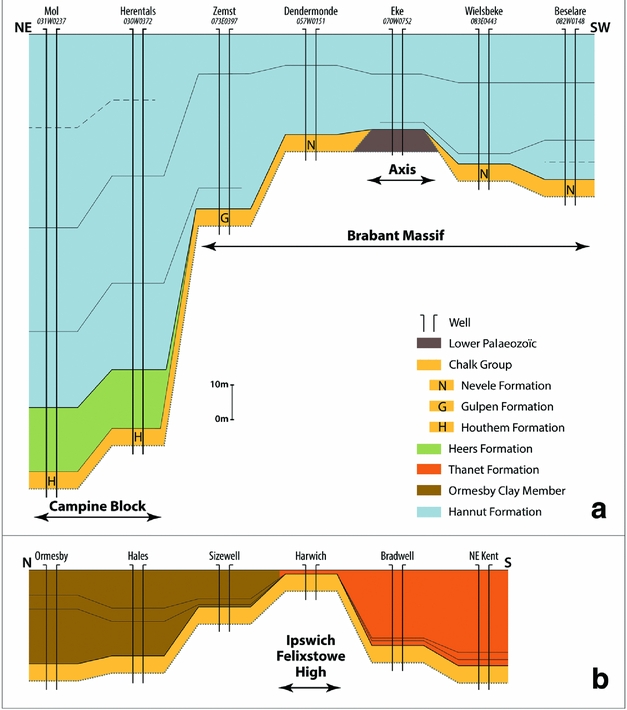
Figure 1. (a) Late Cretaceous and early Paleogene structural setting in central Europe (modified after Nielsen et al. Reference Nielsen, Thomsen, Hansen and Clausen2005; Deckers, Reference Deckers2015). The location of (b) is indicated. (b) Overview map showing the thickness (isopach) of the Chalk Group, the different structural features and entities, the geographic distribution of the Opglabbeek and/or Heers Formations, the correlation panels of Figure 3, the well of Figure 4 and the schematic section of Figure 5 in the study area. The relatively thin deposits of late Maastrichtian and Danian age of the Chalk Group were not included on the presented map. The isopachs of the Chalk Group are extracted from Hennebert (Reference Hennebert1993), Deconinck et al. (Reference Deconinck, Amédro, Baudin, Godet, Pellenard, Robaszynski and Zimmerlin2005), Duin et al. (Reference Duin, Doornenbal, Rijkers, Verbeek and Wong2006) and Rawson (Reference Rawson, Brenchley and Rawson2006), while the structural features in red are extracted from Van Vliet-Lanoë et al. (Reference Van Vliet-Lanoë, Gosselin, Mansy, Bourdillon, Meurisse-Fort, Henriet, Le Roy and Trentesaux2010). BFB = Broad-Fourteens Basin; BM = Brabant Massif; CB = Campine Block; CG = Danish Central Graben; CNB = Central Netherlands Basin; DB = Danish Basin; DCG = Dutch Central Graben; IBA = Ipswich–Brabant Axis; IFH = Ipswich–Felixstowe High; LSB = Lower Saxony Basin; MB = Mons Basin; RVG = Roer Valley Graben; SPB = Sole Pit Basin; STZ = Sorgenfrei–Tornquist Zone; VB =Vlieland Basin; VT = Voorne Trough; VTF = Variscan Trust Front; WB = Weald–Boulonnais Axis; WNB = West Netherlands Basin.
Northeast of the axis of the Brabant Massif or in the Campine Block (Fig. 1b), the lower Palaeozoic strata are covered by a wedge of upper Palaeozoic strata. The upper Palaeozoic strata of the Campine Block are, in turn, covered by a wedge of lower Mesozoic strata that thicken into the Roer Valley Graben (Fig. 1b). The Roer Valley Graben is characterized by repeated episodes of rifting during the Mesozoic (Demyttenaere, Reference Demyttenaere1989; Zijerveld et al. Reference Zijerveld, Stephenson, Cloetingh, Duin and van den Berg1992; Geluk et al. Reference Geluk, Duin, Dusar, Rijkers, van den Berg and van Rooijen1994) that caused separation from the Campine Block by complex border fault systems.
South of the axis of the Brabant Massif, the lower Palaeozoic strata are also overlain by upper Palaeozoic strata. Further south, the upper Palaeozoic strata are overthrusted by lower Palaeozoic strata along the Midi Fault System (Variscan overthrust; Fig. 1b). In the Mons area, these Palaeozoic strata are overlain by an east–west elongated zone with relatively thick Meso- and Cenozoic strata (less than 40 km × 15 km in dimension) that define the Mons Basin (Marlière, Reference Marlière1970; Fig. 1b). The existence of evaporite dissolution in the Palaeozoic basement has been suggested to explain the subsidence process in the Mons Basin (Delmer, Reference Delmer1972), although tectonic activity may have also played a significant role (Dupuis & Vandycke, Reference Dupuis and Vandycke1989).
2.b. Late Cretaceous to late Paleocene stratigraphy
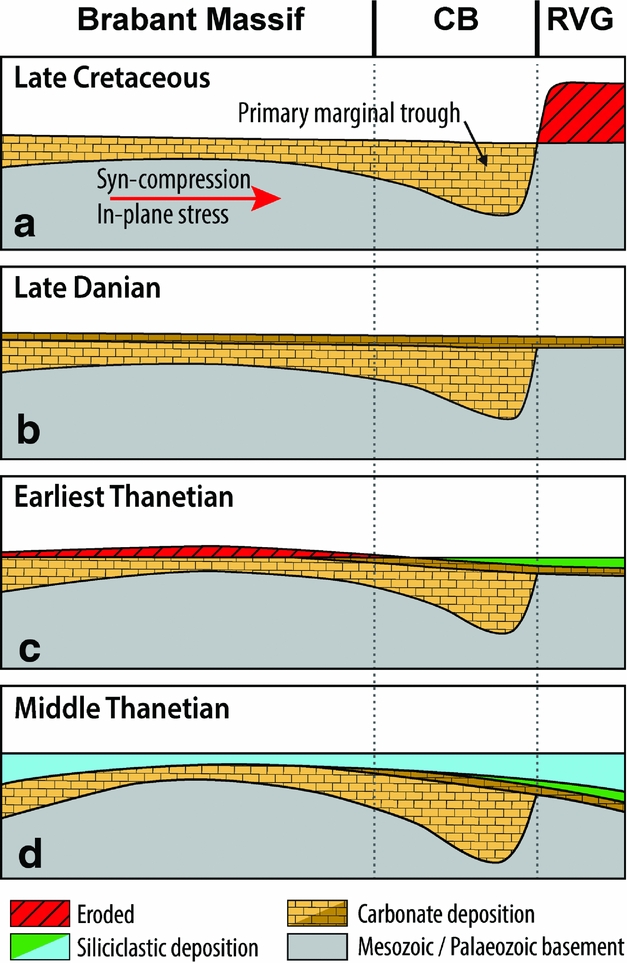
From the Late Cretaceous to late Danian, sedimentation in the North Sea area was dominated by carbonates, which are gathered in the Chalk Group. During the Late Cretaceous deposition of the Chalk Group, the Mesozoic rift basins in central Europe were inverted, while their flanks were simultaneously subjected to subsidence into marginal troughs (de Jager, Reference De Jager2003; Kockel, Reference Kockel2003 and references therein). Among these inverted Mesozoic rift basins were the Roer Valley Graben and West Netherlands Basin, while the Campine Block and Voorne Troughs developed as their southern marginal troughs (Figs 1b, 5a). The simultaneity of inversion of the Roer Valley Graben and subsidence of the Campine Block is evidenced by the progressive increase in clastic sediment input in the Chalk Group that covers the latter in the direction of the former (Bless, Felder & Meessen, Reference Bless, Felder and Meessen1986; Fig. 2). The Brabant Massif was probably a Late Cretaceous relatively high area that was only flooded during the strongest transgressions (Dusar & Lagrou, Reference Dusar and Lagrou2007). Late Cretaceous inversion tectonics ended during the late Maastrichtian, when the region, including the formerly inverted Mesozoic rifts, became covered by late Maastrichtian to late Danian carbonates (Fig. 5b, further below). Danian carbonates probably also covered parts of the Brabant Massif and southeast England before they were removed by erosion (Vandenberghe et al. Reference Vandenberghe, Laga, Steurbaut, Hardenbol, Vail, de Graciansky, Hardenbol, Jacquin and Vail1998; King, Reference King, Brenchley and Rawson2006; Fig. 5b, further below).
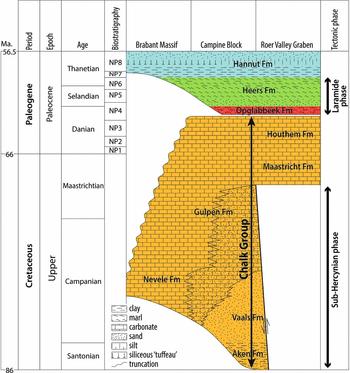
Figure 2. The Late Cretaceous to late Paleocene bio-, chrono- and lithostratigraphic framework and tectonic phases in northern Belgium. The biostratigraphic ages of the different stratigraphic units are based on Vandenberghe et al. (Reference Vandenberghe, Van Simaeys, Steurbaut, Jagt and Felder2004). Notice the increase in stratigraphic break at the top of the Chalk Group from the Campine Block towards the axis of the Brabant Massif (also see Fig. 3).
Regional carbonate deposition came to an abrupt end during the late Danian. This transition coincides with a change in the intra-plate stress field of Europe (Nielsen et al. Reference Nielsen, Thomsen, Hansen and Clausen2005), which started the middle Paleocene Laramide phase that triggered broad subsidence of the Roer Valley Graben and its surrounding regions into a large depocentre (Deckers & Matthijs Reference Deckers and Matthijs2014; Deckers et al. Reference Deckers, Broothaers, Lagrou and Matthijs2014; Fig. 5c, further below). Within this depocentre, the latest Danian (NP4) Opglabbeek and early Selandian to earliest Thanetian (NP4–6) Heers Formations were deposited. The Opglabbeek Formation consists of the multicoloured lignitic silty claystone with intercalated sandy levels of the Opoeteren Clay Member, and the medium to coarse sand(stone)s of the Eisden Sand Member (Steurbaut, Reference Steurbaut1998; Fig. 4, further below). The Heers Formation consists of the fine glauconitic marine sands of the transgressive Orp Sand Member and the shallow-water marls of the highstand Gelinden Marl Member (Steurbaut, Reference Steurbaut1998; Fig. 4, further below). The overlying Maaseik Marly Clay Member, which is formally part of the Hannut Formation, is, for the purpose of this study, included as a separate member within the Heers Formation (Fig. 4, further below). The Opglabbeek and Heers Formations reach their maximum thicknesses of 40 and 63 m in the southern part of the Roer Valley Graben from where they thin towards the west across the Campine Block in the direction of the Brabant Massif (Deckers & Matthijs, Reference Deckers and Matthijs2014; Fig. 3a). South of the Brabant Massif, the Danian limestones in the Mons Basin are covered by equivalent deposits of the Opglabbeek Formation (called Hainin Formation; Steurbaut & Sztrákos, Reference Steurbaut and Sztrákos2008), which shows that it had also developed into a middle Paleocene depocentre (Fig. 1b).

Figure 3. Well correlation panels of the early Selandian to middle Thanetian sequences across the Brabant Massif in central and northern Belgium (a) and across the Ipswich–Felixstowe High along the southeast coast of England (b). Notice how the early to middle Thanetian sequences of the Hannut Formation, Ormesby Clay Member and Thanet Formation thin towards the axes of the Brabant Massif and Ipswich–Felixstowe High. Also notice the increase in stratigraphic break at the top of the Chalk Group from the flanks towards the axis of the Brabant Massif (top Houthem Fm to base Heers Fm in well ‘Mol’ versus top Nevele to base Hannut Fm in well ‘Dendermonde’; see Fig. 2). For location of this correlation panel see Figure 1b. (a) is modified after the well-log correlations of G. De Geyter, K. Welkenhuysen & M. De Ceukelaire (unpub. data, 2010), while (b) is modified after Knox (Reference Knox, Hesselbro and Parkinson1996).
The Heers Formation, Chalk Group and older strata became transgressed and covered during the early to middle Thanetian (NP6–8; Fig. 2) by the marine clays, silts and sands of the Hannut Formation (Figs 2, 3a, 4, 5d). The Hannut Formation generally thins in the direction of the WNW–ESE axis of the Brabant Massif (Vandenberghe et al. Reference Vandenberghe, Laga, Steurbaut, Hardenbol, Vail, de Graciansky, Hardenbol, Jacquin and Vail1998; Fig. 3a). Syn-sedimentary thinning towards the axis of the Brabant Massif had ended roughly in the late Thanetian (in NP8).

Figure 4. The lithostratigraphic and biostratigraphic interpretations of the Paleocene in well 063E0222 (KS 22) at Maaseik, Opoeteren (for location, see Fig. 1b). The lithostratigraphic interpretations are given on the left, the well logs in the centre and the biostratigraphic interpretations on the right. The rightmost column indicates the percentage of reworked Cretaceous nannofossils. Notice the high number (almost 100%) of reworked Cretaceous nannofossils in the Heers Formation. Modified after Steurbaut (Reference Steurbaut1998).

Figure 5. Schematic section at different times across the Brabant Massif, Campine Block (CB) and Roer Valley Graben (RVG). For location see Figure 1b. (a) Geometry after the Late Cretaceous inversion of the Roer Valley Graben and simultaneous subsidence of the Campine Block as its southern marginal trough (i.e. after the Sub-Hercynian phase). (b) Geometry after regional late Maastrichtian to Danian carbonate deposition. (c) Geometry after the middle Paleocene uplift of the Brabant Massif and simultaneous subsidence with deposition (green) in the areas around the Roer Valley Graben. (d) Geometry after the early to middle Thanetian deposition of the Hannut Formation (blue). Modified after Nielsen et al. (Reference Nielsen, Thomsen, Hansen and Clausen2005) and Deckers (Reference Deckers2015).
In the area west of the Brabant Massif, along the southeast coast of England, the Chalk Group was locally unconformably overlain by the latest Selandian to middle Thanetian deposits (NP6–8) of the clayey Ormesby Clay Member and the sandy Thanet Formation (Fig. 3b). Schematic cross-sections of Knox (Reference Knox, Hesselbro and Parkinson1996) and Jolley (Reference Jolley1998) illustrate that the different sequences in the Ormesby Clay Member and Thanet Formation thin towards the Ipswich–Felixstowe High (Jolley, Reference Jolley1992; Fig. 3b). This Ipswich–Felixstowe High is a poorly defined structural axis (by Jolley, Reference Jolley1992) that, just like the Brabant Massif in Belgium, lies on top of and parallel to early Palaeozoic (WNW–ESE) fault trends (Woods, Mortimore & Wood, Reference Woods, Mortimore, Wood and Dixon2012; Fig. 1b). The lower part of the Ormesby Clay Member shows southward onlap onto the structural axis of the Ipswich–Felixstowe High (Jolley, Reference Jolley1998) and comprises a sequence that is not represented to the south in the Thanet Formation (Knox, Hine & Ali, Reference Knox, Hine and Ali1994; Knox, Reference Knox, Hesselbro and Parkinson1996). The upper part of the Ormesby Clay passes southwards into the more proximal facies of the Thanet Formation just north of the Ipswich–Felixstowe High (Jolley, Reference Jolley1992; Ellison et al. Reference Ellison, Knox, Jolley and King1994; Fig. 3b).
3. Indications for middle Paleocene uplift of the Brabant Massif
The lithology, fossil content, thicknesses and geographic distributions of the stratigraphic succession as discussed in the previous paragraph all provide indications for middle Paleocene uplift and erosion of the Brabant Massif. Some of these indications are the following:
-
1. Unlike the areas around the Roer Valley Graben and Mons Basin, the Brabant Massif lacks coverage of the middle Paleocene Opglabbeek and Heers Formations (NP4–6; Fig. 3a). The individual members of the Opglabbeek and Heers Formations thin (by onlap) on top of the Roer Valley Graben, across the Campine Block in the direction of the Brabant Massif (Deckers & Matthijs, Reference Deckers and Matthijs2014; Fig. 3a), which shows that the Brabant Massif was a middle Paleocene relative high.
-
2. The Heers Formation and (to a lesser extent also the top of) the Opglabbeek Formation contain abundant reworked Late Cretaceous chalk and nannofossils (see Vandenberghe et al. Reference Vandenberghe, Laga, Steurbaut, Hardenbol, Vail, de Graciansky, Hardenbol, Jacquin and Vail1998; Steurbaut, Reference Steurbaut1998; Fig. 4). A high content of reworked Late Cretaceous chalk has also been recorded from Selandian deposits in other parts of the North Sea Basin (Clemmensen & Thomsen, Reference Clemmensen and Thomsen2005). The latter authors discuss that the deposition of reworked chalk occurred during a period with transgressive conditions in the North Sea Basin, suggesting that the increase should be attributed to local rather than regional uplift. Thomsen (Reference Thomsen and Nielsen1995), for example, proposed that the influx of reworked chalk in the Selandian marls of the Danish Basin was connected to the inversion of the nearby Sorgenfrei–Tornquist Zone (for location see Fig. 1a; Clemmensen & Thomsen, Reference Clemmensen and Thomsen2005). Deckers (Reference Deckers2015) therefore suggested that the influx of reworked chalk in the Heers Formation was also related to simultaneous uplift of one or more nearby middle Paleocene highs, including the Brabant Massif. The presence of undeformed land-derived leaf impressions and mammals in the Heers Formation in central and north Belgium indeed indicates the nearness of the coast (seeVandenberghe et al. Reference Vandenberghe, Laga, Steurbaut, Hardenbol, Vail, de Graciansky, Hardenbol, Jacquin and Vail1998, De Bast, Steurbaut & Smith, Reference De Bast, Steurbaut and Smith2013) and thereby supports the presence of a nearby source of the reworked material.
-
3. Post-depositional erosion of the Chalk Group is indicated by the varying and locally large stratigraphic break at its top. In Belgium, this stratigraphic break generally increases from the flank towards the axis of the Brabant Massif (Dusar & Lagrou, Reference Dusar and Lagrou2007; see Figs 2, 3). As a result, the Chalk Group generally thins towards the WNW–ESE axis of the Brabant Massif (Fig. 1b). The compilation of thickness maps in Figure 1b illustrates that the thinning of the Chalk Group towards the WNW–ESE axis of the Brabant Massif continued underneath the North Sea in the direction of the southeast coast of England up to roughly the location where the Ipswich–Felixstowe High was identified in the latest Selandian and Thanetian deposits by Jolley (Reference Jolley1992; see indication 4).
One of the major pulses that caused erosion of the top of the Chalk Group in the region took place shortly after its deposition (e.g. Vandenberghe et al. Reference Vandenberghe, Laga, Steurbaut, Hardenbol, Vail, de Graciansky, Hardenbol, Jacquin and Vail1998, Reference Vandenberghe, Van Simaeys, Steurbaut, Jagt and Felder2004; de Jager, Reference De Jager2003, Reference De Jager, Wong, Batjes and De Jager2007; King, Reference King, Brenchley and Rawson2006; Briais et al. Reference Briais, Guillocheau, Lasseur, Robin, Châteauneuf and Serrano2016; Fig. 2). We propose that this pulse took place from the late Danian to earliest Thanetian, based on the lack of deposits from this age interval on top of the axis of the Brabant Massif (see indication 1) and the presence of reworked Late Cretaceous chalks in sediments of this age interval in the depocentres around the Brabant Massif (see indication 2).
-
4. The early to middle Thanetian members of the Hannut Formation (NP7–8) thin from the north and south towards the axis of the Brabant Massif (see Fig. 3a). Along the southeast coast of England, the latest Selandian to middle Thanetian Ormesby Clay Member and Thanet Formation (NP6–8), in their turn, thin towards the axis of the Ipswich–Felixstowe High (Jolley, Reference Jolley1992; Ellison et al. Reference Ellison, Knox, Jolley and King1994; Fig. 3b). This indicates that the latest Danian to earliest Thanetian uplifted axis of the Brabant Massif (from central Belgium up to the southeast coast of England) remained a relative high up to at least the middle Thanetian.
4. Discussion and conclusions
Based on the following arguments it is here concluded that the Brabant Massif (in north and central Belgium) and Ipswich–Felixstowe High (along the southeast coast of England) formed one structural entity, hereafter called the Ipswich–Brabant Axis (Fig. 1). They:
-
• are located on top of and parallel to WNW–ENE Caledonian (early Palaeozoic) fault zones (Fig. 1B);
-
• are lacking latest Danian to earliest Thanetian deposits (NP4–6) on top of their axes and thereby delimit the extent of the surrounding middle Paleocene depocentres (Figs 1b, 3);
-
• show a progressive decrease in the thickness of the Late Cretaceous Chalk Group towards their axes (Fig. 1b) as a result of their middle Paleocene uplift and erosion;
-
• show a progressive decrease in the thickness of the early to middle Thanetian (NP7–8) cover towards their axes (Fig. 3) as a result of their relatively high position during this time range.
From this it follows that the Ipswich–Brabant Axis was uplifted and eroded during the middle Paleocene ‘Laramide phase’ and continued to be relatively high during the early to middle Thanetian. This axis has a narrower definition than the commonly used ‘London–Brabant Massif’ or ‘Anglo-Brabant Massif’.
The preservation of the Chalk Group on top of most of the Ipswich–Brabant Axis and the isopach maps of the Chalk Group (Fig. 1b) indicate that maximum uplift of the axis was only mild (estimated <200 m) during the Laramide phase. Isopach maps of the Chalk Group also indicate that middle Paleocene uplift wasn't caused by strong fault activity (i.e. non-ruptural), but rather by domal uplift of the Ipswich–Brabant Axis (Fig. 5c). Simultaneous with uplift of the Ipswich–Brabant Axis, the surrounding Mons Basin, Campine Block and Roer Valley Graben experienced flexural subsidence into shallow depocentres. These depocentres were filled with the latest Danian to earliest Thanetian (NP4–6) deposits. The simultaneity of uplift and erosion of the Chalk Group with subsidence is recorded in the abundant Late Cretaceous nannofossils in the latest Danian to earliest Thanetian deposits (Fig. 4). In the strongest subsiding parts of the depocentres (or southern part of the Roer Valley Graben) the latest Danian to earliest Thanetian deposits reach total thicknesses of over 100 m (see Deckers et al. Reference Deckers, Broothaers, Lagrou and Matthijs2014). The amplitude of middle Paleocene domal uplift of the Ipswich–Brabant Axis and flexural subsidence of some of the surrounding areas was therefore roughly in the same order. Nielsen et al. (Reference Nielsen, Thomsen, Hansen and Clausen2005), Nielsen, Stephenson & Thomsen (Reference Nielsen, Stephenson and Thomsen2007) and Deckers (Reference Deckers2015) showed how several other basins in western and central Europe experienced vertical surface movements with similar amplitudes and wavelengths during the middle Paleocene Laramide phase.
Middle Paleocene domal uplift of basins or areas in west and/or central Europe has in the past been explained by several processes:
-
• Early Paleogene igneous activity in the North Atlantic Igneous Province was accompanied by domal uplift of regions in westernmost Europe. The start and duration of middle Paleocene uplift of the Ipswich–Brabant Axis as established by this study indeed coincides with the development of the North Atlantic Igneous Province and the duration of its first sub-phase of igneous activity (NP4–6; Saunders et al. Reference Saunders, Fitton, Kerr, Norry, Kent, Mahoney and Coffin1997; Jolley & Bell, Reference Jolley, Bell and Jolley2002). Although limited amounts of uplift took place during the first sub-phase in the vicinity of the igneous centres, widespread, kilometre-scale uplift did not develop until the second sub-phase in the latest Paleocene (Maclennan & Jones, Reference Maclennan and Jones2006). The lack of nearby igneous centres (see fig. 7 of Saunders et al. Reference Saunders, Jones, Morgan, Pierce, Widdowson and Xu2007) thus makes it unlikely that middle Paleocene uplift of the Ipswich–Brabant Axis was the result of topographic swell by igneous activity during the development of the North Atlantic Igneous Province. The WNW–ESE orientation of the Ipswich–Brabant Axis is furthermore almost perpendicular to the orientation of the long axis of the uplifted swells (roughly NNE–SSW; fig. 2 of Maclennan & Jones, Reference Maclennan and Jones2006).
-
• Middle Paleocene relaxation of in-plane stress would cause a decrease in lithospheric flexure or domal uplift (i.e. relaxation inversion) of numerous basins in west and central Europe after their Late Cretaceous compressional inversion (and over-deepening of the lithosphere flexure; Nielsen et al. Reference Nielsen, Thomsen, Hansen and Clausen2005; Nielsen, Stephenson & Thomsen, Reference Nielsen, Stephenson and Thomsen2007). The model of a relaxation inversion can indeed explain middle Paleocene domal uplift of several Late Cretaceous inverted basins in west and central Europe (such as the Lower Saxony and Vlieland Basins, the Sorgenfrei–Tornquist Zone and Weald–Boulonnais Axis; Nielsen et al. Reference Nielsen, Thomsen, Hansen and Clausen2005), but fails to explain the subsidence of others (such as the Roer Valley Graben and Central Netherlands Basin; Deckers, Reference Deckers2015). The Ipswich–Brabant Axis furthermore did not experience strong Late Cretaceous inversion, which makes relaxation inversion an unlikely mechanism to explain its middle Paleocene domal uplift.
-
• Lithospheric folding or buckling under a NE–SW compressional direction (in response to E–W opening of the Atlantic Ocean and N–S Alpine collision) could also have triggered middle Paleocene domal uplift and simultaneous flexural subsidence of areas in west and central Europe (Deckers, Reference Deckers2015). Indeed, those basins that are known to have undergone middle Paleocene domal uplift (such as Lower Saxony and Vlieland Basins, the Sorgenfrei–Tornquist Zone, Ipswich–Brabant and Weald–Boulonnais Axes) have similar (Caledonian) orientations of their main structural grain (NW–SE or WNW–ESE) and could therefore have been inverted under a NE–SW to NNE–SSW direction of compression. In support of this theory, the easternmost part of the Brabant Massif (located in eastern Belgium) that is characterized by SW–NE-oriented Caledonian fabric (Sintubin, Reference Sintubin1997) was not uplifted into a high during the Laramide phase (as indicated by its middle Paleocene cover). Lithospheric folding furthermore explains the similar amplitudes of vertical surface movements (domal uplift and flexural subsidence) in the study area. Also south of the study area in the Paris Basin, Late Cretaceous to Lower Eocene deformation was suggested to result from lithosphere buckling in response to a N–S to NNE–SSW compression (Guillocheau et al. Reference Guillocheau, Robin, Allemand, Bourquin, Brault, Dromart, Friedenberg, Garcia, Gaulier, Gaumet, Grosdoy, Hanot, Le Strat, Mettraux, Nalpas, Prijac, Rigollet, Serrano and Grandjean2000).
Contrary to the Ipswich–Brabant Axis, several other middle Paleocene highs, such as the Lower Saxony and Vlieland Basins and the Weald–Boulonnais Axis, experienced differential subsidence/rifting, followed by (strong) inversion during the Mesozoic (Betz et al. Reference Betz, Fuhrer, Greiner and Plein1987; de Jager, Reference De Jager2003; Mansy et al. Reference Mansy, Manby, Averbuch, Everaerts, Bergerat, Van Vliet-Lanoe and Lamarche2003). Mesozoic differential subsidence/rifting and inversion had a strong influence on the basin strengths and presumably resulted in overall lower strength compared to those of the Palaeozoic massifs (Cloetingh & van Wees, Reference Cloetingh and Van Wees2005) such as the Ipswich–Brabant Axis. Since the Laramide phase was thought to be closely related to lithospheric processes (Nielsen et al. Reference Nielsen, Thomsen, Hansen and Clausen2005; Nielsen, Stephenson & Thomsen, Reference Nielsen, Stephenson and Thomsen2007; Deckers, Reference Deckers2015; lithospheric folding in this study), it is remarkable that structural entities with distinctly different Mesozoic tectonic evolutions (and related lithospheric strengths) showed very similar responses (vertical surface movements) to this phase.
Acknowledgements
We gratefully acknowledge financial support from the Land and Soil Protection, Subsoil, and Natural Resources Division of the Flemish Government. We would like to thank K. van Baelen for her excellent work on the figures. We would also wish to thank J. de Jager and an anonymous reviewer for their helpful reviews and recommendations that led to further improvements to the manuscript.