I. INTRODUCTION
Oxybutynin hydrochloride (brand names Cystrin, Ditropan, Dridase, Kentera, Pollakisu, Tropax, and others) is used for the treatment of urinary incontinence. Oxybutyin hydrochloride belongs in the class of antispasmodics and works by relaxing the bladder muscles and reducing urination urge and frequency. The systematic name (CAS Registry number 1508-65-2) is 4-diethylamino-2-butynyl-phenylcyclohexylglycolate hydrochloride. A two-dimensional molecular diagram of oxybutynin hydrochloride is shown in Figure 1.

Figure 1. The molecular structure of oxybutynin hydrochloride.
Powder data for oxybutynin free base are reported in Ray et al. (Reference Ray, Sethi, Mahajan and Tyagi2013). A powder pattern for oxybutynin hydrochloride is contained in Nakamichi et al. (Reference Nakamichi, Izumi and Yasuura1997). The powder pattern and other physical properties of (S)-oxybutynin hydrochloride are reported in Luner et al. (Reference Luner, Kirsch, Majuru, Oh, Joshi, Wurster and Redmon2001).
This work was carried out as part of a project (Kaduk et al., Reference Kaduk, Crowder, Zhong, Fawcett and Suchomel2014) to determine the crystal structures of large-volume commercial pharmaceuticals, and include high-quality powder diffraction data for them in the Powder Diffraction File (Fawcett et al., Reference Fawcett, Kabekkodu, Blanton and Blanton2017).
II. EXPERIMENTAL
Oxybutynin hydrochloride was a commercial regent, purchased from United States Pharmacopeial Convention (Lot #R039X0), and was used as-received. The white powder was packed into a 1.5 mm diameter Kapton capillary, and rotated during the measurement at ~50 Hz. The powder pattern was measured at 295 K at beam line 11-BM (Lee et al., Reference Lee, Shu, Ramanathan, Preissner, Wang, Beno, Von Dreele, Ribaud, Kurtz, Antao, Jiao and Toby2008; Wang et al., Reference Wang, Toby, Lee, Ribaud, Antao, Kurtz, Ramanathan, Von Dreele and Beno2008) of the Advanced Photon Source at Argonne National Laboratory using a wavelength of 0.457667 Å from 0.5–50°2θ with a step size of 0.001° and a counting time of 0.1 s/step. The beamline staff indicated that the sample showed some beam damage, with the strongest peaks shifting to lower angles and getting slightly broader. The pattern was difficult to index, ultimately because we did not search for large-enough unit cells. The successful strategy was to use DICVOL (Louër and Boultif, Reference Louër and Boultif2007) as incorporated into FOX (Favre-Nicolin and Černý, Reference Favre-Nicolin and Černý2002), with the options of “weak diffraction” and “centered cells”. The pattern was indexed on a body-centered monoclinic unit cell having a = 14.571, b = 8.186, c = 37.157 Å, β = 91.89°, V = 4429 Å3, and Z = 8. Analysis of the systematic absences suggested the space group I2/a, which was confirmed by successful solution and refinement of the structure. A reduced cell search in the Cambridge Structural Database (Groom et al., Reference Groom, Bruno, Lightfoot and Ward2016) combined with the chemistry “C H N O only” yielded 30 hits, but no structure containing oxybutynin.
An oxybutynin cation was built using Spartan ‘16 (Wavefunction, 2017), and its equilibrium conformation determined. The resulting .mol2 file was converted into a Fenske-Hall Z-matrix file using OpenBabel (O'Boyle et al., Reference O'Boyle, Banck, James, Morley, Vandermeersch and Hutchison2011). The structure was solved using oxybutynin and Cl fragments with both FOX (Favre-Nicolin and Černý, Reference Favre-Nicolin and Černý2002) and DASH (David et al., Reference David, Shankland, van de Streek, Pidcock, Motherwell and Cole2006); both programs yielded the identical structure. The structure contained a void on a twofold axis, positioned ideally to be occupied by a water molecule acting as a hydrogen bond donor to two chloride anions. The structure was also solved by direct methods using EXPO2014 (Altomare et al., Reference Altomare, Cuocci, Giacovazzo, Moliterni, Rizzi, Corriero and Falcicchio2013). Although default direct methods were not successful, application of the COVMAP option to all 20 solutions yielded (in ~8 h of computing time) the complete structure, including the oxygen atom of the water molecule. Despite no mention in the literature, oxybutynin hydrochloride crystallizes as a hemihydrate.
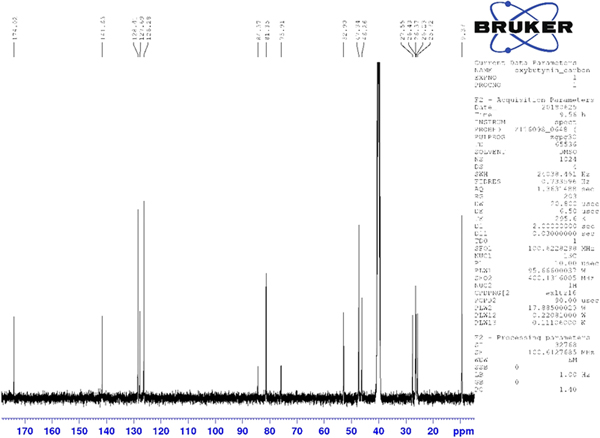
Thermogravimetric analysis indicated that the sample contained 1.2 wt% water, instead of the 2.2% expected from the hemihydrate. Perhaps the hydrate is non-stoichiometric, though the crystallography indicates full occupancy. Analysis using 1H and 13C NMR of oxybutynin hydrochloride was used to verify the structure of the molecule. Spectra were acquired on a Bruker Avance III HD spectrometer as a solution in dimethyl sulfoxide-d6 at 400 and 101 MHz for the 1H and 13C spectra, respectively. Assignment of the 13C spectrum was performed using two-dimensional HSQC and HSQC-TOCSY experiments.
Rietveld refinement was carried out using GSAS (Toby, Reference Toby2001; Larson and Von Dreele, Reference Larson and Von Dreele2004). Only the 1.0–27.0° 2θ portion of the pattern was included in the refinement (d min = 0.980 Å), with an excluded region 1.5–2.0° 2θ to eliminate a relatively sharp peak from the Kapton capillary. All non-H bond distances and angles were subjected to restraints, based on a Mercury/Mogul Geometry Check (Bruno et al., Reference Bruno, Cole, Kessler, Luo, Motherwell, Purkis, Smith, Taylor, Cooper, Harris and Orpen2004; Sykes et al., Reference Sykes, McCabe, Allen, Battle, Bruno and Wood2011) of the molecule. The Mogul average and standard deviation for each quantity were used as the restraint parameters. The phenyl ring C2–C7 was restrained to be planar. The restraints contributed 3.3% to the final χ 2. The U iso of the non-H atoms were grouped by chemical similarity. The U iso of each hydrogen atom was fixed at 1.3× that of the heavy atom to which it was attached. The peak profiles were described using profile function #4 (Thompson et al., Reference Thompson, Cox and Hastings1987; Finger et al., Reference Finger, Cox and Jephcoat1994), which includes the Stephens (Reference Stephens1999) anisotropic strain broadening model. The background was modeled using a three-term shifted Chebyshev polynomial, with a six-term diffuse scattering function to model the Kapton capillary and any amorphous component. The final refinement of 122 variables using 25602 observations (25539 data points and 63 restraints) yielded the residuals R wp = 0.0909, R p = 0.0720, and χ 2 = 3.251. The largest peak (1.52 Å from H52) and hole (1.04 Å from H53) in the difference Fourier map were 0.57 and −0.54 eÅ−3, respectively, and occur in one of the ethyl groups. The Rietveld plot is included as Figure 2. The largest errors in the fit are in the positions and shapes of some of the low-angle peaks, and probably reflect specimen damage.
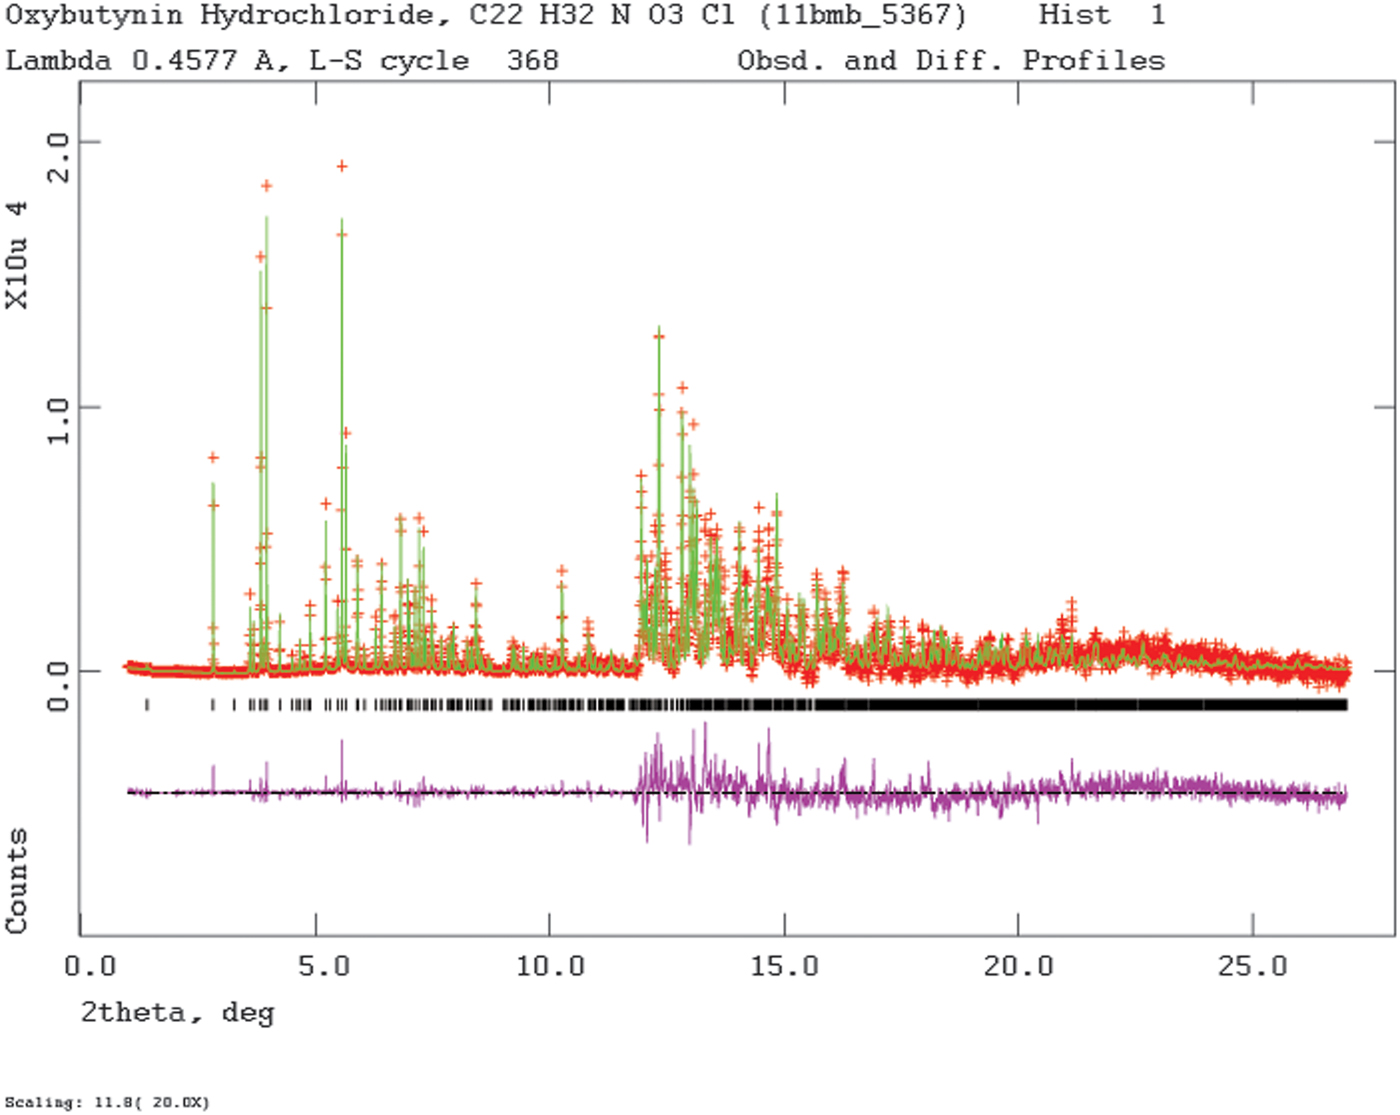
Figure 2. (Color online) The Rietveld plot for the refinement of oxybutynin hydrochloride hemihydrate. The red crosses represent the observed data points, and the green line is the calculated pattern. The magenta curve is the difference pattern, plotted at the same vertical scale as the other patterns. The row of black tick marks indicates the calculated reflection positions. The vertical scale has been multiplied by a factor of 20 for 2θ>11.8°.
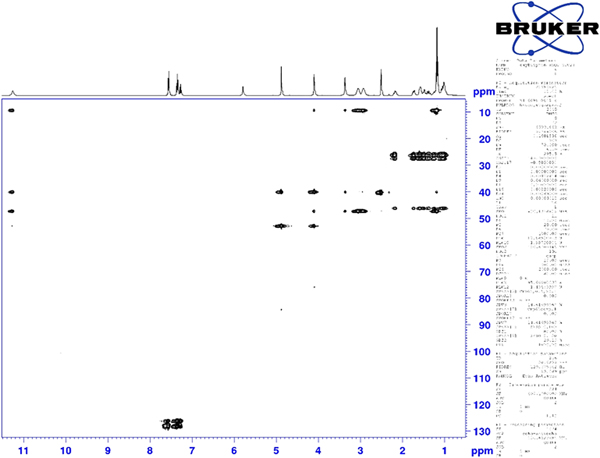
Although the statistical and graphical residuals were reasonable, examining the geometry of the refined molecule showed that it was unusual. The C37–C38 triple bond distance refined to 1.357 Å instead of the expected 1.19 Å, and the C34–C37–C38 angle was 135.1° instead of the expected 173°. Both of these features suggested that the triple bond has (at least partially) been hydrogenated to a double bond. Re-starting the refinement from the DFT-optimized structured yielded the same “bent” molecule. The same “bent” structure was obtained from a refinement using laboratory MoKα data. NMR analysis indicates that the sample used for diffraction did initially contain a triple bond at the C37–38 position. Specifically, as shown in Figure 4, the 1H NMR resonances of the protons on C34 and C39 which are adjacent to the C37–38 triple bond (at 4.88 and 4.10 ppm, respectively) are unsplit, indicating a lack of coupled proton neighbors. Additionally, the chemical shifts of these resonances are typical for methylene groups adjacent to both a triple bond and an electronegative heteroatom. Moreover, the 13C NMR spectrum, as shown in Figure 5 shows the resonances of C37 and C38 (84.3 and 75.9 ppm, respectively) are typical for those of alkynes. The identity of the carbon resonances for C37 and C38 was determined using two-dimensional HSQC and HSQC-TOCSY experiments (Figures 6 and 7).

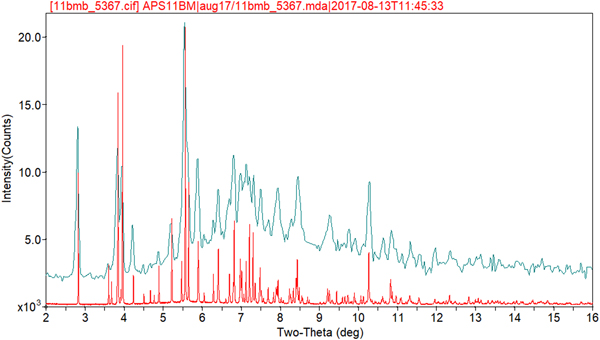
Figure 3. (Color online) Comparison of the synchrotron powder diffraction pattern to the laboratory X-ray powder diffraction pattern of European Patent 0580860 B1 (Nakamichi et al., Reference Nakamichi, Izumi and Yasuura1997; Nippon Shinyaku). The literature pattern (measured using CuKα radiation) was digitized using UN-SCAN-IT (Silk Scientific, 2013), and re-scaled to the synchrotron wavelength of 0.457667 Å using Jade 9.8 (MDI, 2017).

Figure 4. (Color online) 1H NMR (400 MHz, DMSO-d6) spectrum of oxybutynin hydrochloride. The un-split resonances at 4.9 and 4.1 ppm arise from the protons on C34 and C39, respectively.
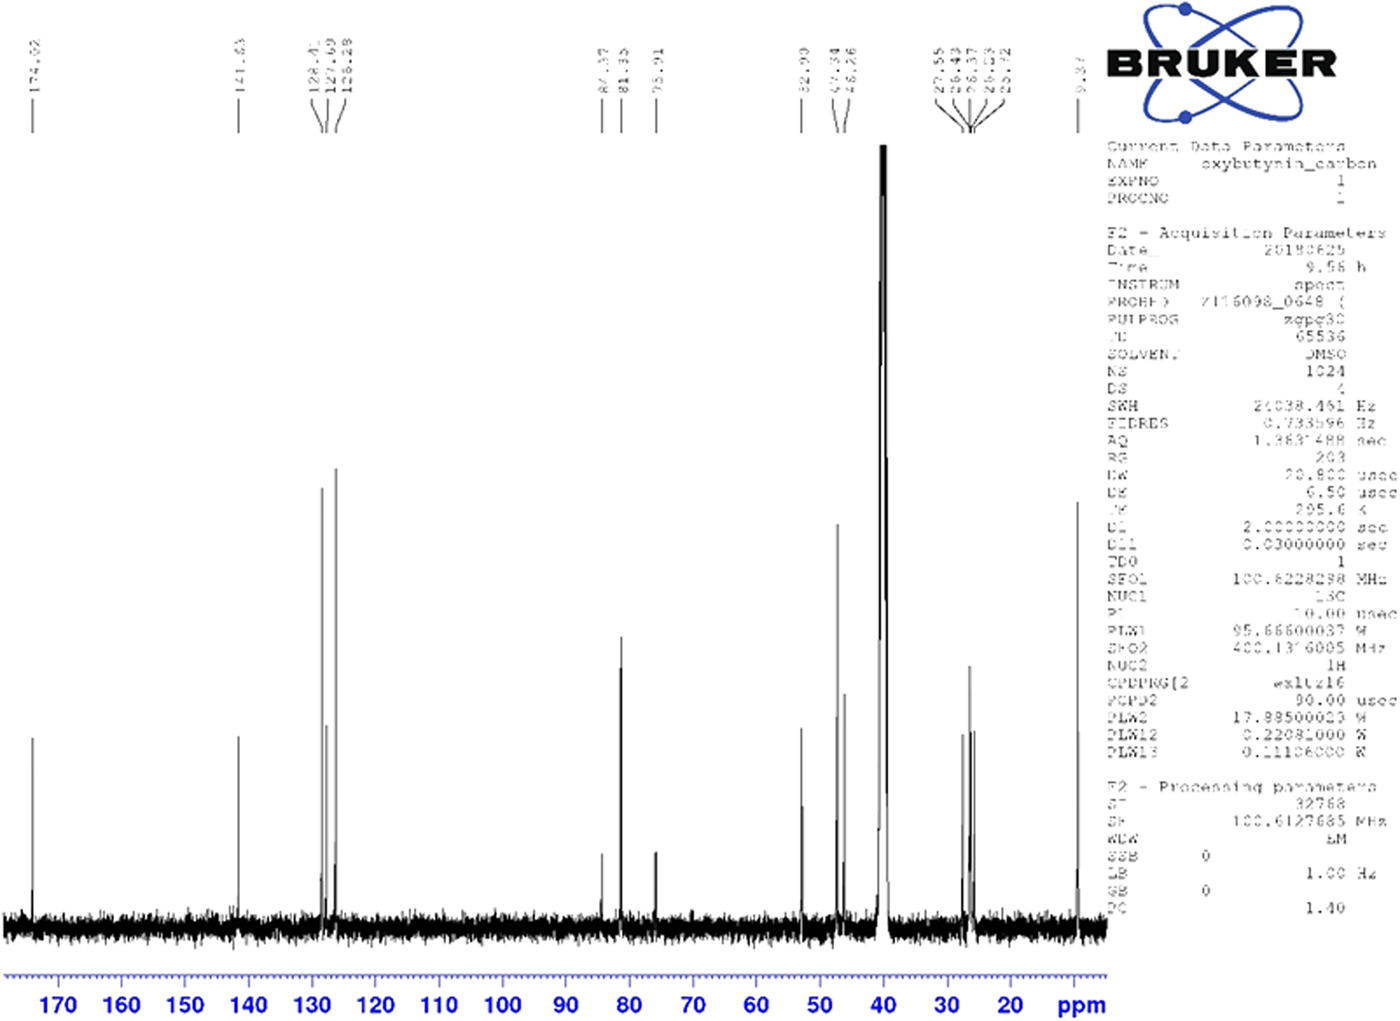
Figure 5. (Color online) 13C NMR (101 MHz, DMSO-d6) spectrum of oxybutynin hydrochloride. The resonances at 84.3 and 75.9 ppm arise from the C37 and C38 triple bond. These assignments were made using a two-dimensional HSQC-TOCSY experiment.
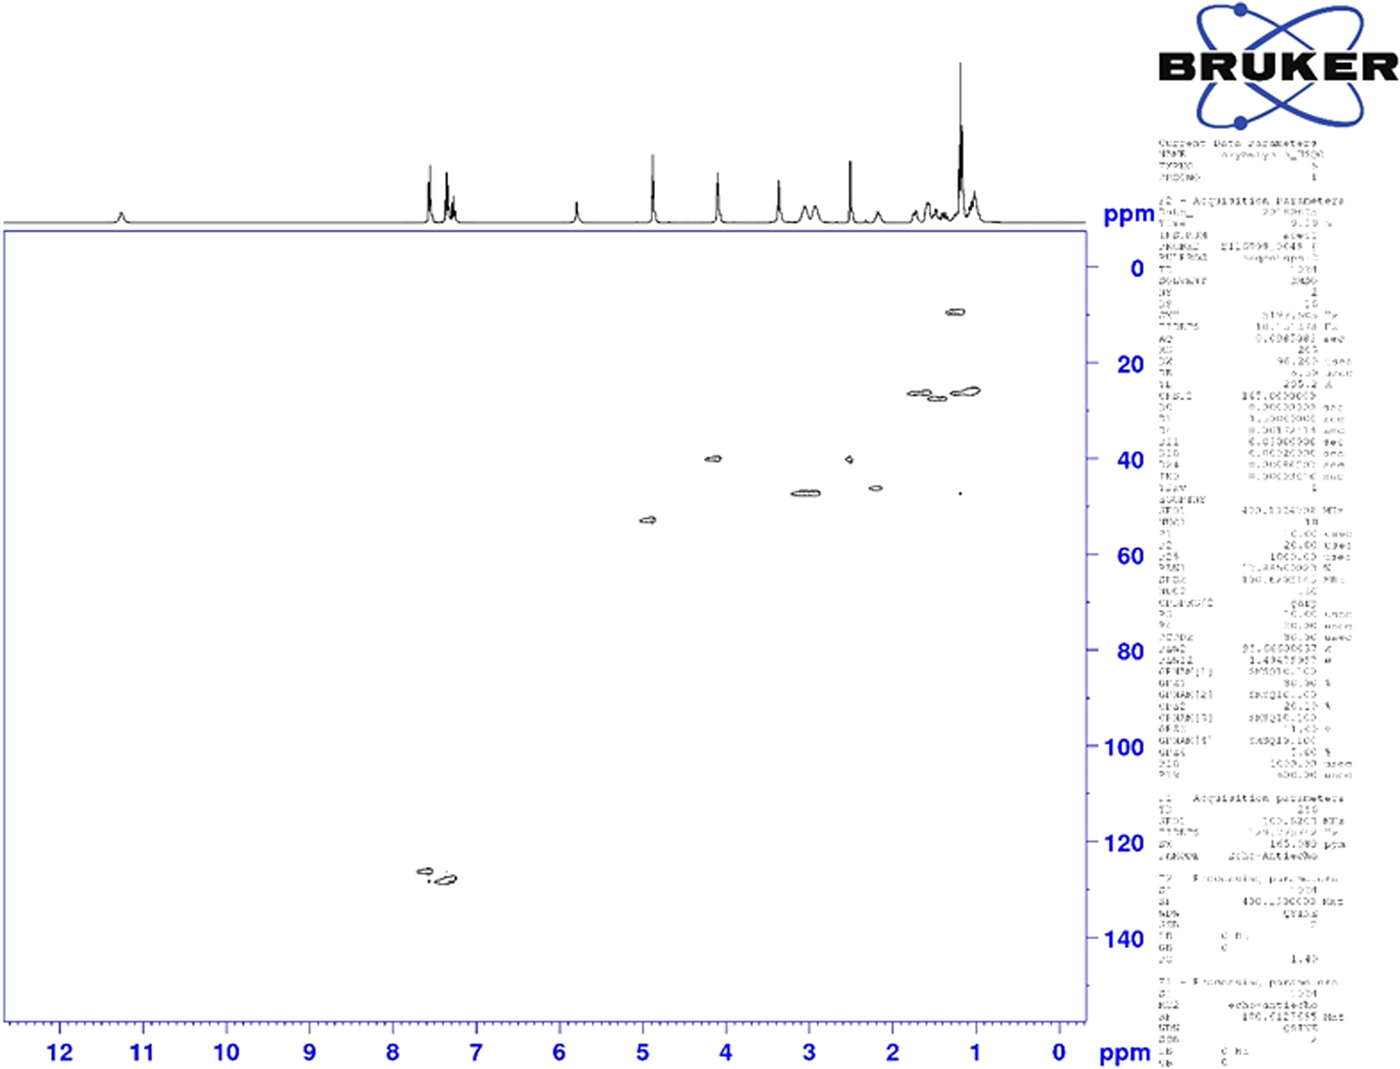
Figure 6. (Color online) Two-dimensional HSQC NMR spectrum of oxybutynin (DMSO-d6) used to assign the 13C resonances of C34 and C39.
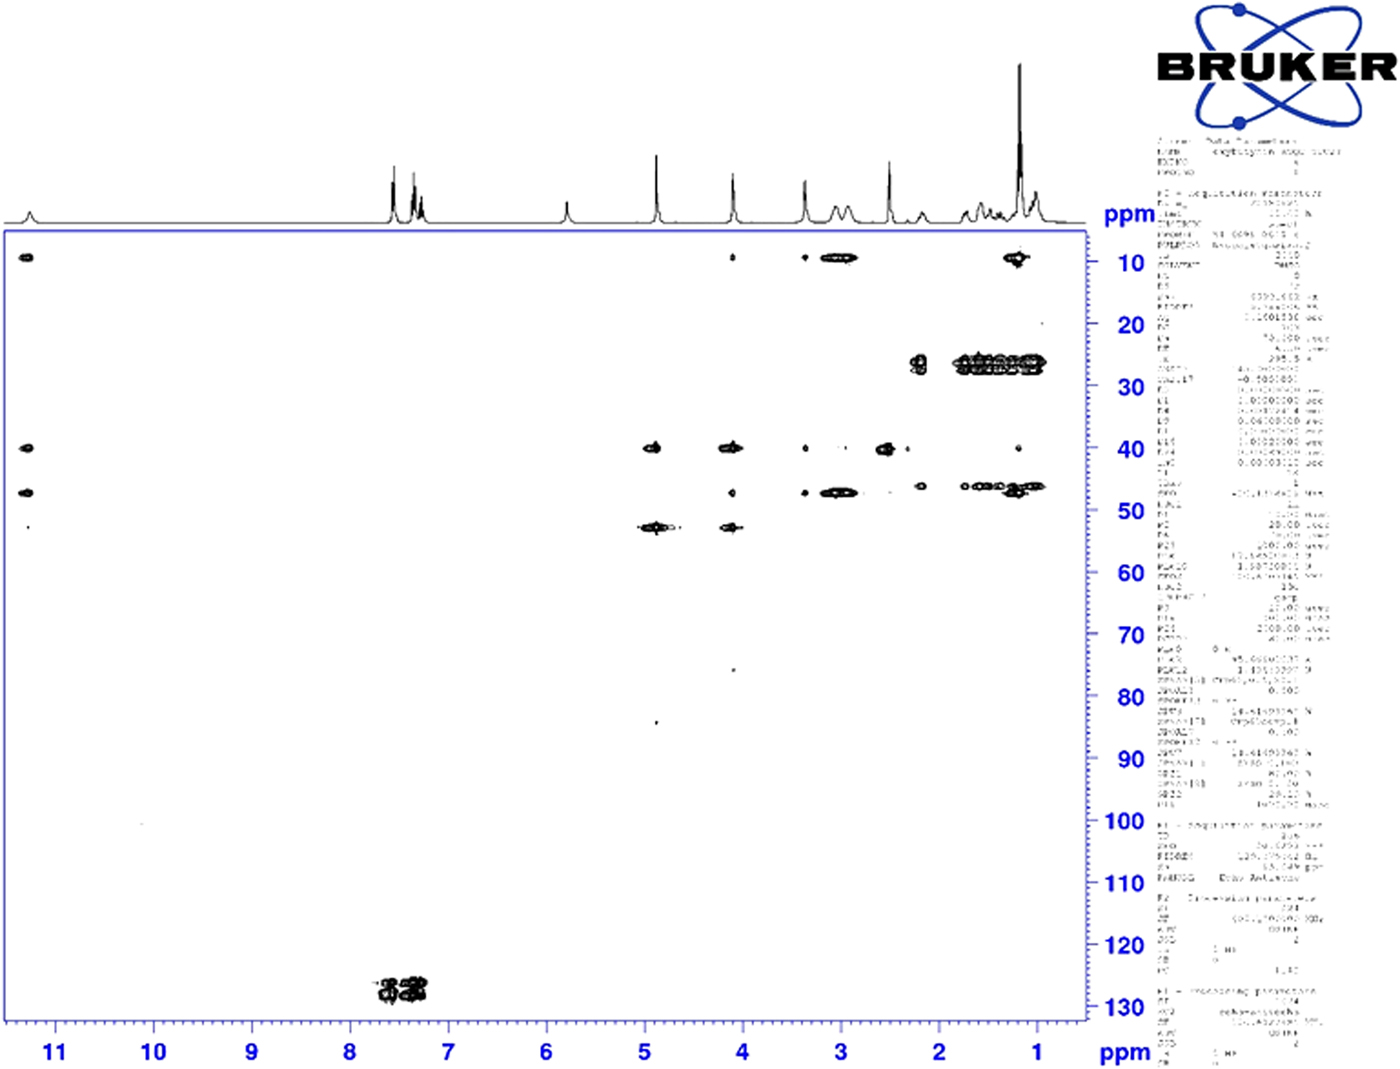
Figure 7. (Color online) Two-dimensional HSQC-TOCSY NMR spectrum of oxybutynin (DMSO-d6) used to assign the 13C resonances of C37 and C38.
Density functional geometry optimizations (fixed experimental unit cell) were carried out using CRYSTAL14 (Dovesi et al., Reference Dovesi, Orlando, Erba, Zicovich-Wilson, Civalleri, Casassa, Maschio, Ferrabone, De La Pierre, D-Arco, Noël, Causà and Kirtman2014), both for the expected molecule and the photoreduced version. The basis sets for the H, C, N, O, and Cl atoms were those of Peintinger et al. (Reference Peintinger, Vilela Oliveira and Bredow2013). The calculations were run on eight 2.1 GHz Xeon cores (each with 6 GB RAM) of a 304-core Dell Linux cluster at IIT, used 8 k-points and the B3LYP functional, and took ~9 and 5 days, respectively.
III. RESULTS AND DISCUSSION
The powder pattern of oxybutynin hydrochloride hemihydrate is similar enough to that of “oxybutynin hydrochloride” from Nakamichi et al. (Reference Nakamichi, Izumi and Yasuura1997) to conclude that they are the same substance (Figure 3). We have not found in the literature a mention that this compound is a hemihydrate. As expected, the powder pattern of the (S) enantiomorph reported by Luner et al. (Reference Luner, Kirsch, Majuru, Oh, Joshi, Wurster and Redmon2001) is very different from that of racemic oxybutynin hydrochloride hemihydrate reported here. The refined atom coordinates of oxybutynin hydrochloride hemihydrate and the coordinates from the DFT optimizations of the molecules containing a triple and a double bond are reported in the CIFs attached as Supplementary Material. The root-mean-square Cartesian displacement of the non-hydrogen atoms in the oxybutynin cations is 0.363 Å (Figure 8). The largest deviation is 0.9080 Å at C37, the site of the apparent photoreduction. The agreement between the refined and optimized structures is at the upper end of the range of correct powder structures (van de Streek and Neumann, Reference van de Streek and Neumann2014), but the photoreduction complicates interpretation of this measure. This discussion uses the DFT-optimized structure. The asymmetric unit (with atom numbering) is illustrated in Figure 9, and the crystal structure is presented in Figure 10.
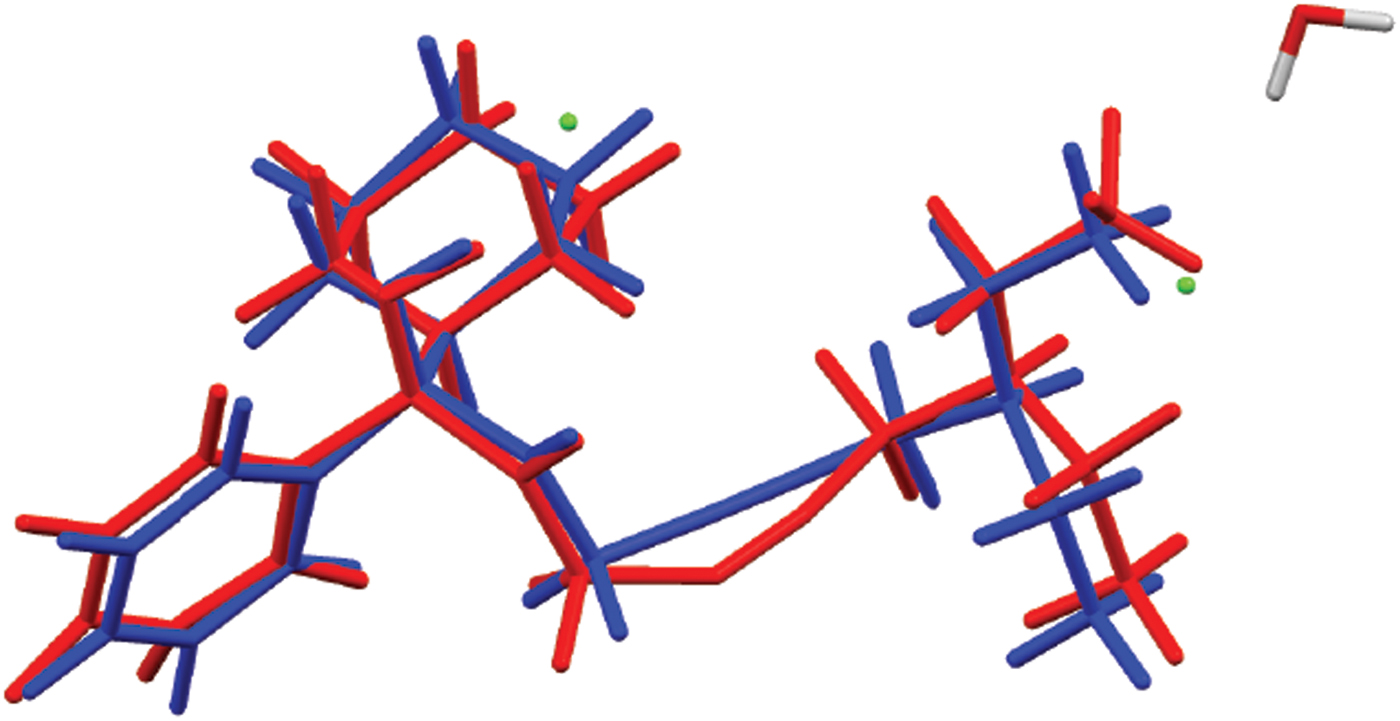
Figure 8. (Color online) Comparison of the refined and optimized structures of the cation in oxybutynin hydrochloride hemihydrate. The Rietveld refined structure is in red, and the DFT-optimized structure is in blue.
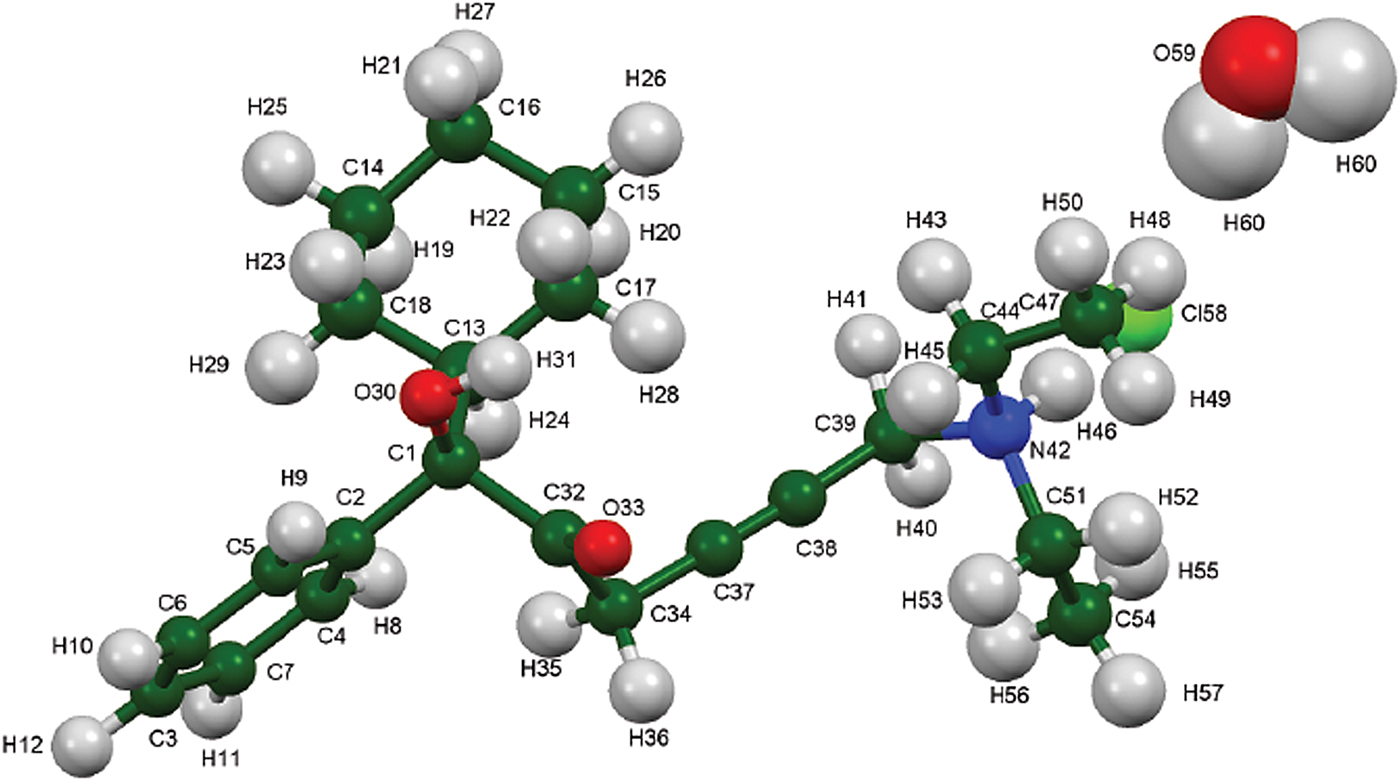
Figure 9. (Color online) The asymmetric unit of oxybutynin hydrochloride hemihydrate, with the atom numbering. The atoms are represented by 50% probability spheroids.
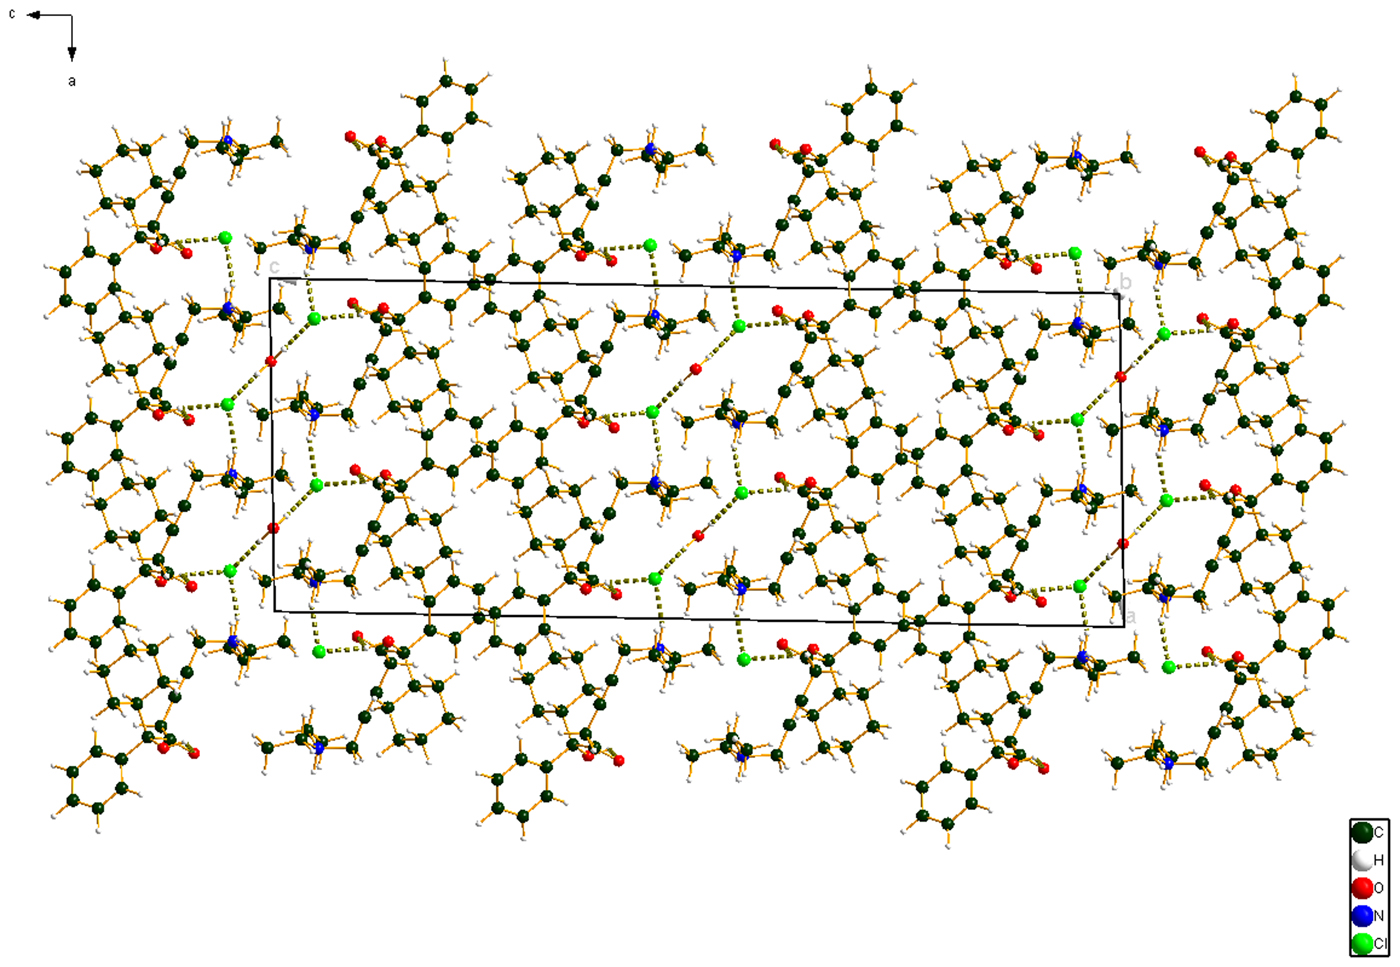
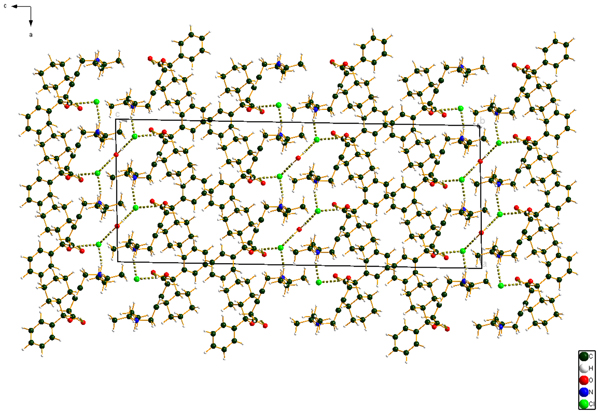
Figure 10. (Color online) The crystal structure of oxybutynin hydrochloride hemihydrate, viewed down the b-axis.
The DFT-optimized structures of oxybutynin hydrochloride hemihydrate and the photoreduced version are similar (Figure 11). The reduction of the triple bond is easily accommodated, with minimal displacements of the other atoms of the molecule.
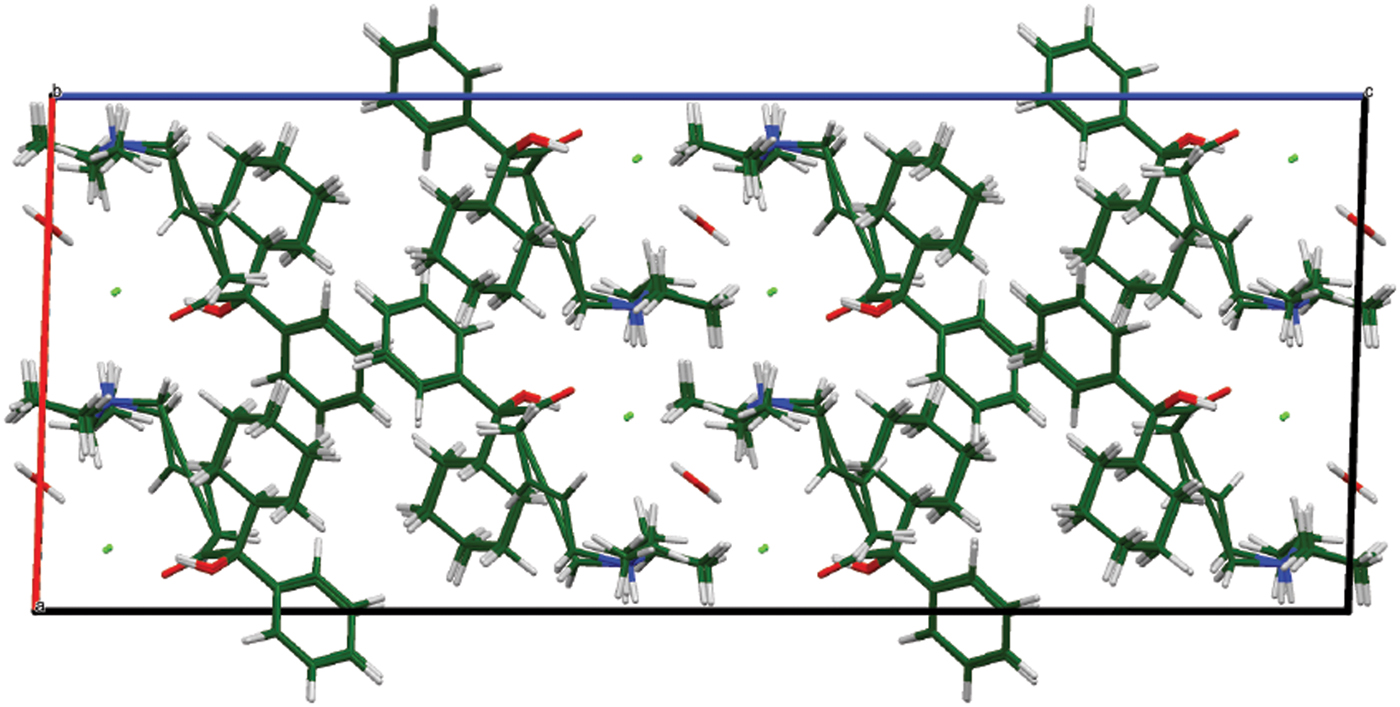
Figure 11. (Color online) The crystal structures of oxybutynin hydrochloride hemihydrate and its photoreduced version, viewed down the b-axis.
All of the bond distances and bond angles fall within the normal ranges indicated by a Mercury Mogul Geometry check (Macrae et al., Reference Macrae, Bruno, Chisholm, Edington, McCabe, Pidcock, Rodriguez-Monge, Taylor, van de Streek and Wood2008). The torsion angles involving rotation of the C32–C34 bond are flagged as unusual, but they are not unprecedented; the O33–C32–C34–C37 torsion angle of 83.09° is compared with the Mogul distribution in Figure 12. There are few examples of the types of torsion angles which involve the two portions of the oxybutynin cation, so it may not be a surprise that unusual torsion angles are observed.
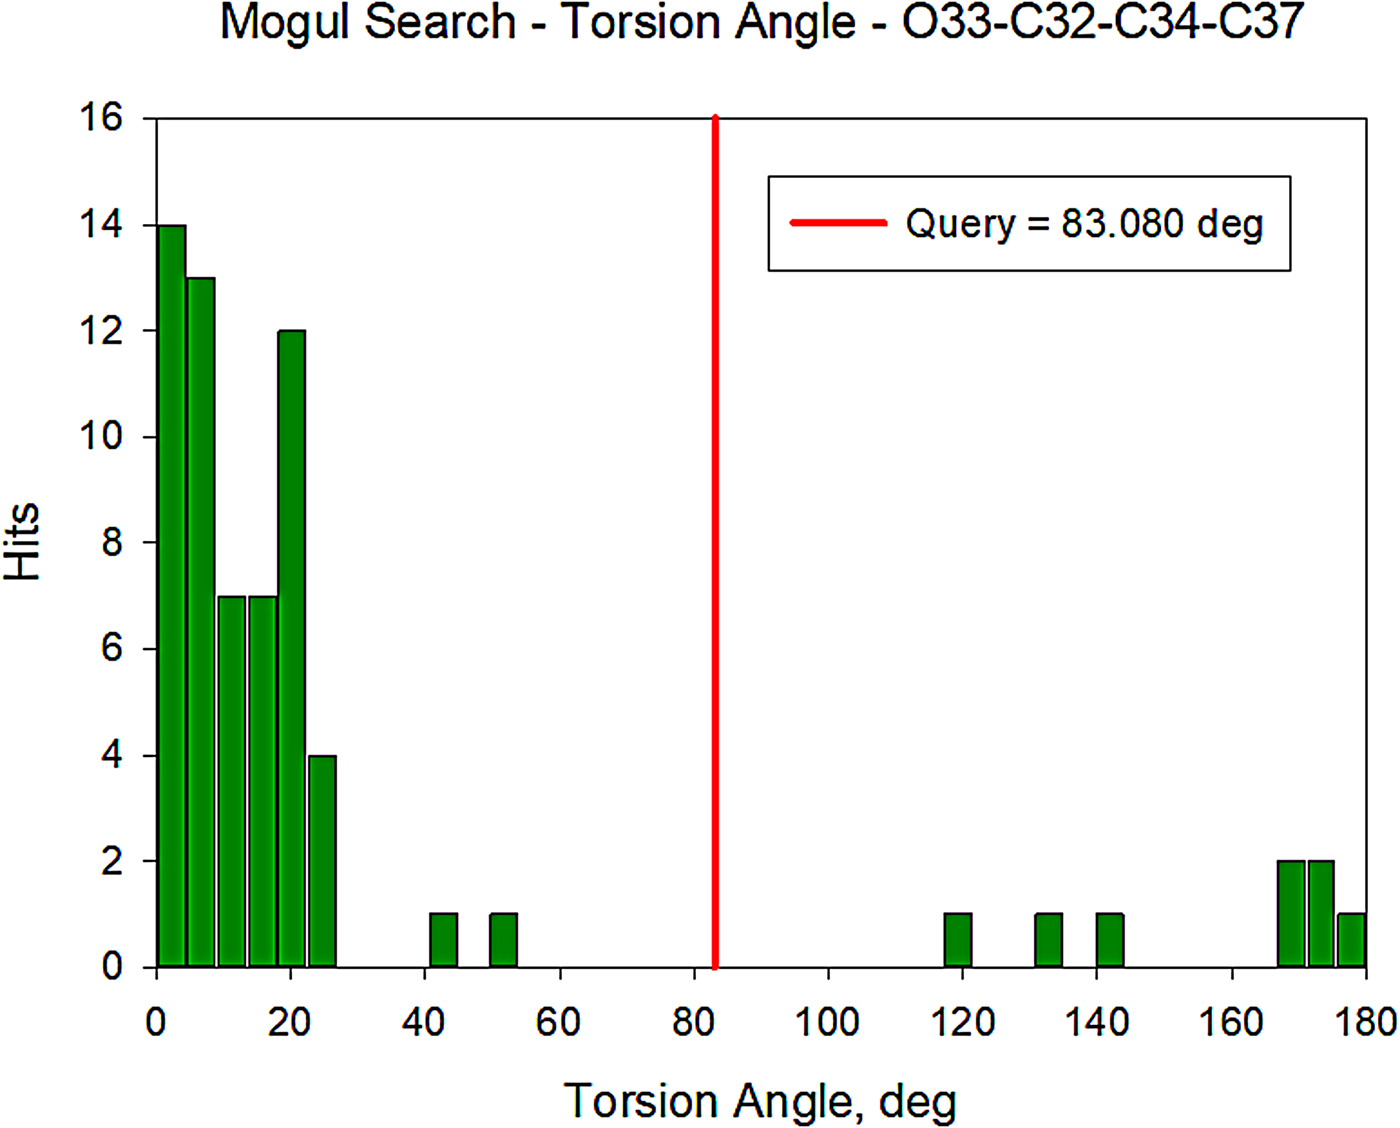
Figure 12. (Color online) Distribution of the O33–C32–C34–C37 torsion angles in the Cambridge Structural Database.
Quantum chemical geometry optimizations (DFT/B3LYP/6-31G*/water) using Spartan ‘16 (Wavefunction, 2017) indicated that the observed conformation of the oxybutynin cation is 9.8 kcal/mole higher in energy than the local minimum energy conformation. The rms Cartesian displacement is 1.078 Å, and there are many differences in conformation. Molecular mechanics conformational analysis indicated that the global minimum energy conformation (−1.9 kcal/mole) differs from the observed conformation by a 120° rotation of the cationic end of the molecule, and thus that intermolecular interactions are important in determining the solid-state conformation.
The cation–anion interactions and hydrogen bonds result in a double-layer structure, with the layers parallel to the ab plane. The layers are separated by hydrocarbon–hydrocarbon contacts. Analysis of the contributions to the total crystal energy using the Forcite module of Materials Studio (Dassault, 2018) suggests that angle, bond, and torsion distortion terms are significant in the intramolecular deformation energy. The intermolecular energy contains significant contributions from van der Waals attractions and electrostatic repulsions. In this force-field-based analysis, the electrostatic interactions include hydrogen bonds. The hydrogen bonds are better analyzed using the results of the DFT calculation.
As expected, the discrete N–H⋅⋅⋅Cl hydrogen bond between the cation and anion is prominent in the crystal structure (Table I). The Cl also acts as an acceptor in O–H⋅⋅⋅Cl hydrogen bonds, both from the water molecule and the hydroxyl group O30–H31. The energies of these hydrogen bonds were calculated according to the correlation developed in Kaduk (Reference Kaduk2002). The Cl apparently acts as an acceptor in three C–H⋅⋅⋅Cl interactions involving methylene and methyl groups. These interactions may contribute to the orientation of the cationic end of the oxybutynin. There also appears to be a C7–H11⋅⋅⋅C6 interaction between phenyl rings.
Table I. Hydrogen bonds (CRYSTAL14) in oxybutynin hydrochloride hemihydrate.

The volume enclosed by the Hirshfeld surface (Figure 13; Hirshfeld, Reference Hirshfeld1977; McKinnon et al., Reference McKinnon, Spackman and Mitchell2004; Spackman and Jayatilaka, Reference Spackman and Jayatilaka2009; Wolff et al., Reference Wolff, Grimwood, McKinnon, Turner, Jayatilaka and Spackman2012) is 557.68 Å3 (including a whole water molecule), 100.91% of 1/8 the unit-cell volume. The packing is thus fairly dense. All of the significant close contacts (red in Figure 13) involve the hydrogen bonds.
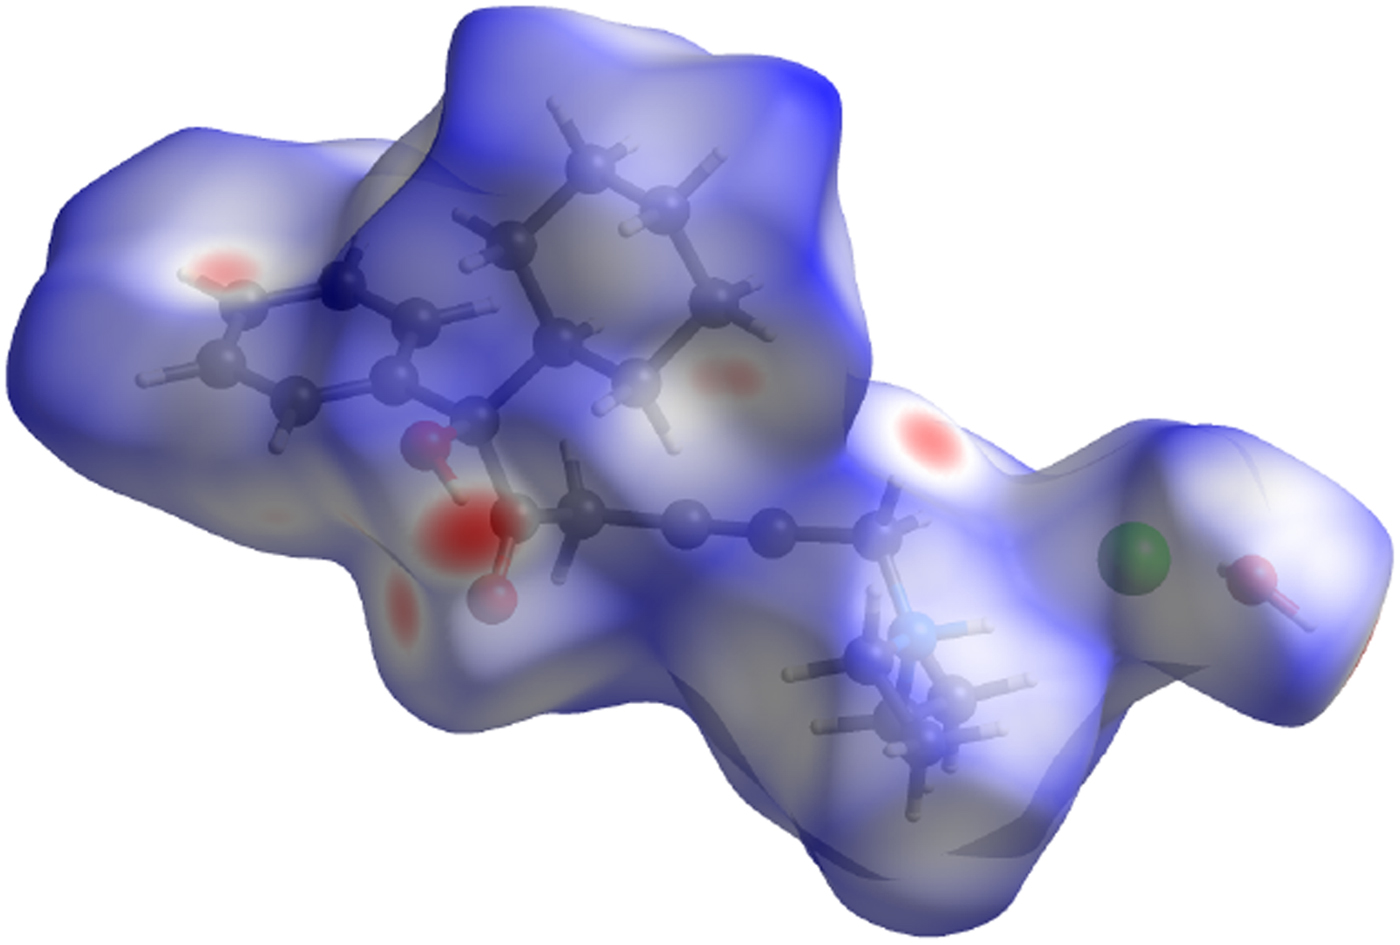
Figure 13. (Color online) The Hirshfeld surface of oxybutynin hydrochloride hemihydrate. Intermolecular contacts longer than the sums of the van der Waals radii are colored blue, and contacts shorter than the sums of the radii are colored red. Contacts equal to the sums of radii are white.
The Bravais–Friedel–Donnay–Harker (Bravais, Reference Bravais1866; Friedel, Reference Friedel1907; Donnay and Harker, Reference Donnay and Harker1937) morphology suggests that we might expect platy morphology for oxybutynin hydrochloride hemihydrate, with {002} as the principal faces. A fourth-order spherical harmonic preferred orientation model was included in the refinement; the texture index was 1.0067, indicating that preferred orientation was not significant in this rotated capillary specimen.
The powder pattern is included in the Powder Diffraction File™ as entry 00-068-1305.
SUPPLEMENTARY MATERIAL
The supplementary material for this article can be found at https://doi.org/10.1017/S0885715618000842.
Acknowledgements
Use of the Advanced Photon Source at Argonne National Laboratory was supported by the US Department of Energy, Office of Science, Office of Basic Energy Sciences, under Contract No. DE-AC02-06CH11357. This work was partially supported by the International Centre for Diffraction Data. The authors thank Lynn Ribaud and Saul Lapidus at 11-BM for their assistance in data collection, Andrey Rogachev for the use of computing resources at IIT, and Jose Orozco at IIT for the TGA analysis.