


1. Introduction
The Ordovician–Silurian (O–S) transition was an interval of major changes in the Earth’s biotic, climatic and environmental systems, during which the Hirnantian glaciation and the end-Ordovician mass extinction took place (Kump & Arthur, Reference Kump and Arthur1999; Brenchley et al. Reference Brenchley, Carden and Hint2003; Chen et al. Reference Chen, Rong and Fan2006; Hammarlund et al. Reference Hammarlund, Dahl and Harper2012; Algeo et al. Reference Algeo, Marenco and Saltzman2016). Such glaciation was recognized from glacial sediments in north Gondwana, and the decrease in temperature was identified using oxygen isotopes in Ordovician conodonts and the palaeothermometry of other isotopes (Ghienne, Reference Ghienne2003; Le Heron et al. Reference Le Heron, Ghienne and Elhouicha2007; Trotter et al. Reference Trotter, Williams and Barnes2008; Finnegan et al. Reference Finnegan, Bergmann and Eiler2011). The palaeo-ocean environment underwent intense shift and significantly impacted the global cycle of carbon during the O–S transition; as a consequence, this interval was characterized by strong positive δ13C excursions that have been recognized around the world (Fan et al. Reference Fan, Peng and Melchin2009; LaPorte et al. Reference LaPorte, Holmden and Patterson2009; Yan et al. Reference Yan, Chen and Wang2009; Melchin et al. Reference Melchin, Mitchell and Holmden2013).
Recently, numerous studies have focused on the changes in ocean environment and climate in the Yangtze area during the Late Ordovician period, including the ocean redox conditions, chemical weathering and tectonic orogeny. The palaeoredox proxies (e.g. Fe speciation, S isotopes, Mo isotopes, degree of pyritization, Mo–U enrichment factors) indicate a predominance of stratified, anoxic ocean on the Yangtze block during this interval, which was interrupted by a brief episode of oceanic oxygenation in the early Hirnantian (Yan et al. Reference Yan, Chen and Wang2012; Zhou et al. Reference Zhou, Algeo and Shen2015; Liu et al. Reference Liu, Li and Algeo2016; Li et al. Reference Li, Zhang and Geoffrey2017). A series of works have been conducted on the Late Ordovician mass extinction, and the triggering mechanisms are under debate. One proposal is that the global cooling occurred across the O–S transition and played a significant role in driving the extinction (Yan et al. Reference Yan, Chen and Wang2010). Zou et al. (Reference Zou, Qiu, Poulton, Dong, Wang, Chen, Lu, Shi and Tao2018) reconstructed the oceanic redox conditions on the Yangtze Shelf Sea, and proposed that the ocean euxinia rather than global cooling may be responsible for the extinction. Hg isotope data reported by Jones et al. (Reference Jones, Martini and Fike2017) are in accord with the assumption that volcanism triggered the extinctions. In addition, other studies have investigated the marine nitrogen cycle, C–S isotopic anomalies and deposition of sediments with high organic matter contents (Yan et al. Reference Yan, Chen and Wang2009; Luo et al. Reference Luo, Algeo and Zhan2016; Yan et al. Reference Yan, Jin and Zhao2018).
Neodymium is an essential element for discrimination of source rocks and, thus, plays a major role in analyses of the provenance of sedimentary rocks. Variation of the 143Nd/144Nd in seawater reflects the changes in ocean circulation patterns (Dubois-Dauphin et al. Reference Dubois-Dauphin, Colin, Bonneau, Montagna, Wu, Van Rooij, Reverdin, Douville and Frank2017), and the isotopic compositions of source rocks. Generally, the source of neodymium mainly contains river water, hydrothermal water and diagenetic waters (Keto & Jacobsen, Reference Keto and Jacobsen1987; Wei et al. Reference Wei, Abouchami and Zahn2016; Filippova et al. Reference Filippova, Frank and Kienast2017). Therefore, marine sedimentary Nd isotopes have been widely used to imply volcanism and tectonism in the source area, and a transportation mechanism of continental and volcanic detritus (Keto & Jacobsen, Reference Keto and Jacobsen1988). Different 143Nd/144Nd ratios in oceanic and continental crust are attributed to fractionation in the process of crustal differentiation, which could produce different Sm/Nd ratios (DePaolo & Wasserburg, Reference DePaolo and Wasserburg1976). The oceanic crust originating from a depleted mantle shows a higher Sm/Nd ratio and positive εNd(t) value, whereas continental crust, with a low Sm/Nd ratio, shows a negative εNd(t) value (DePaolo & Wasserburg, Reference DePaolo and Wasserburg1976; Finlay et al. Reference Finlay, Selby and Gröcke2010; Laukert et al. Reference Laukert, Frank and Bauch2017). Hence, the excursion of Nd isotopes could reflect the locally volcanic and tectonic processes. For instance, the dramatic positive excursion of Nd isotopes during ocean anoxic event 2 (OAE2) is interpreted by the emplacement of large igneous provinces (Kenneth et al. Reference Kenneth, Mac and Ellen2008). Two positive spikes recorded in Nd isotope composition between 20 and 15 Ma were induced by a volcanic crisis (Sandrine et al. Reference Sandrine, Laure and Claude2012). It is suggested that the short residence time of Nd in seawater (approximately 300 to 1000 years) relative to the turnover rate of oceans (∼1500 years) generally makes Nd isotopes useful proxies to trace water mass origins and ocean circulation patterns (Elderfield, Reference Elderfield1988; Tachikawa et al. Reference Tachikawa, Jeandel and Roy1999).
The high-resolution Nd isotope evolution during the Ordovician–Silurian transition in the Yangtze Block has been less frequently studied, although some studies have been carried out for the sedimentary Nd isotopic compositions across the O–S transition (Holmden et al. Reference Holmden, Mitchell and LaPorte2013). Given this, we carried out a study of geochemical and Nd isotopic characteristics for siliclastic through Late Ordovician to early Silurian. By doing this, we tried to (1) determine the provenance of sediments in the Yangtze Sea; (2) reconstruct the palaeoenvironment in the Yangtze Sea; and (3) discuss the possible links between sea level, redox water conditions and extinctions.
2. Geological setting
During the Late Ordovician interval, South China was located near the equator (Fig. 1a), and was comprised of the Yangtze platform in the NW and the Cathaysia platform in the SE (Yan et al. Reference Yan, Wang and Fu2015). Subsequently, the Yangtze platform was largely isolated from the open sea as a result of the convergence–compression between the Yangtze Block and Cathaysia Block, as well as the ongoing intracontinental orogeny within the Yangtze Block (Zhang et al. Reference Zhang, Guo and Wang2013). Besides, the Yangtze Sea was divided by the Jiujiang Strait into a western Upper Yangtze Sea and an eastern Lower Yangtze Sea (Chen, Reference Chen1984). From the Late Ordovician, the Caledonian movement reached its highest intensity, placing the Upper Yangtze Platform under compression and resulting in the formation of Chengdu Uplift in the NW of the Upper Yangtze Platform, Dianqian Uplift in the south of the Upper Yangtze Platform and Jiangnan–Xuefeng Uplift (Fig. 1b) in the SE of the Upper Yangtze Platform (Liang et al. Reference Liang, Guo and Chen2009; Li et al. Reference Li, Zhang and Geoffrey2017). Lithofacies and biofacies changes through the O–S transition on the Yangtze platform are coincident with global sea-level changes, and black shale occupied most of the Yangtze platform region during the late Katian and early Rhuddanian. Black shale was replaced by carbonate facies during the Hirnantian coincident with a global sea-level low stand (Chen et al. Reference Chen, Rong and Li2004).

Fig. 1. (a) Palaeogeographic map of the world (the map originates from https://deeptimemaps.com) and (b) Late Ordovician to Early Silurian palaeogeographic map of the Yangtze Block. The relative locations of the Yangtze Block and Cathaysia Block duringthe O–S transition (modified by Chen et al. Reference Chen, Rong and Fan2006). 1 – Dob’s Linn; 2 – Arctic Canada; 3 – Baltica (Sullivan et al. Reference Sullivan, Loydell and Montgomery2018); 4 – Estonia (Young et al. Reference Young, Saltzman, Ausich, Desrochers and Kaljo2010); 5 – Wangjiawan (WJW) Section; 6 – Fenxiang (FX) section; 7 – Nanbazi Section.
The section analysed in this study is the SC3 core, which was located on the Upper Yangtze platform of the South China Block during the O–S transition; this core was located in a deep shelf facing the open ocean (Fig. 1b). The SC3 profile could be divided into the Wufeng Formation, Guanyinqiao Bed and Lungmachi Formation, in ascending order (Fig. 3, further below). The Wufeng and Lungmachi Formations are mainly composed of black shale with high total organic carbon contents (Fig. 2a), while the Guanyinqiao Bed is composed of carbonaceous mudstones intercalated with carbonaceous limestone bearing abundant benthic fauna (Fig. 2b).

Fig. 2. (a) The black shale in the Wufeng Formation; yellow arrows indicate graptolite. (b) The limestone in the Guanyinqiao Member; large numbers of benthic fauna can be observed.

Fig. 3. (a) Plot of Ce/Ce* vs GdN/SmN ratios. (b) Plot of εNd(444) vs Sm/Nd ratios. (c) Plot of Ce/Ce* vs Mn contents. (d) Plot of εNd(444) vs Al contents.
3. Methods
Twenty-six fresh samples of mudstone and calcareous limestone derived from the SC3 core were used for this study, and these samples (200 mesh) were all placed in an oven at 105 °C to dry for 12 hours prior to test.
Preparation for measurement of the δ13Corg involved accurately weighing ∼1 g of powdered rock, followed by digestion in HCl to remove carbonate minerals. The residue, including organic matter, silicates and oxides, was thoroughly rinsed, dried and then re-powdered. δ13Corg analyses were performed using a Costech ECS4010 Elemental Analyzer attached to a Thermo Finnigan MAT 253 mass spectrometer (State Key Laboratory of Biogeology and Enviromental Geology, Wuhan). Isotope ratios are reported in delta notation (‰) relative to the Vienna Pee Dee Belemnite (V-PDB) standard (Craig, Reference Craig1957). The 1σ external precision for δ13Corg is ±e0.1‰ based on repeated analyses of caffeine as an internal standard.
Major element analyses of whole rock were conducted on XRF (X-ray fluorescence) (Primus II, Rigaku, Japan) at the Wuhan Sample solution Analytical Technology Co., Ltd, Wuhan, China. The detailed sample-digesting procedure was as follows: (1) ∼1.0 g dried sample was accurately weighed and placed in the ceramic crucible and then heated in a muffle furnace at 1000 °C for 2 hours. After cooling to 400 °C, this sample was placed in the drying vessel and weighed again in order to calculate the loss on ignition (LOI). (2) 0.6 g sample powder was mixed with 6.0 g co-solvent (Li2B4O7 : LiBO2 : LiF = 9:2:1) and 0.3 g oxidant (NH4NO3) in a Pt crucible, which was placed in the furnace at 1150 °C for 14 min. This melting sample was then quenched with air for 1 min to produce flat discs on the fire brick for the XRF analyses.
Trace element analysis of whole rock was conducted on Agilent 7700e ICP-MS (inductively coupled plasma mass spectrometer). Firstly, Sample powder (200 mesh) was placed in an oven at 105 °C to dry for 12 hours. For measurement of the trace elements, the bulk sediments were treated using 1 ml HNO3 and 1 ml HF acid, subsequently drying them twice in an oven at 190 °C. Then the samples were dissolved in 1 ml HNO3 and spiked with a known amount of Rh. The final solutions were transferred to a polyethylene bottle and diluted to 100 g by the addition of 2 % HNO3.
Nd isotope analyses were conducted on a Neptune Plus MC-ICP-MS (multi-collector ICP-MS) (Thermo Fisher Scientific, Dreieich, Germany). All chemical preparations were performed on class 100 work benches within a class 1000 over-pressured clean laboratory. Column chemistry: The rare earth elements (REE) solution from the Sr-column method was evaporated to incipient dryness, and taken up with 0.18 M HCl. The converted REE solution was loaded into an anion-exchange column packed with LN resin. After complete draining of the sample solution, columns were rinsed with 0.18 M HCl to remove undesirable matrix elements. Finally, the Sr fraction was eluted using 0.3 M HCl and gently evaporated to dryness prior to mass-spectrometric measurement. In addition, the exponential law, which initially was developed for thermal ionization mass spectrometry (TIMS) measurement (Russell et al. Reference Russell, Papanastassiou and Tombrello1978) and remains the most widely accepted with MC-ICP-MS, was utilized to assess the instrumental mass discrimination in this study. Mass discrimination correction was performed via internal normalization to a 146Nd /144Nd ratio of 0.7219 (Lin et al. Reference Lin, Liu, Yang and Hu2016). The εNd(444) values were calculated at 444 Ma: εNd (450) = ({143Nd/144Ndsample(0) − [147Sm/144Ndsample(0) (eλ(450Ma) − 1)]}/{143Nd/144NdCHUR(0) − [147Sm/144NdCHUR(0) (eλ(450Ma) − 1)]} − 1) × 104.
4. Results
4.a. Major and trace element geochemistry
The major element concentrations are given in Table 1. The samples from the SC3 core display higher SiO2 contents (ranging from 13.37 % to 75.13 %), which are regarded as an admixture of three end members: detrital silica, biogenic silica and diagenetic silica (Yang et al. Reference Yang, Yan and Wei2018). The high Al2O3 values (ranging from 3.15 % to 14.42 %) of the samples are mainly related to high clay mineral contents, and the high CaO values (ranging from 1.65 % to 25.99 %) probably indicate calcite enrichment. In the Wufeng and Lungmachi formations, the Ti contents range from 0.43 to 0.54 (average 0.49) and 0.19 to 0.91 (average 0.48) respectively, whereas the Ti contents in the Guanyinqiao Bed display relatively low values, ranging from 0.17 to 0.33 (average 0.26).
Table 1. Major and trace elements in SC3 core

The trace element concentrations are given in Table 1. The Zr contents vary from 95.2 to 182.4 ppm (average 137.5 ppm) in the Wufeng Formation, and 60 to 292.1 ppm (average 167.3 ppm) in the Lungmachi Formation. However, the Zr in the Guanyinqiao Bed presents relatively low values, ranging from 61.1 to 117.1 ppm (average 95.2 ppm). Ce anomalies (Ce/Ce*) are traditionally calculated by comparing the normalized concentration of Ce with its neighbouring REE.
4.b. Carbon isotope variations
A δ13Corg profile of the SC3 core was determined for chemostratigraphic correlation of Late Ordovician successions (Fig. 3; Table 2). Our δ13Corg data vary between −31.69 and −28.38 ‰, and the δ13Corg profile shows a positive excursion from about −31.05 ‰ to −28.38 ‰, beginning in the Wufeng Formation (sample 30), with a sharp positive spike up to −28.38 ‰ in the Guanyinqiao Bed (sample 25). A return to pre-excursion values occurs in the Lungmachi Formation (sample 27).
Table 2. C- and P-compositions of studied sediments

n.d.: no data.
4.c. Corg, and PT compositions
As shown in Table 2, the total organic matter contents (Corg) vary generally between 0.09 % and 6.14 % (average 4.08 %), with the lowest abundance in the Guanyinqiao Bed. The total P (P T) contents vary between 0.06 % and 1.17 % (average 0.18 %), with the highest abundance in the Guanyinqiao Bed.
4.d. Sm–Nd isotope compositions
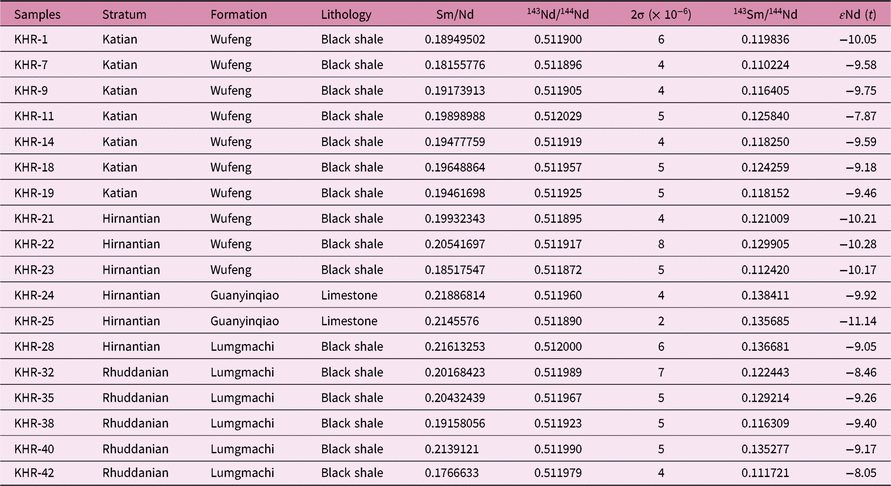
Nd isotope data for the samples from the SC3 core are reported in Table 3. The Nd and Sm contents of the shale and limestone range from 11.4 ppm to 76.3 ppm (average 33.8 ppm) and from 2.5 ppm to 16.7 ppm (average 6.7 ppm) in the SC3 core. The 143Sm/144Nd and 143Nd/144Nd ratios vary from 0.110224 to 0.138411 (average 0.123447) and from 0.511872 to 0.0.512029 (average 0.511940) in the SC3 core. The εNd(444) values for the majority of the Wufeng samples range between −10.28 and −7.87; however, values decrease to −11.14 in the Guanyinqiao Bed. Further upward, the εNd(444) values for the Lungmachi samples return to high values (varying from −9.40 to −8.05).
Table 3. Sm–Nd isotope compositions of studied samples
5. Discussion
5.a. Influence of diagenetic alteration on εNd(444) and Ce/Ce*
The lithofacies assemblage has some differences through the Wufeng Formation to Lungmachi Formation due to the dramatic climatic change during the O–S transition. The Wufeng and Lungmachi formations are mainly characterized by black shale, while the Guanyinqiao Bed is dominated by muddy limestone. It is generally suggested that REE may be mobilized because of diagenetic alteration and thus the sediments could not retain primary geochemical information. The DyN/SmN ratio is one possible indicator for diagenetic exchange after deposition. It is suggested that the REE patterns would become progressively more Ce-enriched and DyN/SmN ratios decreased during the diagenetic process (Shields & Stille, Reference Shields and Stille2001; Ling et al. Reference Ling, Chen and Li2013). However, there is no apparent correlation between DyN/SmN vs Ce/Ce*, indicating the diagenetic alteration does not occur in samples from the studied succession (Fig. 3). Furthermore, the Ce anomaly may be influenced by incorporation of Mn oxides that commonly have a positive Ce anomaly, which is due to a lower mobility of Ce4+ than REE3+. In our study, the Guanyinqiao limestone with low Ce/Ce* ratios has relatively high Mn contents, suggesting that the effect of Mn oxides on studied samples is limited.
The influence of diagenesis on εNd(444) is due to the preferential loss of light REEs (La–Sm); as a result, this process could significantly alter the Sm/Nd ratio and hence the Nd isotopic compositions (Chakrabarti et al. Reference Chakrabarti, Abanda and Hannigan2007). There is no obvious correlation between Sm/Nd and εNd(444), indicating the diagenetic alteration on studied samples is limited. Another important factor altering the primarily depositional εNd(444) is contamination from continental silicate detritus, because silicate minerals generally have much higher εNd(444) and REE content than carbonate minerals. Such influences from silicate detritus can be monitored by considering the concentrations and correlations of elemental concentrations such as Al of bulk rocks. As shown in Figure 3, a negative relationship between εNd(444) and Al is not observed, suggesting the studied samples are not affected by silicate detritus. In particular, the Guanyinqiao limestone has lower εNd(444) values and Al contents than those in the Wufeng and Lungmachi formations. Therefore, the extremely low εNd(444) values in Guanyinqiao limestone cannot be attributed to the incorporation of silicate detritus; thus, it can reflect the primary ocean signals.
5.b. Constraints on stratigraphic correlation
The Hirnantian stage records a sharp perturbation in the carbon cycle, seen in the enrichment of 13C in both sedimentary carbonate and organic matter; thus, the carbon isotopic chemostratigraphy can serve as a powerful tool for the global correlation. At the SC3 core, δ13Corg data range between −31.69 and −28.38 ‰, and the δ13Corg profile shows a positive excursion from about −31.05 ‰ to −28.38 ‰, beginning at the base of the extraordinarius zone, and a sharp positive spike up to −28.38 ‰ within the extraordinarius zone (Fig. 4). This pattern of δ13Corg is coincident with some sections in other areas, including South China, Baltica, the Arctic and Estonia (Wang, Reference Wang and Chai1989; Melchin & Holmden, Reference Melchin and Holmden2006; Yan et al. Reference Yan, Chen and Wang2009; Young et al. Reference Young, Saltzman, Ausich, Desrochers and Kaljo2010; Sullivan et al. Reference Sullivan, Loydell and Montgomery2018), although some studies also found that the δ13Corg peak should be placed in the lower persculptus zone (Underwood et al. Reference Underwood, Crowley, Marshall and Brenchley1997; Gorjan et al. Reference Gorjan, Kaiho and David2012). Furthermore, the δ13Corg return to baseline values in the persculptus zone, marking the end of the Hirnantian carbon-isotope excursion (Fig. 4). It seems that there is a step function decrease in δ13Corg whichmay correspond to a sequence-stratigraphic condensation. Condensed sediments are present in mostly well-individualized, extremely thin (<1 m) beds, which were formed over extremely long time periods (>100 ka) (Föllmi, Reference Föllmi2016). Interestingly, the time at which δ13Corg decreased was in accord with the characteristics of sequence-stratigraphic condensation. The estimated duration of the P. persculptus Biozone was ∼0.6 Ma (Gradstein et al. Reference Gradstein, Ogg and Schmitz2012; Chen et al. Reference Chen, Fan and Zhang2015), and the sediments in this interval were constrained in a thin bed (∼0.3m). In addition, the pattern of δ13Corg is consistent with the conclusion, which suggests the elevated δ13Corg in the late pacificus – early extraordinarius zones and the return to baseline values in the persculptus zone appear to be the most significant chemostratigraphic features (Gorjan et al. Reference Gorjan, Kaiho and David2012). Overall, the δ13Corg generated in this study is broadly consistent with previously published δ13Corg data, while these new data show a different peak value relative to those at the Wangjiawan, Nanbazi and Fenxiang sections. This excursion is known as the Hirnantian Isotope Carbon Excursion (HICE) (Bergström et al. Reference Bergström, Chen and Gutierrez2008), and matches the timing and magnitude of other known Hirnantian δ13Corg excursions around the world.

Fig. 4. Carbon isotopic variations across the O–S transition at SC3 (in this study), Wangjiawan (WJW), Nanbazi (NBZ), Fenxiang (FX) in South China (Wang, Reference Wang and Chai1989; Yan et al. Reference Yan, Chen and Wang2009), and their correlation with those at Baltica (Sullivan et al. Reference Sullivan, Loydell and Montgomery2018), Arctic Canada (Melchin & Holmden, Reference Melchin and Holmden2006), Dob’ Linn (Underwood et al. Reference Underwood, Crowley, Marshall and Brenchley1997) and Estonia (Young et al. Reference Young, Saltzman, Ausich, Desrochers and Kaljo2010). The locations of the sections are shown in Figure 1. Biostratigraphy based on Chen et al. (Reference Chen, Fan and Zhang2015, Reference Chen, Fan and Wang2017). M. e: M. extraordinarius; P.p: P. persculptus; A. as: A. ascensus.
5.c. Perturbation in Nd isotopic compositions
The Nd isotopic compositions of whole rock are primarily controlled by the type of source rock transported into the ocean, which generally comprises the oceanic crust originating from a depleted mantle with positive εNd(t) values and the continental crust with negative εNd(t) (DePaolo & Wasserburg, Reference DePaolo and Wasserburg1976; Keto & Jacobsen, Reference Keto and Jacobsen1988; Wei et al. Reference Wei, Abouchami and Zahn2016; Filippova et al. Reference Filippova, Frank and Kienast2017). High εNd(t) values during the Katian and Rhuddanian intervals can be observed (Fig. 5), and the εNd(444) shift (1.88 unit) occurs during the early Wufeng period. Thus, when considering widely the distribution of K-bentonite in South China, this high εNd(444) value may indicate the high radioactive 143Nd flux provided by volcanic activities. This phenomenon is in accordance with previous studies, in which the largest positive εNd(t) excursion during OAE2 was due to the eruptions of the Caribbean large igneous province (Kenneth et al. Reference Kenneth, Mac and Ellen2008).

Fig. 5. The stratigraphic distribution of the δ13Corg, εNd(444), terrestrial input and redox proxies.
The εNd(t) values decrease sharply at the base of the glaciation period, and then remain low and relatively constant before an abrupt return to high values (Fig. 5). Possible explanations for the low values include (1) a diagenetic overprint, (2) change in the source rocks, (3) sinking of a locally derived water mass imprinted with an εNd(t) value strongly impacted by continental weathering, or (4) seawater–particle exchange coupled with generally sluggish circulation (Kenneth et al. Reference Kenneth, Mac and Ellen2008). The alteration by diagenesis is excluded in section 5.a, especially as, if the Nd isotopic excursion is a diagenetic artefact, it will be expected to occur at a lithologic transition, resulting from the diagenesis generally exerting similar influences on the same rock types. However, Nd isotope actually shifts within the black shale unit (Fig. 5), thereby indicating that diagenetic effect is not the major factor controlling the variation of εNd(444).
There are a number of ways of inferring the provenance composition from the chemical composition of finer siliciclastics (Cullers & Podkovyrov, Reference Cullers and Podkovyrov2000), resulting from the fact that the immobile major and trace elements (e.g. Zr, REE, high-field strength elements (HFSE)) in siliciclastic rocks are particularly sensitive to provenance. Being immobile in natural sedimentary environments, Al2O3, TiO2, Th and Zr, and other HFSEs are quantitatively transferred as detrital load from the source rocks (Taylor & McLennan, Reference Taylor and McLennan1985; Hayashi et al. Reference Hayashi, Fujisawa and Holland1997). Hayashi et al. (Reference Hayashi, Fujisawa and Holland1997) observed that mafic igneous rocks are characterized by a TiO2/Zr weight ratio of >195, intermediate igneous rocks by a ratio of between 195 and 55, and felsic igneous rocks by one of <55. They proposed a scheme for discriminating the source of the sedimentary rocks on the basis of TiO2/Zr weight ratios. As presented in this discriminating scheme, the TiO2/Zr weight ratios of studied samples indicate felsic igneous source rock (Fig. 6a). The Al2O3/TiO2 ratio is another important indicator for the provenance composition (Hayashi et al. Reference Hayashi, Fujisawa and Holland1997). The Al2O3/TiO2 ratios of SC3 black shales range between 12 and 27, suggesting their derivation from felsic igneous source rocks. The plots of black shale samples in the Al2O3–TiO2 bivariate space (Fig. 6b; McLennan et al. Reference McLennan, Fryer and Young1979; Schieber, Reference Schieber1992) clearly suggest granodiorite source rock for SC3 black shales; thus, the Nd isotopic excursion is not controlled by the difference in source rocks.

Fig. 6. (a) TiO2–Zr discrimination plots indicating felsic igneous source rocks for the SC3 shales. TiO2–Zr discriminating field values are after Hayashi et al.(Reference Hayashi, Fujisawa and Holland1997). (b) Al2O3–TiO2 bivariate space (after McLennan et al. Reference McLennan, Fryer and Young1979) suggesting granite–granodiorite source rock for the SC3 shales. The ‘granite line’ and the ‘3 granite + 1 basalt line’ are from Schieber (Reference Schieber1992). Post-Archaean average Australian shale (PAAS; Taylor & McLennan, Reference Taylor and McLennan1985) is also plotted for reference. Plots of granodiorite, gabbro, peridotite and alkali granite are after Paikaray et al. (Reference Paikaray, Banerjee and Mukherji2008).
Instead, abrupt eustatic fall is likely to be the reason for this Nd isotopic excursion. It has been proposed that the Nd isotopes can be invoked as a sea-level proxy from the western margin of Laurentia during the O–S transition. Furthermore, when sea level was high and palaeo – shorelines had migrated eastward, the εNd(t) value of seawater shifted toward the εNd(t) value of the eastern Panthalassa Ocean (∼−4.0), whereas the εNd(t) of seawater shifted toward the εNd(t) value of the continental weathering flux from Laurentia (∼−8.5) when sea level was low (Holmden et al. Reference Holmden, Mitchell and LaPorte2013). During the O–S interval, the Upper Yangtze Basin was surrounded by a series of uplifts and oldlands, such as the Xuefeng, Qianzhong and Chuanzhong uplifts and the Hanzhong and Kangdian oldlands (Fig. 1). Additionally, there are many temporary submarine highs including the Chengdu, Hunan–Hubei, Dongting and Poyang. These submarine highs were defined to indicate the area with big gaps from the Lower Cambrian to Lower Silurian. Sediments in the Yangtze Sea were mainly transported from continent to basin depending on the river during that time, ultimately forming the mudstone and limestone within the Yangtze Sea. Importantly, the sea-level fall during glaciation would lead to exposure of the submarine highs and growth of the Yangtze Oldlands, making for more continental materials (low εNd(t) values) poured into the Yangtze Sea.
Yan et al. (Reference Yan, Chen and Wang2010) used the chemical index of alteration (CIA) as a proxy for changes in intensity of chemical weathering, and they suggested that the Katian and Rhuddanian periods were characterized by intense chemical weathering. In contrast, the early Hirnantian was characterized by weak chemical weathering as a result of cold and arid climate. This result is not consistent with the εNd(t) variation, due to the fact that the products transported into Yangtze Sea were sourced from not only chemical weathering but also physical weathering. Zr and Ti concentrations are generally considered as indicators of detrital flux because these elements are linked to heavy minerals and clay minerals. The Ti/Al and Zr/Al display relatively consistent values between 0.037 and 0.045, and between 9.33 and 15.92. However, the increase in Ti/Al and Zr/Al ratios occurs at the base of Hirnantian, which is coincident with the positive εNd(t) shift. Likewise, the time at which εNd(t) decreased also coincides with that for Ti/Al and Zr/Al ratios, indicating the strong relationship between high terrestrial input and low εNd(t) values. Therefore, we propose that high εNd(t) values in the Katian, late Hirnantian and Rhuddanian were associated with low terrestrial input, whereas the low sea level during the early Hirnantian period resulted in high terrestrial input and low εNd(t) values.
It is worth noting that the negative εNd(t) values may also be related to the formation of an isolated Yangtze Sea when sea level was low. The Panthalassa Ocean in the Late Ordovician was, like today’s Pacific Ocean, strongly influenced by inputs of Nd from island arc weathering (Keto & Jacobsen, Reference Keto and Jacobsen1988; Holmden et al. Reference Holmden, Mitchell and LaPorte2013). In this case, weak circulation between the Yangtze Sea and Panthalassa Ocean could lead to less material with high εNd(t) values being transported into the Yangtze Sea.
The εNd profiles for the two platform sections yielded similar proxy sea-level curves with several cycles of oscillation recorded during the Hirnantian period (Fig. 7; Holmden et al. Reference Holmden, Mitchell and LaPorte2013). Such εNd data support previous findings that the Hirnantian ice age comprised two major glacial periods separated by a minor interglacial during the early part of the Metabolograptus persculptus Biozone. The younger glacial (confined to mid M. persculptus Biozone time) led to more extensive sea surface cooling than did the earlier one, and resulted in extensive eustatic sea-level drawdown and C-cycle changes. In our study, it seems that the high εNd values during the Hirnantian glaciation could be divided into two stages. The εNd has relatively uniform values in the first stage and is constrained within the Metabolograptus extraordinarius Biozone. However, the εNd clearly increased during the early M. persculptus Biozone, which may indicate the younger glacial. Overall, the εNd data correlate well with the assumption concluded above.

Fig. 7. General trends of the Nd isotopic composition in South China (this study) and western margin of Laurentia respectively (Holmden et al. Reference Holmden, Mitchell and LaPorte2013).
During the O–S transition in the western margin of Laurentia, the variation of εNd (from −4 to −8) recorded several cycles of oscillation (Holmden et al. Reference Holmden, Mitchell and LaPorte2013), while the Yangtze Sea maintained relatively constant εNd values (varying from −10 to −11) prior to the Hirnantian. The differences in variation of εNd between these two areas can be attributed to three aspects: (1) The short residence time of Nd in seawater (approximately 300 to 1000 years) relative to the turnover rate of the oceans (∼1500 years) generally makes Nd isotopes useful proxies to reflect regional basin, rather than the global, change in water mass. Thus, it is possible that the Yangtze area and the western margin of Laurentia are characterized by different εNd profiles. (2) The Middle Palaeozoic event is widely recognized in the South China Craton, which is identified as the angular and parallel unconformity between Devonian and Pre-Devonian strata. The influence of the Kwangsian Orogeny varies across the South China Craton, and this event migrated through SE to NW on the basis of biostratigraphic and lithostratigraphic analysis (Chen et al. Reference Chen, Zhang and Fan2012). Several studies have demonstrated that the change from carbonate to shale and siliciclastic sediments in the Yangtze area is caused by basement subsidence and sea–level rise (Chen et al. Reference Chen, Rong and Li2004; Ma et al. Reference Ma, Chen and Wang2009). Thus, the sea-level variability in the Yangtze Sea is controlled by both local tectonism and global climatic change. (3) The lithologies studied here are dominated by shale and muddy limestone that differ in some important ways from those reported by Holmden et al. (Reference Holmden, Mitchell and LaPorte2013). Due to the different sedimentation rate between the western margin of Laurentia and the Yangtze Sea, the thicknesses of Hirnantian sediments in the Monitor Range, Vinini Creek and Blackstone River sections are ∼80 m, 12 m and 20 m respectively, all of which are much thicker than in the studied section (∼1 m).
The degree of weathering is of great significance to the environmental and biological evolution (Finlay et al. Reference Finlay, Selby and Gröcke2010; Yan et al. Reference Yan, Chen and Wang2010). Interestingly, the change in Nd isotopic compositions can reflect the terrestrial influx and the degree of physical weathering, thereby not only influencing the sedimentary rate, but also controlling the transporting efficiency of nutritive elements that are indispensable to marine biology. The Nd isotopic composition demonstrated that the Hirnantian interval has exhibited obviously elevated physical weathering, which is consistent with the claim according to global Sr isotopic composition (Hu et al. Reference Hu, Zhang, Zhou, Finney, Liu, Shen, Shen, Huang and Shen2017). However, it contradicts previous opinion that the Hirnantian glaciation was characterized by weak chemical weathering based on Os isotopic composition and the CIA (Finlay et al. Reference Finlay, Selby and Gröcke2010; Yan et al. Reference Yan, Chen and Wang2010). The interplay between physical and chemical erosion over glacial–interglacial cycles has been evaluated by Schachtman et al. (Reference Schachtman, Roering, Marshall, Gavin and Granger2019). They observed low CDF values (<0.1) and rapid denudation (>0.22 mm a–1) during the cold and sparsely forested Last Glacial (LG) (29–14 ka). So far, few studies have attempted to estimate how these two processes each influence the climate, and more such studies are needed in the future.
5.d. The redox water conditions
Previous studies have confirmed that the oceanic environment patently changed during the O–S transition. In order to explore the redox conditions in the Yangtze Sea across the O–S transition, multiple palaeoredox proxies were used, including S/C, FeHR/FeT, FeP/FeHR, DOP values, δ34S and δ98Mo values. The results indicate a predominance of stratified, anoxic (ferruginous) ocean on the Yangtze block during this interval, which was interrupted by a brief episode of oceanic oxygenation in the early Hirnantian. This oxygenation, temporally coinciding with the end-Ordovician glaciation and global eustatic sea-level fall, likely resulted from enhanced circulation of polar cold, dense oxygen-rich water onto the low-latitude shelf (Yan et al. Reference Yan, Chen and Wang2012; Zhou et al. Reference Zhou, Algeo and Shen2015).
Observations of total organic carbon contents, combined with descriptions of sedimentary structure (laminated or bioturbated) and benthic faunal abundance, could qualitatively evaluate the seafloor oxygenation (Arthur & Sageman, Reference Arthur and Sageman1994). The Wufeng and Lungmachi formations in the SC3 core are dominated by black, laminated fabric, organic-rich shale and mudstone (Fig. 2a). Generally, these organic-rich shales were deposited under relatively anoxic water conditions. In contrast, the Guanyiniqiao Bed is characterized by grey, organic-poor argillaceous limestone (Fig. 2b). In addition, abundant benthic fauna can be observed, suggesting that the Guanyinqiao sediments are likely to have been deposited under oxic water conditions.
The U and Mo are considered to be effective indicators for redox water conditions because they are sensitive to changes in variation of oxygen in the water column (Algeo & Tribovillard, Reference Algeo and Tribovillard2009). It is generally accepted that the enrichment factors could reflect the redox water conditions according to the geochemical behaviour of U. Based on previous studies, the enrichment factor of U was calculated as: UEF = [(U/Al)sample/(U/Al)PAAS], where U and Al represent the weight per cent concentrations of elements U and Al respectively, and PAAS represents post-Archaean average shale compositions (Taylor & McLennan, Reference Taylor and McLennan1985). This study calculates the enrichment factor of U (UEF), and the result shows that UEF values range from 4.87 to 53.11 in the SC3 borehole. The UEF value gradually ascended throughout the Katian period, and then displayed a sharp decrease at the base of the Hirnantian stage (Fig. 5). Subsequently, UEF maintained uniform and high values during the late Hirnantian and Rhuddanian intervals. This variation trend is in good correlation with the change in lithofacies assemblage, suggesting that the Yangtze Sea gradually became oxygen-rich through the Wufeng to Guanyinqiao period.
Negative Ce anomalies are ubiquitous in the modern, well-oxygenated ocean, but their magnitude varies within and between ocean basins (De Baar et al. Reference De Baar, Bacon and Brewer1985; De Baar Reference De Baar1991), and can respond to changes in water column redox on a metre scale (e.g. De Carlo & Green, Reference De Carlo and Green2002). As a consequence, Ce anomaly is considered an important redox indicator for the sedimentary environment of shale and limestone (Elderfield & Greaves, Reference Elderfield and Greaves1982; Wright et al. Reference Wright, Schrader and Holser1987; German & Elderfield, Reference German and Elderfield1990; Murry et al. Reference Murry, Buchholtz and Gerlach1992). In modern stratified water columns, negative Ce anomalies develop in the oxic surface waters and are eroded in intermediate conditions, with Ce anomalies absent in deeper fully anoxic waters (German et al. Reference German, Holliday and Elderfield1991). For instance, the depth profile of Ce anomaly of the Black Sea shows values of 0.1 in oxidizing surface water and 1.0 in sulphide-precipitating anoxic bottom water (German et al. Reference German, Holliday and Elderfield1991). Debaar et al. (Reference De Baar, German and Elderfield1988) found that the present-day profile of Ce anomaly in the Cariaco displayed a very sharp decrease at the oxic–anoxic boundary near 300 m. Overall, the magnitude of the negative Ce anomaly in marine sediments is related to redox water conditions. Secular variation of whole-rock Ce anomalies in the SC3 core fluctuates between 0.79 and 0.96 during the O–S transition, and a remarkable stratigraphic change of Ce anomaly is recognized in the early Hirnantian stage (Fig. 5). The Ce negative anomaly of the time sequence of the Late Ordovician to Early Silurian provides evidence for the development of a largely stagnant stratified ocean with anoxic bottom water, which presumably began to form in the Upper Ordovician and persisted into the Lower Silurian, and for a temporary oxic at the early Hirnantian interval.
P is an important redox-sensitive element, and it is, to a great extent, controlled by the bottom-water redox conditions (Froelich et al. Reference Froelich, Klinkhammer and Bender1979; Bostrom et al. Reference Bostrom, Andersen and Fleischer1988; McManus et al. Reference McManus, Berelson and Coale1997; Filippelli, Reference Filippelli, Kohn, Rakovan and Hughes2002; Algeo & Ingall, Reference Algeo and Ingall2007). Under oxic–suboxic water column conditions, much of the P derived from organic matter decomposition may remain in sediments as a result of adsorption and complexation reactions, as well as storage of polyphosphates by microorganisms. Therefore, the oxic–suboxic conditions are more favourable for P preservation but unfavourable for organic C (Corg) preservation, resulting in the low Corg/PT ratios in sediments. However, the reductive dissolution of Fe oxyhydroxides allows most of the associated P to diffuse out of the sediment, which does not favour preservation of P and results in high Corg/PT ratios (Algeo & Ingall, Reference Algeo and Ingall2007). In this case, the Corg/PT ratio of bulk sediment can be used as a reliable proxy for redox water conditions (Sageman et al. Reference Sageman, Murphy and Werne2003; Algeo & Ingall, Reference Algeo and Ingall2007). Previous studies summarized the Corg/PT in modern marine sediments and their relationship to bottom-water redox conditions (Algeo & Ingall, Reference Algeo and Ingall2007). It is proposed that the anoxic environments are characterized by the highest Corg/PT ratios (∼150 to ∼200); intermediate median Corg/PT ratios are exhibited by suboxic environments (∼75 to ∼130); and the oxic water conditions are dominated by the lowest Corg/PT ratios (<∼40). Based on the organic C and total P concentration data, the studied samples display relatively high Corg/PT ratios in both the Katian and Rhuddanian intervals, ranging from 90 to 130 and from 69 to 164, indicating an anoxic water condition, whereas, the samples from the early Hirnantian are characterized by lower Corg/PT ratios relative to those from Katian and Rhuddanian, suggesting a relatively oxic water condition (Fig. 5).
In summary, the present data provides strong evidence for change in the depositional environment. During the Katian, late Hirnantian and Rhuddanian intervals, the stagnant seawaters in the Yangtze Sea might have been caused by the high sea level, while the drop in sea level during the early Hirnantian could have enhanced the circulation of dense oxygen-rich waters onto the floor of the Yangtze Sea, leading to sediments being deposited under oxic water conditions.
5.e. Implications for the causes of the Late Ordovician Extinction
The Late Ordovician biotic crisis was marked by two-phase extinction events, and a variety of kill mechanisms have been put forward, mostly invoking global ocean temperature, volcanism, euxinia and changes in redox chemistry (Yan et al. Reference Yan, Chen and Wang2010; Hammarlund et al. Reference Hammarlund, Dahl and Harper2012; Zhou et al. Reference Zhou, Algeo and Shen2015; Jones et al. Reference Jones, Martini and Fike2017). During the Katian period, the Yangtze Sea was characterized by high sea level, anoxic water conditions and low terrestrial input (Fig. 8a). The first strike occurred in the beginning of the Hirnantian, coincident with the rapid sea-level fall (Fig. 8b), which seriously damaged marine ecosystems and reduced biodiversity. This sea-level fall resulted in the loss of large areas of shallow marine habitat; in particular, it is regarded as the principal cause of the first phase of benthic extinctions (e.g. Berry & Boucot, Reference Berry and Boucot1973; Owen & Robertson, Reference Owen and Robertson1995; Elias & Young, Reference Elias and Young1998). Inthe meantime, the large-scale sea-level fall caused by the Hirnantian Glaciation could have resulted in the environmental changes from anoxic to oxygenated bottom waters. In this case, increased oxygenation might have reduced habitat for one of the primary victims, the graptolites, which are considered to be eutrophic, dysoxic deep-water dwellers (Wilde & Berry, Reference Wilde and Berry1984; Cooper et al. Reference Cooper, Rigby and Loydell2012; Melchin et al. Reference Melchin, Mitchell and Holmden2013). Regarding the second extinction interval in the late Hirnantian stage, which is consistent with the rapid sea-level rise, the shift from oxygenated to anoxic marine waters could have exerted severe ecological stresses on victims that had been adapted to oxygenated conditions. During the late Hirnantian and Rhuddanian intervals, the Yangtze Sea was characterized by high sea level, anoxic water conditions and low terrestrial input (Fig. 8c).

Fig. 8. A model for the deposition of sediments during the O–S transition: (a) during the Katian interval; (b) during the Early Hirnantian interval; (c) during the late Hirnantian and Rhuddanian intervals.
6. Conclusions
The geochemical data provide a record of changing environmental conditions associated with the Hirnantian Glaciation in the Yangtze area, from which we draw the following conclusions:
(1) The Nd isotopic compositions in the Yangtze Sea are a combination of two sources: the continental erosion and the Panthalassa Ocean. High εNd(t) values during the Katian, late Hirnantian and Rhuddanian intervals are associated with high sea level, which resulted in less terrestrial input based on low Ti/Al and Zr/Al ratios. In contrast, low εNd(t) values during the early Hirnantian interval are related to sea-level fall. In this case, the exposure of submarine highs and the growth of Yangtze Oldlands lead to more continental materials being transported into the Yangtze Sea based on high Ti/Al and Zr/Al ratios. Additionally, the negative εNd(t) excursion during the O–S transition can also be attributed to the weak circulation between the Yangtze Sea and Panthalassa Ocean when sea-level was low.
(2) The sea-level fluctuations play a significant role in the change in redox water conditions. During the Katian and Rhuddanian intervals, high Ce/Ce* and Corg/P ratios suggest that the Yangtze Sea was characterized by anoxic water conditions caused by high sea level, while the drop in sea level during the early Hirnantian could enhance circulation of dense oxygen-rich waters onto the floor of the Yangtze Sea. Thus, the sediments were deposited under oxic water conditions based on relatively low Ce/Ce*, UEF and Corg/P values.
(3) The Late Ordovician biotic crisis was marked by two-phase extinction events, and the change in sea level and redox chemistry may be the important kill mechanisms.
Acknowledgements
The work presented in this paper was supported by the Chinese National Natural Science Foundation (Grant No. 41690131, 41572327, 41273001).


