Introduction
Integrating multiple, complementary tactics to manage weeds (i.e., integrated weed management [IWM]) is widely recognized as a necessary approach for reducing the risk of selection for herbicide resistance (Liebman et al. Reference Liebman, Baraibar, Buckley, Childs, Christensen, Cousens, Eizenberg, Heijting, Loddo, Merotto, Renton and Riemens2016; Mortensen et al. Reference Mortensen, Egan, Maxwell, Ryan and Smith2012; Norsworthy et al. Reference Norsworthy, Ward, Shaw, Llewellyn, Nichols, Webster, Bradley, Frisvold, Powles and Burgos2012). Novel IWM tactics are critically needed in no-till production systems, where glyphosate- and multiple- resistant weeds are currently threatening soil conservation gains (CAST 2012). Two trends suggest that optimizing cover-cropping tactics is a promising approach that can enhance control of current herbicide-resistant weeds and reduce the risk of selection for resistance moving forward. First, recent studies have consistently demonstrated that integrating cover crops into annual grain crop rotations can improve suppression of current glyphosate-resistant weeds, including horseweed (Erigeron canadensis L.; Cholette et al. Reference Cholette, Soltani, Hooker, Robinson and Sikkema2018) and Amaranthus spp. (Loux et al. Reference Loux, Dobbels, Bradley, Johnson, Young, Spaunhorst, Norsworthy, Palhano and Steckel2017; Montgomery et al. Reference Montgomery, McClure, Hayes, Walker, Senseman and Steckel2018; Wiggins et al. Reference Wiggins, McClure, Hayes and Steckel2016). And second, cover crops are increasingly integrated into annual grain crop rotations to provide multiple ecosystem services, including improved soil quality, maintenance of nutrient and water cycling, and enhanced biotic pest regulation (Wayman et al. Reference Wayman, Kucek, Mirsky, Ackroyd, Cordeau and Ryan2016). These broad trends signal a unique opportunity to design complementary cover-cropping tactics that are guided by an understanding of the processes that select for herbicide resistance in no-till production systems.
Development of herbicide resistance is an eco-evolutionary process that is dynamic and involves complex feedback mechanisms (Evans et al. Reference Evans, Tranel, Hager, Schutte, Wu, Chatham and Davis2016; Menalled et al. Reference Menalled, Peterson, Smith, Curran, Paez and Maxwell2016). Given such complexity, what cover crop management objectives should underlie a proactive, IWM approach that aims to reduce the risk of selection for herbicide resistance? Our current understanding of eco-evolutionary dynamics suggests that reducing the (1) density of emerged weed populations and (2) number of large individuals within the population at the time of exposure to POST herbicides represents practical aims for the integration of cover cropping.
It is widely recognized that the probability of herbicide-resistance evolution in a weed population is directly related to the size of the population (Maxwell et al. Reference Maxwell, Roush and Radosevich1990). Therefore, limiting the number of individual weeds exposed to herbicide selection has been identified as an essential feature of long-term, proactive herbicide-resistance management in arable croplands (Norsworthy et al. Reference Norsworthy, Ward, Shaw, Llewellyn, Nichols, Webster, Bradley, Frisvold, Powles and Burgos2012). However, developing management tactics that aim to limit herbicide exposure requires a detailed understanding of demographic transitions within an annual weed life cycle. For example, simulation models suggest that the historically lower levels of resistance to PRE herbicides is due to the smaller number of weed emergence cohorts that are exposed to PRE herbicides within an annual life cycle relative to the number of emergence cohorts exposed to POST herbicides (Somerville et al. Reference Somerville, Powles, Walsh and Renton2016).
Variation in the size of individuals within an emerged population at the time of herbicide exposure is also likely to influence eco-evolutionary processes that select for herbicide resistance. In most plant populations, relatively few individuals contribute most of the biomass (i.e., size inequality or size hierarchy), which is a function of growth rate differences due to interactions between age differences, genetic variation, heterogeneity of resources, and competition (Weiner Reference Weiner1985). In the context of postemergent herbicide use, large individuals intercept less herbicide per biomass unit (i.e., herbicide dilution effect; Wauchope et al. Reference Wauchope, Sumner and Dowler1997) and reduce plant uptake and translocation (Baker and Hunt Reference Baker and Hunt1981) relative to smaller plants at a given herbicide dose, which results in comparatively lower levels of the active ingredient reaching the target site. Larger individuals are also likely to be more fecund and will have a disproportionate effect on the gene pool of the next generation (Heywood Reference Heywood1986). The extent to which size inequality within a population influences the intensity of selection for resistance depends on the relative fitness advantage of resistant biotypes compared with susceptible biotypes as well as the mechanism of resistance (Neve and Powles Reference Neve and Powles2005). Studies have documented that plant size at the time of herbicide exposure can influence selection for weed biotypes that evolve non–target site resistance mechanisms such as reduced herbicide translocation, which provides a relative fitness advantage by reducing the amount of active ingredient that reaches the target site (Dinelli et al. Reference Dinelli, Marotti, Bonetti, Minelli, Catizone and Barnes2006; Vila-Aiub et al. Reference Vila-Aiub, Casas and Gundel2018).
Living cover crops grown between cash crop phases and cover crop residues retained on the soil surface after termination can be used to target demographic processes that influence weed density and size inequality at the time of herbicide exposure. Resource, or niche, pre-emption is the primary mechanism by which living cover crops affect weed establishment, survival, and fecundity (Liebman and Staver Reference Liebman, Staver, Liebman, Mohler and Staver2001; Sarrantonio and Gallandt Reference Sarrantonio and Gallandt2003). Living cover crops can also indirectly impact seedbank survivorship by providing beneficial habitat to seed predators (Gallandt et al. Reference Gallandt, Molloy, Lynch and Drummond2005). Cover crop residues that are retained on the surface in no-till systems primarily affect weeds by creating a physical barrier that attenuates weed germination cues via changes to the soil surface microclimate (Teasdale and Mohler Reference Teasdale and Mohler2000; Teasdale et al. Reference Teasdale, Brandsaeter, Calegari, Neto, Upadhyaya and Blackshaw2007). Several studies have identified additional mechanisms that underlie the weed-suppressive attributes of cereal rye (Secale cereale L.) residue, including the release of phytotoxic allelopathic chemicals (Reberg-Horton et al. Reference Reberg-Horton, Burton and Danehower2005) and nitrogen (N) limitation (Wells et al. Reference Wells, Reberg-Horton, Smith and Grossman2013; Williams et al. Reference Williams, Wells, Dickey, Hu, Maul, Raskin, Reberg-Horton and Mirsky2018). Managing cover crops to enhance weed-suppressive attributes of surface residues can affect weed population dynamics via changes to weed seedbank recruitment rates and plant growth rates after establishment.
Ecological theory suggests that cover crop mixtures composed of diverse functional groups should enhance ecosystem services and reduce the abundance and richness of weed communities (Smith et al. Reference Smith, Atwood, Pollnac and Warren2015). Functional diversity in cover crop mixtures is typically achieved by using species with different characteristics, such as N function (N2 fixing vs. scavenging) and phenology (winterkill vs. winter hardy), which produces variation in response traits important to weed-suppression dynamics such as fall and spring growth potential (e.g., aboveground biomass and foliar ground cover) and C:N ratio of aboveground plant material (Finney and Kaye Reference Finney and Kaye2016). Increasing cover crop biomass production has been shown to be positively correlated to weed-suppression potential, but cover crop biomass is constrained by the cover crop growing-season window (i.e., fall and spring growing degree day [GDD] accumulation) and the level of residual soil inorganic N at the time of cover crop planting (Finney et al. Reference Finney, White and Kaye2015). In practice, employment of functionally diverse cover crop mixtures as a weed management tactic is likely constrained by the fall growing-season window, crop rotation characteristics, seed costs, and additional equipment and labor considerations.
If cover cropping becomes more widely implemented as a proactive IWM approach in no-till systems, it will be necessary to understand how cover-cropping tactics that use species that produce different response traits influence demographic transitions of annual weeds. In this study, we explore the effects of alternative fall-sown cover crops on critical life-history stages of E. canadensis, a facultative winter annual, in a no-till production system that uses a two-pass herbicide program (Figure 1A). Empirical studies of IWM effects on entire weed life cycles are difficult to implement (Davis and Liebman Reference Davis and Liebman2003). Consequently, we focus on observations of life-history stages that influence E. canadensis density at the time of herbicide exposure.

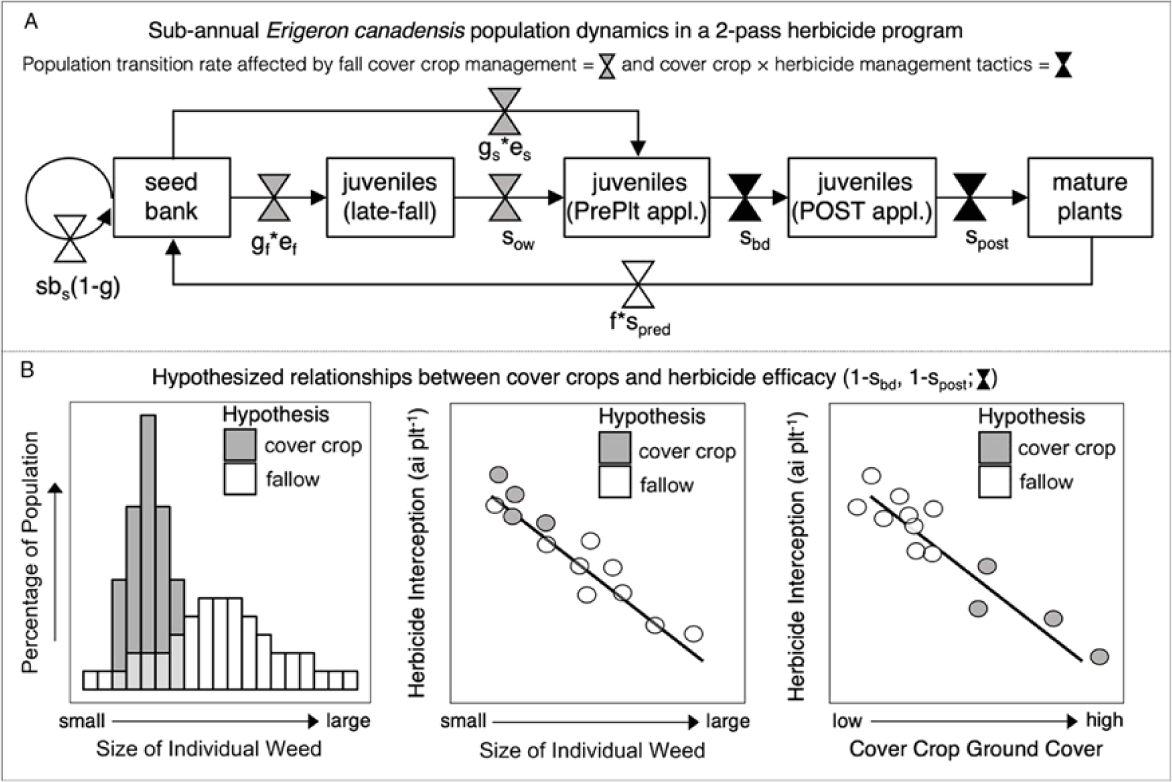
Figure 1. Diagram of (A) demographic model of subannual Erigeron canadensis population dynamics in a two-pass herbicide program. Critical life-history stages include: seedbank, late-fall juvenile plants (seedlings, rosettes), juvenile plants at a preplant (PrePlt) spring herbicide application, juvenile plants at a POST herbicide application (V3 soybean stage), and mature (reproductive) plants. Population size is determined by transition rates: sbs = seed survival in soil seedbank; g = germination in fall (gf) and spring (gs); e = seedling establishment in fall (ef) and spring (es); sow = overwintering seedling (or rosette) survival; sbd = plant survival of spring burndown herbicide application; spost = plant survival of POST herbicide application timing; f = fecundity (seeds plant−1); spred = seed survival of postdispersal seed predation; and (B) hypothesized relationships between cover crops and herbicide efficacy (1 − sbd, 1 − spost).
Erigeron canadensis density at the time of a preplant burndown application is a function of germination and establishment rates of fall and spring cohorts, as well as overwintering survival of the fall-established cohort. Survival rates of preplant burndown and POST herbicide applications are a function of the interaction between herbicide dose and the size of individuals within the population. We hypothesize that due to high resource acquisition, cover cropping will constrain the distribution of individual E. canadensis plant sizes within a population at the time of a preplant burndown application, which could produce two opposing effects on survival, or conversely, herbicide efficacy (Figure 1B). First, cover-cropping tactics could decrease population-level survival rates to herbicides by dampening the herbicide dilution effect that provides a fitness advantage to large individuals. Second, by constraining populations to smaller individuals and producing physical interference of herbicide deposition through the canopy, cover-cropping tactics could further reduce herbicide exposure to emerged populations beyond the demographic effects on population size. As a result, cover-cropping tactics could increase or decrease weed control efficacy of herbicides but could also decrease the selection intensity for herbicide resistance.
This study represents a first step toward understanding the effects of cover-cropping tactics on subannual E. canadensis population dynamics that have important implications for reducing the risk of selection for herbicide resistance. We conducted field experiments to address three questions: (1) Do cover crops differentially affect E. canadensis density at the time of herbicide exposure? (2) Do cover crops differentially constrain size inequality of E. canadensis populations at the time of herbicide exposure? (3) Which cover crop response traits are drivers of E. canadensis density at time of herbicide exposure?
Materials and methods
A field experiment was conducted in the 2014 to 2015 and 2015 to 2016 growing seasons using different locations at the Pennsylvania State University Russell E. Larson Agricultural Research Center (RELARC) near Rock Springs, PA (40°44′N, 77°57′W). Soils at RELARC are Hagerstown silt loam (fine, mixed, mesic Typic Hapludult) with 2.5% to 3.0% organic matter and a pH of 6.5. Experiments were located in fields with a history of reduced-till practices and no previous record of E. canadensis infestations and that featured a no-till planted small grain in rotation. A preplant glyphosate (1.26 kg ae ha−1) application was made before the initiation of experiments.
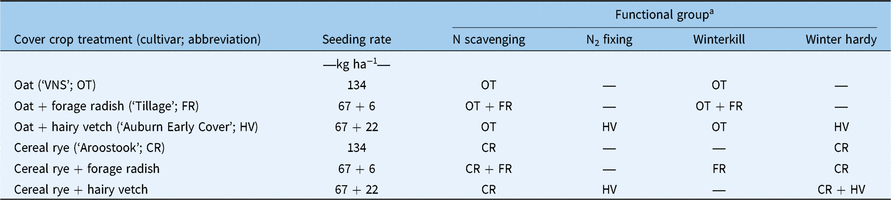
The interaction between alternative cover-cropping tactics and fertility regimes was evaluated using a two-factor, randomized complete block with a split-plot design and four replications. A fertility treatment was included in the experimental design to simulate low and high residual soil N conditions, which is known to influence cover crop response traits. Cover crop treatments were imposed in main plots (3 by 12 m) and fertility treatments were imposed in split plots (3 by 6 m). Fertility treatments included 67 kg N ha−1 using ammonium sulfate (21–0–0–24) and a nontreated control. The N addition treatment was applied with a drop spreader (Gandy, Owatonna, MN) 1 d before cover crop seeding. Seven alternative cover-cropping treatments were imposed, including a no cover crop control, two monocultures, and four two-species mixtures (Table 1). Cover crops were seeded with a no-till drill (Great Plains, Salina, KS 67401) in 19-cm-wide rows on September 1 in 2014 and September 5 in 2015. The following spring, a preplant burndown application of glyphosate (1.26 kg ae ha−1) + 2,4-D LV ester (LVE) (0.56 kg ae ha−1) was applied at 187 L ha−1 using a tractor-mounted sprayer across the entire experiment and targeted the late-boot stage of cereal rye (May 5, 2015; May 8, 2016) for all treatments. Glufosinate-resistant soybean [Glycine max (L.) Merr, ‘Doebler DB3217LL’] were no-till, roll planted in 76-cm-wide rows at a rate of 432,000 seeds ha−1 with a John Deere 1720 no-till planter (Deere & Company, Moline, IL) equipped with ZRX electric-hydraulic, roller-crimpers and double-disk row cleaners (Dawn Equipment, Sycamore, IL). Soybean planting took place approximately 10 d after burndown applications. A POST application of glufosinate (0.74 kg ai ha−1) was made at the V3 soybean growth stage using a tractor-mounted sprayer at 187 L ha−1.
Table 1. Seeding rates and functional groups of cover crop treatments

a Functional groups are defined by two characteristics: N function (N2 fixing vs. N scavenging) and phenology (winterkill vs. winter hardy).
Weed seedbank microplot establishment
An artificial E. canadensis seedbank was established in permanently marked 0.5-m2 quadrats (0.5 by 1.0 m) in the middle of each split-plot treatment immediately after cover crop seeding each year. Mature E. canadensis inflorescences were collected from multiple plants within field edges with a history of no-till annual cropping and glyphosate use at several locations near Rock Springs, PA, in mid-August each year. Glyphosate resistance was not evaluated, but based on general patterns observed at this location, source populations of artificial E. canadensis seedbanks were thought to be biotypes susceptible to glyphosate. Seed was separated from capitula using a series of mesh screens in the laboratory, composited in a single seed lot, and dry stored at room temperature. We used bulked seed lots to establish seedbank microplots at an average seeding rate of 5,400 seeds m−2. Samples were surface seeded by hand using sand as a carrier and windbreaks to prevent wind dispersal during surface seeding.
Cover crop response traits
Multiple cover crop response traits were quantified for each cover crop treatment, including cover crop ground cover (%), living aboveground biomass (Mg ha−1), and aboveground biomass N (kg N ha−1). Cover crop ground cover (%) was visually estimated in E. canadensis microplots 5 and 10 wk after planting (WAP) using a 5 by 5 gridded frame (i.e., 4% ground cover increments). Ground cover was assessed at the cover crop species level, and total weed cover was also estimated. Aboveground biomass of cover crops and weeds was collected in two randomly placed 0.25-m2 quadrats outside the seedbank microplots at the split-plot level in late November (10 WAP), before killing of frost-sensitive species and senescence of winter-hardy cover crops. Aboveground biomass subsamples were composited and separated by cover crop species and weeds, oven-dried (65 C) for 10 d, and weighed. Aboveground biomass was also sampled in spring, just before cover crop termination, using the same methodology. Cover crop biomass N content (kg N ha−1) and C:N ratio were measured in the fall and spring. Dried cover crop biomass was ground to <1 mm using a Cyclone Sample Mill (Udy Corporation, Fort Collins, CO) and then pulverized by ball-milling (8000D Mixer/Mill, Spex Sample Prep, Metuchen, NJ). A 3-mg subsample of each cover crop species per plot was used to measure C and N concentration by dry combustion elemental analysis (EA 1110, CE Instruments, Milan, Italy). Aboveground biomass N was calculated at the species level by multiplying the mean biomass per plot by the N concentration. Weeds represented a minor (<5 %) component of total vegetative biomass and were excluded from the analysis.
Population-level measurements
Emerged E. canadensis population density was quantified within one half of each quadrat (0.25 m2) in: (1) late November (10 WAP), (2) just before the preplant burndown herbicide application, and (3) just before a POST application at the V3 soybean stage. At the preplant burndown census, E. canadensis populations were subsampled to quantify differences in size structure. The diameter of the first 10 seedlings or rosettes located in a randomly selected cover crop interrow of the microplot was measured to the nearest 0.5 cm using calipers. In plots with low E. canadensis density, plants were measured in the entire microplot (0.50 m2) or until 10 plants had been assessed. Erigeron canadensis plants ranged from the 2-leaf stage to larger basal rosettes and had not yet bolted at the time of the burndown application, which is typical for the Northeast region.
Statistical analysis
All statistical analyses were conducted in R v. 3.4.1 (R Development Core Team 2016). ANOVA was used to test for differences in cover crop performance and E. canadensis population responses to cover crop and fertility treatments. Analyses of cover crop performance identified significant year and year by fertility treatment effects. Therefore, we evaluated treatment responses by year. Cover crop ground cover (%; 5 and 10 WAP), aboveground biomass (Mg ha−1; 10 WAP and spring burndown), and total aboveground plant N (kg N ha−1; fall and spring) were assessed individually with linear mixed-effects models using the nlme package (Pinheiro et al. Reference Pinheiro, Bates, DebRoy and Sarkar2015). Cover crop ground cover was subjected to an arcsin square-root transformation to achieve normality; back-transformed means are presented in the results. Erigeron canadensis population density (plants 0.25 m−2; 10 WAP, preplant application, POST application) was assessed individually with generalized linear mixed-effects models (GLMM) using a negative binomial distribution and a log link function (glmer.nb) in the lme4 package (Bates et al. Reference Bates, Maechler, Bolker, Walker, Christensen, Singmann, Dai, Grothendieck and Green2016). Back-transformed geometric means are presented in the “Results and Discussion” section. All models were fit with cover crop, fertility, and their interaction as fixed effects and block as a random effect. Each model was checked for homoscedasticity and normality. Significance of fixed effects was evaluated using log-likelihood ratio tests (Wald χ2) to compare full versus reduced models using the anova function. The Wald χ2 test statistic is used for null-hypothesis testing (e.g., F-statistics in ANOVA) in linear and generalized linear mixed-effect models (Bolker et al. Reference Bolker, Brooks, Clark, Geange, Poulsen, Stevens and White2008). Mean separations within significant fixed effects were conducted using Tukey’s contrasts (glht) in the package multcomp (Hothorn et al. Reference Hothorn, Bretz, Westfall, Heiberger, Schuetzenmeister and Scheibe2008). In addition, we were particularly interested in understanding: (1) the magnitude of cover crop treatment effects (i.e., effect size) on E. canadensis density at the time of preplant herbicide exposure; and (2) the variation in E. canadensis density in response to cover crop treatments across years and soil fertility conditions (Rinella and James Reference Rinella and James2010). Consequently, we calculated the effect size of cover crop treatments on E. canadensis density expressed as a percent decline relative to the no cover crop control [i.e., effect size = 1 – (E. canadensis density in cover crop treatment /E. canadensis density in no cover crop control) × 100]. Point estimates were first generated for each fertility level (low N, high N) within each study year by averaging across treatment replicate. Means and standard errors of point estimates for each cover crop treatment were then calculated by averaging across fertility treatments with study year (n = 4) to characterize the variation across soil-environment conditions and the uncertainty associated with effect size estimates.
An acyclic, or piecewise, structural equation model (SEM) was used to evaluate how cover crop response traits influenced E. canadensis density at the time of the preplant burndown application. Piecewise SEMs translate hypothesized path diagrams into a set of structured linear equations that are solved separately (Lefcheck Reference Lefcheck2016). Control treatments were excluded from the analysis, and the remaining data (n = 96) were pooled across treatments (cover crop by fertility) and years. Cover crop ground cover (%) and aboveground biomass (Mg ha−1) in late fall (10 WAP) and aboveground biomass at burndown were included in the model as predictor variables (i.e., exogenous variable). Late-fall E. canadensis density (10 WAP) was included as an endogenous variable, which is both a predictor and response variable in an SEM (Grace et al. Reference Grace, Anderson, Olff and Scheiner2010). Each response variable (i.e., E. canadensis density in late fall and at burndown) was fit to a GLMM using a negative binomial distribution and a log link function. Year and block nested within year were specified as random components in the model. Our hypothesized path diagram (Figure 2) was then subjected to a test of directed separation and evaluated using Fisher’s C statistic using the function sem.fit from the piecewiseSEM package (Lefcheck Reference Lefcheck2016). Fisher’s C tests the assumption of conditional independence, which identifies significant relationships among unconnected variables using a significance threshold of α = 0.05. Unstandardized regression coefficients and P-values were obtained for paths to determine the significance and directionality of predictor variables on the response. Partial Pearson correlations were obtained to measure covariance between exogenous variables. We were particularly interested in the relative importance of specific predictors of E. canadensis density at burndown. Therefore, we used the r2beta function (‘r2glmm’ package; Jaeger Reference Jaeger2016) to obtain R2β and semipartial R2 (sr2) statistics for fixed (population) effects in each component model (Jaeger et al. Reference Jaeger, Edwards, Das and Sen2017). The R2β statistic uses the penalized quasi-likelihood estimation for GLMMs and is analogous to the marginal coefficient of determination R2m (Nakagawa and Schielzeth Reference Nakagawa and Schielzeth2012) now widely used in linear mixed models. The semipartial R2 (sr2) statistic reports the proportion of the response variance explained by a given predictor variable that cannot be explained by any other predictor variable in the model (Grace and Bollen Reference Grace and Bollen2005).

Figure 2. Hypothesized relationships between cover crop functional traits (% ground cover and aboveground biomass) and subannual Erigeron canadensis population dynamics.
Two methods were used to evaluate E. canadensis rosette size (diameter) hierarchies among cover crop treatments at the preplant burndown application timing. First, variability in rosette diameter was evaluated visually by constructing relative frequency distribution plots for each cover crop treatment by year. Erigeron canadensis samples were pooled across fertility treatments and replicates to increase sample size for statistical analyses and to provide an indicator of variability in rosette size in response to varying soil-environment conditions. Erigeron canadensis rosette size hierarchies were then statistically compared among cover crop treatments (by year) with the use of unbiased Gini coefficients (G′; Damgaard and Weiner Reference Damgaard and Weiner2000), which were calculated in R using the approach described by Buckley and Damgaard (Reference Buckley and Damgaard2012). The Gini coefficient is a summary statistic drawn from Lorenz curves, which economists have traditionally used to describe the degree of inequality in the distribution of incomes in societies and plant biologists have adopted to describe size inequalities (or hierarchies) in plant populations (Weiner and Solbrig Reference Weiner and Solbrig1984). Lorenz curves are constructed by ranking individuals according to an abundance metric (e.g., biomass, height) and plotting the cumulative percentage of the abundance metric against the cumulative percentage of the population. The Gini coefficient ranges from zero to one and measures the fraction of the area between the observed Lorenz curve and the line of equality, which is the diagonal where 0% of the population contains 0% of the abundance metric and 100% of the population contains 100% of the abundance metric. Therefore, a minimum value of zero represents a population in which all individuals are of equal size and increasing Gini coefficient values represent populations with more uneven size distributions. To draw statistical inferences, nonparametric 95% confidence intervals were constructed around calculated unbiased Gini coefficients using the bootstrap method and 2,000 replicate simulations.
Results and discussion
Cover crop response traits
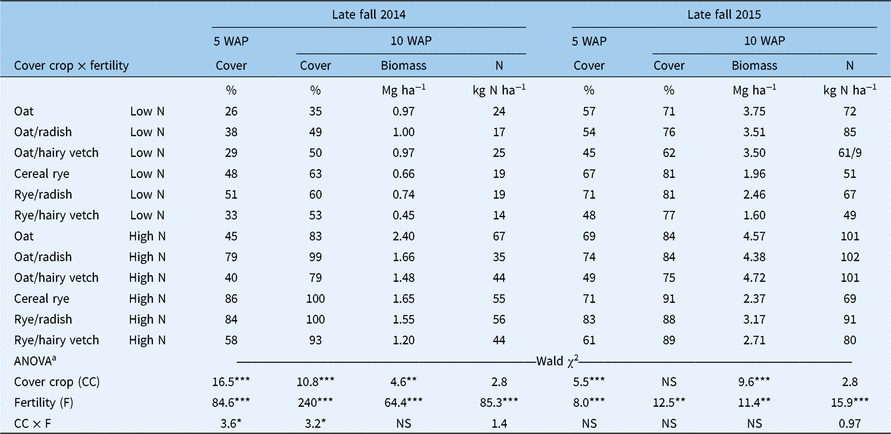
Study year had a significant effect (P < 0.05) on each cover crop response trait. Cover crop ground cover (%) and aboveground biomass production were higher in the second study year compared with the first. Favorable cover crop performance in the second year can be attributed to greater fall GDD accumulation (2014 = 270 GDD; 2015 = 340 GDD) but could have also been influenced by greater residual N fertility, which was not measured. Examination of variance components showed that year had a minimal influence on the total variation in ground cover relative to cover crop and fertility treatments but contributed 66% and 30% of the total variation in aboveground biomass in late fall and at the spring preplant herbicide application timing, respectively. Significant interactions among study year, fertility, and/or cover crop treatments varied across cover crop performance metrics, so subsequent analyses were performed by study year.
High N treatments resulted in higher (P < 0.05) fall ground cover, aboveground biomass, and aboveground plant N in each study year (Table 2). Interactions between fertility and cover crop treatments were limited to effects on ground cover in the first year of the study. In 2014, cover crop treatments did not affect ground cover (5 and 10 WAP) within low-N treatments, but oats (Avena sativa L.)/radish(Raphanus sativus L.), rye/radish, and the cereal rye monoculture produced greater ground cover (5 and 10 WAP) than other cover crops within high-N treatments. A significant cover crop main effect was detected in fall aboveground biomass (10 WAP) in each year of the study. The oats monoculture produced more aboveground biomass in the fall than cereal rye monocultures or mixtures in the first year of the study, and the oats monoculture and oats/hairy vetch (Vicia villosa Roth) produced more aboveground biomass in the fall than the cereal rye monoculture and cereal rye/hairy vetch in the second year. Aboveground biomass N was only affected by fertility treatments in the fall growing season.
Table 2. Effects of cover crop, fertility, and their interaction (CC × F) on cover crop percent ground cover at 5 wk after cover crop planting (WAP) and percent cover crop ground cover, aboveground dry matter biomass, and aboveground biomass N in late fal1(10 WAP) of 2014 and 2015

a Evaluation of fixed effects is based on likelihood ratio tests (Wald χ2) using random effects as null model. Significance (Pr > χ2) of model terms shown as: NS, P > 0.05; *P < 0.05; **P < 0.01; *** P < 0.001.
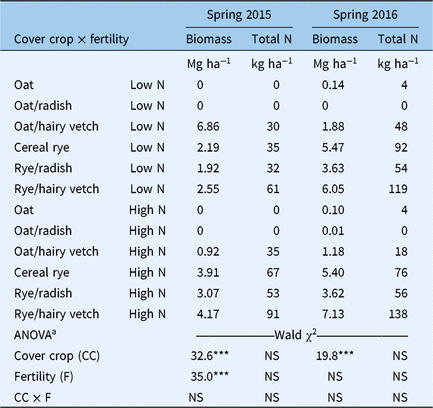
The presence or absence of winter-hardy species shaped cover crop treatment differences in the spring; oats and oats/forage radish mixtures winterkill in the Northeast region (USDA hardiness zones >5). Consequently, we limited our statistical analyses of spring performance indicators to treatments that included winter-hardy cover crop species (Table 3). High N treatments resulted in more aboveground biomass than low-N treatments in the first study year but did not influence biomass accumulation in the second year. Spring biomass was generally higher in the second year across fertility and cover crop treatments. Within low-N treatments, 2- to 3-fold increases in biomass of winter-hardy cover crops were observed in the second study year compared with the first. The rye monoculture and rye/hairy vetch mixture resulted in more aboveground biomass than oats/hairy vetch in both years of the study. No differences were observed in aboveground biomass N among winter-hardy cover crop treatments.
Table 3. Effects of cover crop species, fertility, and their interaction (CC × F) on aboveground dry matter biomass and aboveground biomass N of cover crops just before a preplant burndown herbicide application in spring of 2015 and 2016.

a Evaluation of fixed effects is based on likelihood ratio tests (Wald χ2) using random effects as null model. Significance (Pr > χ2) of model terms shown as: NS, P > 0.05; *P < 0.05; **P < 0.01; ***P < 0.001. Oats and oats/radish were not included in ANOVA.
Cover crop performance trends highlight the importance of environmental conditions and soil fertility as external factors that regulate cover crop resource acquisition in the fall and spring growing seasons. Based on the magnitude of treatment responses, it is reasonable to conclude that interannual variation in growing conditions (study year) and intra-annual variation in residual soil fertility (low vs. high N) are more important drivers of resource acquisition, and therefore weed-suppression potential, than use of cover crop monocultures or mixtures with particular functional traits (N function, phenology). In general, however, observed trends between taxonomic groups (grasses, brassicas, legumes) and fall biomass production are consistent with previous studies that have demonstrated the benefits of using fall-sown grass and brassica cover crops, which have comparatively higher relative growth rates and more efficient N uptake compared with legumes in the fall growing season (Björkman et al. Reference Björkman, Lowry, Shail, Brainard, Anderson and Masiunas2015; Brainard et al. Reference Brainard, Bellinder and Kumar2011; Finney et al. Reference Finney, White and Kaye2015).
Cover crop effects on Erigeron canadensis demography and herbicide exposure
Emerged E. canadensis population density was assessed in late fall (Nov), just before a preplant burndown application (glyphosate + 2,4-D LVE) and just before a POST herbicide application at the V3 soybean growth stage (Figure 3). In control plots, emerged E. canadensis populations declined 24% to 29% from fall to spring in the first year and increased 10% in the second year. The fall to spring demographic transition is a function of both overwintering survival and spring recruitment (germination by establishment), which can be characterized by high levels of stochasticity at field scales. In both years, low survival rates (1% to 7%) were observed following spring burndown herbicide applications in control plots, indicating high weed control efficacy.

Figure 3. Log Erigeron canadensis density (plants m−2) across time (late fall, preplant burndown herbicide application, POST herbicide application at V3 soybean stage) by cover crop treatment, fertility treatment (low N, high N), and study year (2014–2015, 2015–2016). Data are means averaged across treatment replicates (± SE; n = 4).
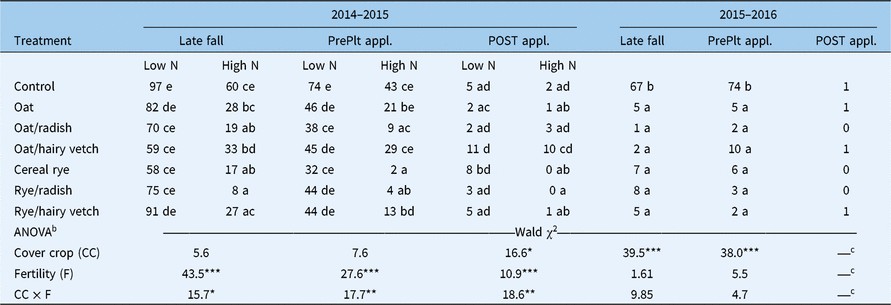
Treatment effects on E. canadensis density in late fall, just before a preplant burndown and just before a POST application differed among study years (Table 4). A significant cover crop by fertility treatment interaction was observed at each timing in the first year of the study. In late fall, cover crop treatments did not affect E. canadensis density within low-N treatments, whereas E. canadensis density was less (P < 0.05) in cereal rye, cereal rye/radish, and oats/radish treatments compared with the control in high-N treatments. High-N treatments resulted in lower (P < 0.05) E. canadensis density within each cover crop treatment level, except oats/hairy vetch, in the fall of the first study year. Similar demographic patterns were observed at the spring preplant application timing in the first year. Cover crop treatments did not affect E. canadensis density in low-N treatments. In high-N treatments, cereal rye and cereal rye/radish treatments reduced (P < 0.05) E. canadensis density compared with the control. At the POST application timing, E. canadensis density was significantly higher (P < 0.05) in the oats/hairy vetch treatment in comparison to several other cover crop treatments in high-N treatments. Erigeron canadensis survival rates from the preplant burndown to POST herbicide application were 24% and 34% in low- and high-N treatments, respectively, in oats/hairy vetch treatments.
Table 4. Erigeron canadensis density (plants 0.25 m−2) in response to cover crop, fertility, and their interaction (CC × F) in late fall (10 WAP), just before a spring preplant burndown herbicide application (PrePlt appl.), and just before a POST herbicide application (POST appl.; V3 soybean stage) in 2014–2015 and 2015–2016.a

a Back-transformed geometric means are presented at the level of statistical significance. Treatments containing the same letter within study year and application timing are not significantly different (P > 0.05).
b Evaluation of fixed effects are based on likelihood ratio tests (Wald χ2) using random effects as null model. Significance (Pr > χ2) of model terms shown as: NS, P > 0.05; *P < 0.05; **P < 0.01; ***P < 0.001.
c Low-density counts precluded the use of ANOVA.
In the second year, each cover crop treatment resulted in lower (P < 0.05) E. canadensis density compared with the control but did not differ in comparison with each other at the late-fall and preplant spring application timings (Table 4). Erigeron canadensis densities were uniformly low just before the POST application, indicating high levels of weed control efficacy following burndown herbicide applications across cover crop treatments. Erigeron canadensis demography in the no cover crop control treatment was similar between years. Consequently, we attribute uniformly low E. canadensis density in cover crop treatments to greater fall and spring biomass production across cover crop treatments in the second study year (Tables 2 and 3).
Averaged across study years and fertility regimes, cover crop treatments resulted in a 56% to 82% decrease in emerged E. canadensis density relative to the control just before a preplant burndown application (Figure 4). Mean reduction in E. canadensis density was highest and variance was lowest in cereal rye monocultures, but cover crop mixtures that included forage radish also resulted in a greater than 75% decrease in E. canadensis density relative to the control. These results demonstrate that cover crops can significantly reduce selection pressure intensity imposed by preplant burndown applications on E. canadensis in no-till systems.

Figure 4. Effect size of cover crop treatments on Erigeron canadensis density at time of a preplant burndown herbicide application in spring relative to the no cover crop control [i.e., % population decline = 1 − (treatment density/control density) × 100]. Data (mean ± SE) are presented as the treatment effect size averaged by fertility treatment within study year (n = 4) to characterize the variability of treatment effects across soil-environment conditions (i.e., low- and high-N treatments in two different growing seasons).
Looking forward, quantification of cover crop effects on individual E. canadensis transition rates would provide more detailed understanding of cover crop impacts on the risk of resistance evolution. Cereal rye monocultures decreased E. canadensis density 41% to 90% in late fall compared with the control, which could have resulted from attenuation of germination cues or seedling mortality following germination. The observed decline (45% to 90%) in E. canadensis density from late fall to late spring within the cereal rye treatment is the cumulative effect of overwintering mortality, spring recruitment, and spring mortality rates. Model simulations have shown that demographic processes that result in the persistence of genotypes (via attenuation of germination cues) can increase the risk of resistance evolution, whereas processes that remove genotypes from the population (seed or seedling mortality) decrease the risk of resistance evolution (Neve et al. Reference Neve, Norsworthy, Smith and Zelaya2010). Future work should also consider cover crop effects on shifts in emergence periodicity, which has important implications for selection pressure intensity in herbicide-based systems. In the Northeast region, the fall-emerging cohort represents the greatest proportion of the emerged E. canadensis population each year. Consequently, selection pressure for resistance is greatest at the preplant burndown application. Late-spring and in-crop emergence cohorts may represent a greater proportion of the population each year in other regions. Consequently, the interaction between cover crop surface residue and E. canadensis population size at the time of soil residual or POST herbicide applications may have a greater effect on selection pressure intensity and persistence of genotypes in these regions. Finally, further research is needed to understand cover-cropping effects on the persistence of E. canadensis seedbanks. Attenuation of germination cues by cover crops could result in lower seedbank losses to germination compared with expressive weed management tactics, such as repeated shallow (<5-cm) tillage with a rotary harrow, that aim to encourage weed seed germination in fallow phases before cash crop planting in no-till systems (Schappert et al. Reference Schappert, Messelhauser, Saile, Peteinatos and Gerhards2018).
Cover crop effects on size inequality of Erigeron canadensis populations
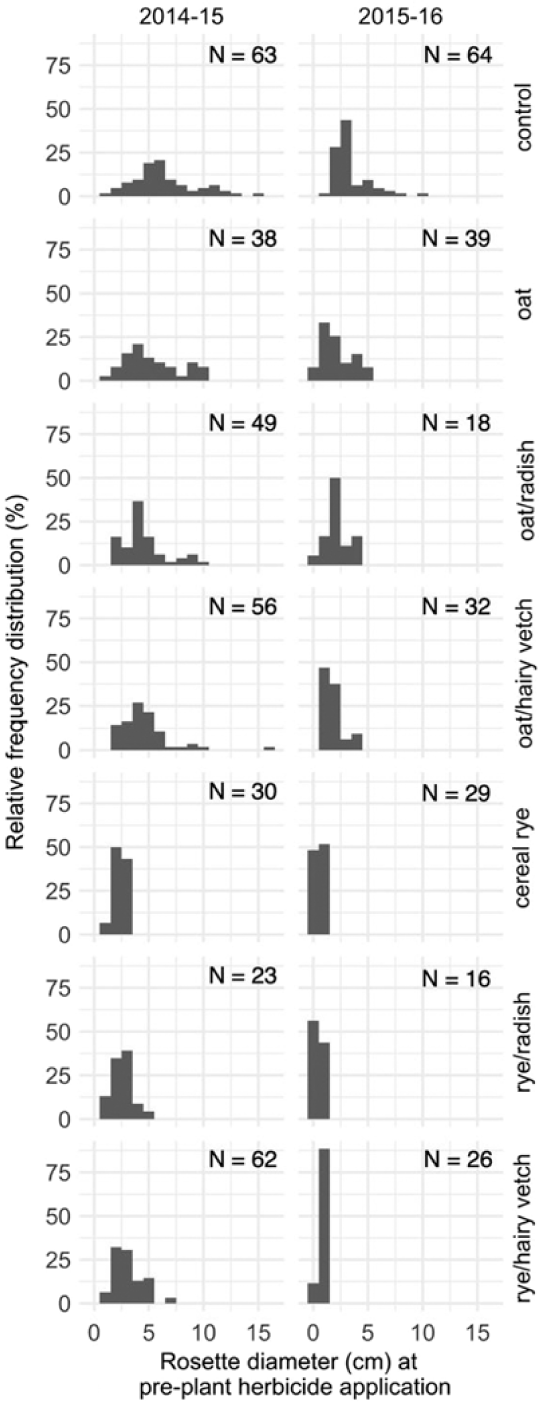
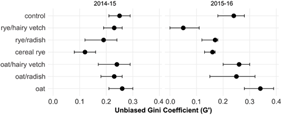
Visual inspection of frequency distributions by treatment level and study year indicate that the E. canadensis population in control treatments contained a greater number of large individuals compared with cover crop treatments (Figure 5). Unbiased Gini coefficients were calculated to provide a statistical comparison of the variation in E. canadensis plant size within populations (i.e., size inequality) among cover crop treatments (Figure 6). In the first year, size inequality was less (i.e., lower Gini coefficient) in the cereal rye treatment compared with other treatments except for rye/radish. In the second year, cereal rye alone and in mixture with hairy vetch or forage radish resulted in less size inequality compared with the control treatment. In each case, lower size inequality resulted from cereal rye monocultures or mixtures constraining the population to small individuals. These results suggest that cover-cropping tactics that promote high levels of resource acquisition in the spring growing season are more likely to eliminate the fitness advantage of large individuals at the time of a preplant burndown application.

Figure 5. Effect of cover crop treatments on relative frequency distribution of Erigeron canadensis rosette diameter (cm) at the preplant burndown herbicide application across two growing seasons (2014–2015, 2015−2016). Sampled E. canadensis plants (N) were pooled across fertility treatments and replicates.

Figure 6. Effect of cover crop treatments on Erigeron canadensis rosette size inequality at the time of the preplant burndown herbicide application in spring of 2014–2015 and 2015–2016 using the unbiased Gini coefficient (G′) test statistic (0–1 scale). A minimum value of zero indicates a population in which all individuals are of equal size, and values closer to zero indicate populations with more uneven size distributions. Sampled E. canadensis plants were pooled across fertility treatments and replicates. Error bars denote 95% confidence intervals obtained from 2,000 bootstrapped data sets. Non-overlapping treatments indicate significant difference.
Erigeron canadensis size at the time of herbicide exposure has been shown to directly influence selection intensity for glyphosate resistance. Dinelli et al. (Reference Dinelli, Marotti, Bonetti, Minelli, Catizone and Barnes2006) reported that ED50 values were approximately the same for susceptible (S) and resistant (R) populations following glyphosate applications at the 2-leaf stage, but R biotypes were approximately three times more resistant to glyphosate compared with S biotypes when applications were made at the rosette stage. Reduced or altered translocation of herbicides is likely the primary mechanism that confers a size-based fitness advantage in glyphosate-resistant E. canadensis (Dinelli et al. Reference Dinelli, Marotti, Bonetti, Minelli, Catizone and Barnes2006). There is currently widespread concern over the increasing prevalence of weed species that evolve such non–target site resistance mechanisms (Powles and Yu Reference Powles and Yu2010). Notably, altered transport mechanisms of resistance are considered the most likely to develop in response to increased use of synthetic auxin herbicides (SAH) in SAH-tolerant crop production systems (Busi et al. Reference Busi, Goggin, Heap, Horak, Jugulam, Masters, Napier, Riar, Satchivi, Torra, Westra and Wright2017). Our results suggest that integration of cover crops could potentially reduce selection intensity for SAH resistance in E. canadensis or other winter annual species by reducing the potential of a size-dependent fitness advantage for biotypes that develop non–target site resistance mechanisms.
Though these results clearly demonstrate the potential for cover crops to constrain the size of individual weeds at the time of herbicide exposure, our experiment was not designed to disentangle the opposing effects of cover crops on herbicide efficacy as outlined in the hypotheses presented in Figure 1B. Cover crop interference with herbicide deposition is, however, a plausible explanation for the higher observed survival rates of E. canadensis to preplant herbicides in the oats/hairy vetch mixture in the first study year (Table 4). Looking forward, more detailed experiments are needed that quantify cover crop effects on herbicide deposition patterns in order to understand how alternative cover-cropping tactics mediate interactions between weed size distributions, the level of herbicide exposure, and demographic transition rates.
Which cover crop response traits influence Erigeron canadensis population dynamics?
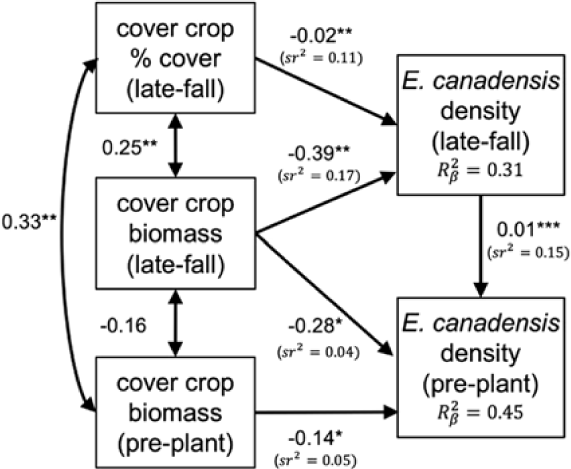
The hypothesized model of relationships between cover crop response traits and subannual E. canadensis population dynamics fits the observed relationships in the data (Fisher’s C = 4.1, df = 4, P = 0.39; Figure 7). Aboveground cover crop biomass in late fall and just before a preplant herbicide application had a direct negative effect on E. canadensis density just before a preplant herbicide application, and E. canadensis density in late fall was positively correlated with E. canadensis density just before a preplant herbicide application. Cover crop ground cover (%) and aboveground biomass in late fall had a direct negative effect on late-fall E. canadensis density, and thus an indirect negative effect on E. canadensis density just before a preplant herbicide application.

Figure 7. Fitted structural equation model (SEM) illustrating direct and indirect relationships between late-fall cover crop ground cover (%), fall and spring cover crop biomass (Mg ha−1), and late-fall and spring Erigeron canadensis population density. Spring data were collected just before a preplant herbicide application (i.e., preplant). Covariance between exogenous variables are presented as partial Pearson correlations (double-headed arrows). Unstandardized prediction coefficients are presented with significance levels (*P < 0.05; **P < 0.01; ***P < 0.001) for each path. The proportion of variance explained by fixed effects (R2β) is reported for each component model, and unique variance explanation (sr2) is reported for predictor variables.
Prediction coefficients presented in Figure 7 are partial regression coefficients plotted in the original units of the explanatory and dependent variables. Consequently, we use caution when drawing inferences about the relative strength (i.e., slope) of predictor variables, because there is no firm ecological basis to compare the effect size of one predictor relative to another when they differ in raw units (Grace and Bollen Reference Grace and Bollen2005). Based on these criteria, our model results indicate that the strength of the relationship (i.e., slope) between late-fall cover crop biomass and E. canadensis density just before a preplant application is greater than the relationship between preplant cover crop biomass and E. canadensis density, but we do not draw inferences about the strength of the relationship between late-fall E. canadensis density on spring E. canadensis density relative to cover crop biomass response traits.
Semipartial coefficients (sr2) provide another measure of the relative importance of predictor variables on E. canadensis demography. The unique variance explanations of cover crop ground cover and late-fall biomass on fall E. canadensis density were 0.11 and 0.17, respectively, which accounted for most of the total variance explained (R2β = 0.31) by the fixed effects in the model (Figure 7). The unique variance explanations of fall and preplant cover crop biomass and late-fall E. canadensis density on E. canadensis density just before a preplant herbicide application were 0.04, 0.05, and 0.15, respectively. However, the total variance explained by the fixed effects in this model (R2β ) was 0.45, which means 0.21 of the explained variance is shared among predictors.
Recent studies have not found strong relationships between the functional diversity of cover crop mixtures and enhanced weed suppression (Baraibar et al. Reference Baraibar, Hunter, Schipanski, Hamilton and Mortensen2018; Holmes et al. Reference Holmes, Thompson and Wortman2017; Smith et al. Reference Smith, Atwood, Pollnac and Warren2015). In each study, cover crop species with traits that led to high resource acquisition (aboveground biomass, % ground cover) were weed suppressive in monoculture and tended to dominate cover crop mixtures. Similarly, our results suggest that optimizing suppression of E. canadensis, and likely other facultative winter annuals, can be achieved by employing monocultures or two-species mixtures that maximize resource acquisition (biomass and ground cover) in the fall growing season. Our results suggest that grass/radish mixtures can be employed to enhance resource acquisition while having minimal impact on seed costs and management complexity related to terminating and planting into high biomass cover crops. Forage radish has been shown to be suppressive of both fall and early-spring weeds via high levels of resource pre-emption in the fall (Lawley et al. Reference Lawley, Teasdale and Weil2012), and thus is uniquely suited for targeting facultative winter annual weeds in growing-season windows following small grains in the northeastern United States, while facilitating lower grass-seeding rates and total seed costs.
The need for complementarity between management tactics is implicit in calls for novel IWM strategies to manage herbicide resistance, yet the interactive effects of cover crop and herbicide-based tactics on weed population dynamics have received relatively little attention. We suggest three areas of investigation to advance our understanding of cover-cropping tactics as a component of herbicide-resistance management. First, empirical studies of weed population dynamics in response to cover-cropping tactics could benefit from integration with current modeling approaches that use knowledge of weed demography in response to alternative management scenarios and population genetics to assess the risk of herbicide-resistance evolution (Liu et al. Reference Liu, Bridges, Kaundun, Glasgow, Owen and Neve2017; Renton et al. Reference Renton, Busi, Neve, Thornby and Vila-Aiub2014). We note that cover-cropping tactics rely on natural weed population–regulating mechanisms, which are more complex and less predictable than herbicide-based tactics. Consequently, herbicide-resistance models will need to be informed by empirical studies to provide a realistic account of demographic stochasticity that occurs at both spatial and temporal scales in response to alternative cover-cropping tactics. Second, we suggest that cover-cropping tactics should be developed and communicated as a component of a proactive, concept-based approach to resistance management, rather than a prescriptive tool. Certainly, more prescriptive management responses will be needed to address current glyphosate- and multiple-resistant weeds in no-till systems. In the long-term, however, land managers will need to use their site-specific knowledge to adapt concept-based, herbicide-resistance management strategies that employ ecologically based tactics. Studying the general demographic patterns of weeds with similar traits (Barberi et al. Reference Barberi, Bocci, Carlesi, Armengot, Blanco-Moreno and Sans2018; Storkey et al. Reference Storkey, Holst, Bojer, Bigongiali, Bocci, Colbach, Dorner, Riemens, Sartorato, Sonderskov and Verschwele2015b) in response to alternative cover-cropping tactics is a promising approach that is compatible with the goal of developing and communicating concept-based, herbicide-resistance management approaches. Moving forward, comparative demographic studies could be used profitably to reconcile the need for demographic understanding at the weed species level while developing broader, community-level weed management strategies. Finally, we suggest that assessments of cover-cropping tactics as herbicide-resistance management tools should refrain from narrow evaluations of weed control efficacy and cost-effectiveness relative to alternative herbicide-based approaches. Rather, we advocate for the contribution of cover crops toward herbicide-resistance management to be considered within the context of other provisioning (e.g., crop production), regulating (e.g., pest management), and supporting (e.g., nutrient cycling) services provided by cover crops in agroecosystems (Schipanski et al. Reference Schipanski, Barbercheck, Douglas, Finney, Haider, Kaye, Kemanian, Mortensen, Ryan, Tooker and White2014; Storkey et al. Reference Storkey, Doring, Baddeley, Collins, Roderick, Jones and Watson2015a). Cover-cropping tactics principally designed for weed management are likely to produce trade-offs among these services, including both positive and negative impacts on other desired services and grower priorities. Broad, multicriteria assessments that use an ecosystem service framework will more accurately reflect the costs and benefits of integrating cover crops as a herbicide-resistance management tool in agroecosystems.
Author ORCID
John M. Wallace https://orcid.org/0000-0003-1120-3770
Acknowledgments
This research was funded by USDA-CPPM Award 2014-70006-22521. No conflicts of interest have been declared. We are grateful for the assistance of Mark Dempsey, Tosh Mazzone, Dayton Spackman, Brosi Bradley, Jess Bunchek, and many undergraduate employees. We would also like to acknowledge collaborator Mark VanGessel for contributions to the development of this project and thank the RELARC farm staff for their time and support.