


INTRODUCTION
Sucking lice (Anoplura) are obligate, permanent ectoparasites of eutherian mammals and are believed to have shared an intimate biological relationship with their hosts through evolutionary time, as evidenced by the high incidence of host specificity and monoxeny (Kim, Reference Kim, Morand, Krasnov and Poulin2006). The probable origin of Anoplura dates back to the mid-Cretaceous period and the diversity within the group is frequently correlated to the divergence of placental mammals (Hopkins, Reference Hopkins1949; Ledger, Reference Ledger1980; Smith et al. Reference Smith, Ford, Johnson, Johnson, Yoshizawa and Light2011). It is believed that global parasite biodiversity is currently greatly underestimated (Bensch et al. Reference Bensch, Stjerman, Hasselquist, Ostman, Hansson, Westerdahl and Pinheiro2000; Poulin and Morand, Reference Poulin and Morand2004; Locke et al. Reference Locke, McLaughlin and Marcogliese2010). This is also exemplified by the Anoplura since the number of recognized species worldwide (n = 532) has quadrupled within the last century (Durden and Musser, Reference Durden and Musser1994) and it has been speculated that the true number of species is probably between 1000–1500 (Kim et al. Reference Kim, Emerson, Traub, Kosztarab and Schaefer1990).
The genus Polyplax (Phthiraptera: Anoplura) contains 78 known species, which occur predominantly on members of the rodent family Muridae (Durden and Musser, Reference Durden and Musser1994). Polyplax arvicanthis (Bedford, 1919) has been documented exclusively on the four-striped mouse genus, Rhabdomys (Ledger, Reference Ledger1980) which is widely distributed throughout the southern African subregion (Skinner and Chimimba, Reference Skinner and Chimimba2005). The specificity of P. arvicanthis is reflected in the nomenclature (Rhabdomys was originally assigned to the genus Arvicanthis; Meester et al. Reference Meester, Rautenbach, Dippenaar and Baker1986), and where this association has been thoroughly studied, P. arvicanthis has been recorded to have high prevalence (60%) and abundance (Matthee et al. Reference Matthee, Horak, Beaucournu, Durden, Ueckermann and McGeoch2007, Reference Matthee, McGeoch and Krasnov2010).
Within Rhabdomys (Thomas, 1916), a single species (R. pumilio) was originally recognized, until molecular evidence (supported by ecological divergence) led to the recognition of 2 species; the arid-adapted R. pumilio (Sparrman, 1784) and mesic-adapted R. dilectus (De Winton, 1897; Rambau et al. Reference Rambau, Robinson and Stanyon2003; Musser and Carleton, Reference Musser, Carleton, Wilson and Reeder2005). Subsequently, Castiglia et al. (Reference Castiglia, Solano, Makundi, Hulselmans and Verheyen2011) and du Toit et al. (Reference du Toit, Jansen van Vuuren, Matthee and Matthee2012) conducted more in-depth analyses and indicated that both R. dilectus and R. pumilio contain multiple genetic lineages. Pertinent to the focus of the current study, the arid-adapted R. pumilio consists of 3 geographically structured genetic lineages representing distinct species (du Toit et al. Reference du Toit, Jansen van Vuuren, Matthee and Matthee2012). When this diversity is incorporated into Rhabdomys taxonomy, it can be argued that at least 4 species exist within southern Africa. The names R. dilectus, R. pumilio, R. intermedius and R. bechuanae have been suggested based on the distributions of previously described subspecies and are further used herein (Fig. 1; Rambau et al. Reference Rambau, Robinson and Stanyon2003; du Toit et al. Reference du Toit, Jansen van Vuuren, Matthee and Matthee2012).
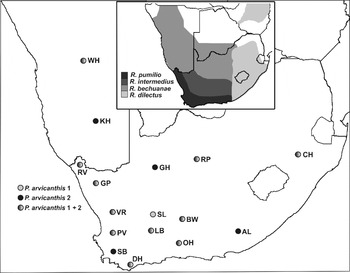
Fig. 1. Localities from which Polyplax arvicanthis were sampled, indicating areas of sympatric and allopatric occurrence of the 2 clades (P. arvicanthis 1 and 2), with locality codes as in Table 1. The inset represents the distribution of the different host species following Rambau et al. (Reference Rambau, Robinson and Stanyon2003) and du Toit et al. (Reference du Toit, Jansen van Vuuren, Matthee and Matthee2012).
Cryptic species (morphologically similar, but genetically distinct; Andrews et al. Reference Andrews, Monis, Ey and Mayrhofer1998) have been documented within a wide range of parasitic groups (see de León and Nadler, Reference de León and Nadler2010; Nadler and de León, Reference Nadler and de León2011; Perkins et al. Reference Perkins, Martinsen and Falk2011). Parasites are especially prone to harbour cryptic diversity since their reduced bodily features, small size, and morphological stasis often make finding variable morphological characters problematic (Perkins et al. Reference Perkins, Martinsen and Falk2011), particularly among closely related species (Nadler and de León, Reference Nadler and de León2011). Hence, the importance of molecular tools for cataloguing diversity within parasites, preferably using multiple genes, is being increasingly recognized (McManus and Bowles, Reference McManus and Bowles1996; Nadler, 1990, Reference Nadler2002; Nadler and de León, Reference Nadler and de León2011; Perkins et al. Reference Perkins, Martinsen and Falk2011). Since the current description of P. arvicanthis is based solely on morphological characteristics (Johnson, Reference Johnson1960; Ledger, Reference Ledger1980) and given that this parasite has a large geographical range spanning 4 host species within southern Africa (du Toit et al. Reference du Toit, Jansen van Vuuren, Matthee and Matthee2012), it is probable that undetected evolutionary divergence may exist within what is currently recognized as a single species.
To test the hypothesis that hidden genetic diversity, potentially associated with Rhabdomys divergences (Rambau et al. Reference Rambau, Robinson and Stanyon2003; du Toit et al. Reference du Toit, Jansen van Vuuren, Matthee and Matthee2012), may be present within P. arvicanthis we embarked on an investigation using multiple molecular markers and included several P. arvicanthis specimens sampled throughout southern Africa.
MATERIALS AND METHODS
Taxon and gene sampling
Polyplax arvicanthis specimens were collected from 16 localities across the distribution of the four Rhabdomys species (Table 1; Fig. 1). Live traps (Sherman-type) baited with a mixture of peanut butter and oats were used to capture host individuals (Permit numbers: Northern Cape, 0904/07; Western Cape, AAA004-00034-0035; Namibia, 1198/2007; Eastern Cape, CRO37/11CR and CRO38/11CR; and SANPARKS, 2007-08-08SMAT). Mice were euthanized with 0·2–0·4 ml sodium pentobarbitone (200 mg kg−1) and placed in individual plastic bags to prevent the loss of ectoparasites post-mortem (Stellenbosch University ethics clearance: 2006B01007). Host specimens were frozen in the field at −20 °C and subsequently thawed in the laboratory, where all lice were removed with forceps under a stereoscopic microscope. For the DNA analyses, P. arvicanthis specimens were selected from as many different host individuals as possible per sampled locality (determined by parasite prevalence and abundance; Table 1), and placed in a 100% EtOH solution. The remainder of the lice collected from Rhabdomys at each site were preserved in 70% EtOH for morphological confirmation (identifications provided by L. A. Durden, Department of Biology, Georgia Southern University, USA). All specimens were identified as belonging to a single species, P. arvicanthis, based on gross morphological examination.
Table 1. Geo-referenced localities and hosts from which Polyplax arvicanthis were collected

Mitochondrial COI (Cytochrome Oxidase I) sequence data were generated for 299 P. arvicanthis specimens from the 16 sampled localities (Table 1) and these sequences were collapsed to haplotypes (Collapse 1.2; Posada, Reference Posada2004). Phylogenetic reconstructions (outlined below) were performed on these haplotypes, which indicated the presence of 2 highly divergent genetic clades (see Results section). Based on the need to include multiple markers for accurate phylogenetic inference (Nadler, Reference Nadler2002), the COI gene tree was supplemented with data derived from the mitochondrial 12S and 16S rRNA, and nuclear CAD (carbamoyl-phosphate synthetase 2, aspartate transcarbamylase, and dihydroorotase) genes. The latter was performed for a representative subsample of the COI haplotypes, specifically selected to optimally cover the genetic and geographical variation present within P. arvicanthis based on the results of the phylogenetic analyses (see below). One haplotype from each COI clade present at each of the 16 sampled localities was included (in most instances 2 haplotypes per locality, Tables 1, A1, A2; Fig. 1).
Molecular techniques
Total genomic DNA was extracted from whole individual louse specimens with a commercial kit (Qiagen, DNeasy® Blood and Tissue). PCR and sequencing of all gene fragments were performed following standard polymerase chain reaction (PCR) protocols in a GeneAmp® PCR system 2700 thermal cycler (Applied Biosystems). General PCR cycling conditions for the 12S rRNA, 16S rRNA and CAD genes included an initial denaturation of 3 min at 94 °C followed by 30–40 cycles of 30 s denaturation at 94 °C, 45–60 s annealing at the primer-specific temperature (Table 2), and 45–60 s extension at 72 °C, followed by a final extension period of 5 min at 72 °C. For the COI gene, the primers LCOIP6625 and HCOIPrev were used (Table 2) and the PCR conditions were as follows: an initial denaturation of 1 min at 95 °C followed by 10 cycles of 1 min denaturation at 95 °C, 1 min annealing at 45 °C, and 1 min extension at 72 °C after which 30 cycles of 1 min denaturation at 93 °C, 1 min annealing at either 58 °C or 59 °C (depending on amplification success), and 1 min extension at 72 °C was performed followed by a final extension of 5 min at 72 °C. Aliquots of PCR products (5 μL) were separated by electrophoresis on a 1% agarose gel for visual inspection, after which purification was performed on the remaining PCR product with a commercial kit (Macherey-Nagel, NucleoFast 96 PCR Kit). In some instances fragments were excised and purified using a commercial gel purification kit (Promega, Wizard® SV Gel Clean-Up System). All cycle-sequencing reactions were performed using BigDye Chemistry and products were analysed on an automated sequencer (ABI 3730 XL DNA Analyzer, Applied Biosystems).
Table 2. Primers used for PCR amplification of the various gene fragments

Data analysis
Sequences were edited in BioEdit Sequence Alignment editor 7.0.5 (Hall, Reference Hall2005) and aligned with multiple alignment mode in Clustal X2 (Larkin et al. Reference Larkin, Blackshields, Brown, Chenna, McGettigan, McWilliam, Valentin, Wallace, Wilm, Lopez, Thompson, Gibson and Higgins2007). The ends of sequences were trimmed to avoid the inclusion of missing data, with the final alignment lengths as indicated in Table 3. Within the COI alignment, a 3 bp or 6 bp insert was present within P. arvicanthis specimens when compared with outgroup taxa. No double reads were present in the original chromatograms and to further ensure that these sequences represented the functional copy of the protein coding COI gene, all sequences were translated into protein sequences using the online tool EMBOSStranseq (www.ebi.ac.uk/Tools/st/emboss_transeq).
Table 3. The number of ingroup samples (N), amplified and final alignment length, polymorphic sites (P), and parsimony informative sites (PI) for each gene fragment

* Excluding the two 3 bp indels coded as presence/absence.
Phylogenetic reconstructions
A single specimen of Haematopinus phacochoeri (sampled from the warthog, Phacochoerus africanus) was used as a distant outgroup in all analyses (GenBank Accession nos JX 218028–218030; Table 4). Several additional species of Anoplura, for which sequence data were available on GenBank, were used as reference taxa in the various phylogenetic analyses (Table 4). Parsimony and Bayesian reconstructions were performed on all the COI haplotypes. For the subsampled datasets, parsimony and Bayesian trees were constructed for each gene fragment individually (COI, 12S, 16S and CAD) followed by combined analyses of the mtDNA fragments as well as a combined mtDNA and nDNA dataset. The COI insertions were coded as present/absent data and included in the analyses. Sequence ambiguities resulting from heterozygous positions of the nuclear CAD gene were treated as polymorphisms. To further investigate the divergence among the 2 P. arvicanthis clades with respect to other recognized Polyplax species, a reduced COI Bayesian topology was constructed using data derived from GenBank (Tables 4 and A3).
Table 4. GenBank Accession numbers for outgroup taxa used in the different gene analyses
Unweighted parsimony analyses were conducted in PAUP* v 4.0b10 (Swofford, Reference Swofford2000). In each analysis, the heuristic search option with random taxon addition (10 replicates) and tree bisection and reconnection (TBR) branch swapping was implemented and a maximum of 100 equally parsimonious trees were saved during each step. Nodal support was assessed with 1000 bootstrap replicates (Felsenstein, Reference Felsenstein1985). Best-fit models of sequence evolution for all gene fragments were determined under the AICc (Akaike, Reference Akaike, Petrov and Csaki1973; Burnham and Anderson, Reference Burnham and Anderson2002, 2004) in jModelTest v0.1.1 (Guindon and Gascuel, Reference Guindon and Gascuel2003; Posada, Reference Posada2008) and implemented in Bayesian tree reconstructions in MrBayes v3.2 (Ronquist et al. Reference Ronquist, Teslenko, van der Mark, Ayres, Darling, Hohna, Larget, Liu, Suchard and Huelsenbeck2012). The effect of codon partitioning on the marginal likelihoods for the protein coding COI and CAD genes was evaluated with Bayes factors (Kass and Raftery, Reference Kass and Raftery1995), as calculated in Tracer v1.5 (Newton and Raftery, Reference Newton and Raftery1994; Suchard et al. Reference Suchard, Weiss and Sinsheimer2001; Rambaut and Drummond, Reference Rambaut and Drummond2007). For all analyses, only the general structure of the model was defined and the default priors were used to estimate parameters. In each analysis, 2 parallel Markov Chain Monte Carlo (MCMC) simulations, consisting of 5 chains each, were run for 2–5 million generations depending on when it was estimated that stationarity had been reached. Trees and parameters were sampled every 100 generations, and 25% of the total number of generations sampled were discarded as burn-in after convergence and ESS values were assessed in Tracer v1.5 (Rambaut and Drummond, Reference Rambaut and Drummond2007). Posterior probabilities for nodal support were obtained by using the sumt command in MrBayes. COI GTR-corrected sequence distances were calculated in PAUP* v4.0b10 (Swofford, Reference Swofford2000) to compare sequence divergence estimates among species/lineages.
RESULTS
The 299 P. arvicanthis specimens revealed 94 COI haplotypes (Table A1; GenBank Accession nos JX629372 – JX629438, JX198372 – JX198398). A total of 27 COI haplotypes were selected (see above, Table A1) and sequences were generated for the 16S rRNA and CAD gene fragments (GenBank Accession nos JX198319 – JX198345, JX198399 – JX198425; Tables 3 and A2). Despite numerous attempts, 12S rRNA data for 1 haplotype (LB_1) could not be obtained, resulting in a total of 26 haplotypes for this dataset (GenBank Accession nos JX198346 – JX198371; Tables 3 and A2).
Bayes factors indicated that partitioning by codon position with a separate model assigned to each partition was preferred over an unpartitioned scheme with a single model, for both the protein coding COI and CAD genes (Table A4). Thus, the JC model (nst = 1, rates = equal) was assigned to the first and second codon positions of COI and all 3 codon positions of CAD. The HKY (nst = 2, rates = equal), GTR + I+G (nst = 6; rates = invgamma), and GTR + G (nst = 6; rates = gamma) models were specified for the third codon position of COI, the 12S rRNA, and 16S rRNA genes respectively.
Phylogenetic analyses of the 94 COI haplotypes revealed the presence of 2 well-supported genetic clades (Table 5 and Fig. B1) differentiated by an average of 25% (±0·02) sequence divergence, which is comparable to values observed among other recognized species of Polyplax (Table A4). Considerable variation is also present within the 2 P. arvicanthis clades, especially within P. arvicanthis 2 (Fig. 2) which has an average intra-clade divergence of 16% (±7·34) compared with 11% (±7·91) within P. arvicanthis 1. For the representative subset of 26/27 haplotypes, the monophyly of P. arvicanthis was strongly supported in nearly all individual and combined analyses (parsimony and Bayesian; Table 5; Fig. 2) of the various genes. The combined analyses (parsimony and Bayesian) of the 3 mtDNA fragments (Fig. 2) provided the highest posterior probability support for the existence of 2 clades within P. arvicanthis (1 and 2) and the same pattern emerged when all the data were combined (Table 5; also see Light and Reed (Reference Light and Reed2009) and Light et al. (Reference Light, Smith, Allen, Durden and Reed2010) showing greater support from combined analyses). Support for the 2 clades varied among the individual parsimony and Bayesian gene trees (Table 5), and in instances where the nodes were not obtained they reflect polytomies (unresolved). All of the nodal uncertainty found in the individual gene analyses surrounded the monophyly of P. arvicanthis 2. Importantly, however, individuals belonging to the 2 Polyplax clades are consistently differentiated by the presence of the 6 bp (P. arvicanthis 1) or 3 bp (P. arvicanthis 2) insert within COI when compared with other Polyplax species, and this more conservative substitution (Matthee et al. Reference Matthee, Burzlaff, Taylor and Davis2001) provides further support for the monophyly of each of the 2 lineages.

Fig. 2. Consensus parsimony and Bayesian topology of the combined mtDNA dataset (posterior probabilities above and bootstraps below nodes), indicating the 2 clades within Polyplax arvicanthis.
Table 5. Bootstrap and posterior probability support values for the monophyly of Polyplax arvicanthis and the 2 clades therein resulting from the various single and combined gene analyses

* nf, Not found.
Analysis of the phylogenetic relationships within Polyplax (using COI data obtained from GenBank; Fig. 3), place the 2 P. arvicanthis lineages as sister taxa within a clade containing P. spinulosa, P. borealis and P. serrata. Branch lengths separating the P. arvicanthis lineages are comparable to those separating the other recognized species. The topology also supports the previously reported non-monophyly of the family Polyplacidae (Light et al. Reference Light, Smith, Allen, Durden and Reed2010). It is, however, important to realize that the relationships within the genus as portrayed herein is based on a fraction of the total number of known Polyplax species and additional data (species and molecular markers) are needed to obtain more robust support for these preliminary phylogenetic findings.

DISCUSSION
The existence of 2 genetically distinct, reciprocally monophyletic clades within P. arvicanthis is strongly supported in nearly all our analyses. The COI sequence divergence between these clades, also illustrated by branch lengths, is comparable to that found between other Polyplax species. Although the exact taxonomic status of these clades is not yet clear (and data from more Polyplax species are needed to determine whether they represent sister-taxa), this questions the notion that P. arvicanthis represents a single species (Bedford, 1919; Ledger, Reference Ledger1980).
The apparent absence of morphological differentiation among the 2 genetically divergent P. arvicanthis lineages suggests that they may represent cryptic species. The discovery of cryptic species through the use of molecular tools has been documented widely in several parasitic groups (de León and Nadler, Reference de León and Nadler2010) and this may be attributed to the reduced morphological features associated with the parasitic mode of life (Nadler and de León, Reference Nadler and de León2011; Perkins et al. Reference Perkins, Martinsen and Falk2011). It should, however, be noted that further morphological investigation, especially using features that have not previously been used in alpha taxonomy, may reveal differences among the P. arvicanthis lineages (see Yoshizawa and Johnson, Reference Yoshizawa and Johnson2006; Schlick-Steiner et al. Reference Schlick-Steiner, Seifert, Stauffer, Christian, Crozier and Steiner2007) which will provide further evidence for the existence of 2 species on Rhabdomys. Until such investigations have been conducted, the 2 genetic lineages identified in our study should therefore remain provisionally cryptic (de León and Nadler, Reference de León and Nadler2010).
Parasite genetic divergence does not mirror that observed within the host since, for both P. arvicanthis lineages, the lice collected from R. dilectus, R. pumilio, R. intermedius and R. bechuanae do not form monophyletic entities (du Toit et al. Reference du Toit, Jansen van Vuuren, Matthee and Matthee2012). In addition, the 2 parasite lineages have sympatric distributions throughout most of the sampled range of all host lineages. Our findings are not unique in the sense that closely related lineages of sucking lice occurring sympatrically on a single host species has been documented previously (Reed et al. Reference Reed, Smith, Hammond, Rogers and Clayton2004; Štefka and Hypša, Reference Štefka and Hypša2008). It has been postulated that the sympatric occurrence of closely related parasitic groups may arise through colonization (switching from another host) or parasite duplication (shared common ancestor on particular host; Page, Reference Page2003). A sister relationship between the 2 lineages would thus favour parasite duplication over colonization due to host-switching. In the present analysis the 2 divergent P. arvicanthis lineages represent sister-taxa (0·99 posterior probability support) which, in combination with the presence of unique insertions within both P. arvicanthis lineages (when compared with other available Polyplax species), supports the idea of a common ancestor on Rhabdomys followed by duplication. Unfortunately, the paucity of sequence data for African Polyplax precludes a firm statement regarding the sister-taxon status of these lineages and we cannot rule out the possibility that the insertions may also be present in other African Polyplax. However, P. arvicanthis is specific to Rhabdomys as it has not been documented on any other co-occurring rodent taxa within southern Africa (Ledger, Reference Ledger1980; Durden and Musser, Reference Durden and Musser1994), and is also morphologically distinct from the Polyplax species parasitizing these co-occurring hosts (Ledger, Reference Ledger1980). Given the specificity to Rhabdomys and the apparent lack of morphological differences among the 2 P. arvicanthis lineages, a recent common ancestor on Rhabdomys followed by a parasite duplication event is a more parsimonious evolutionary scenario than morphological convergence of distantly related louse lineages following colonization of one of the lineages from another host (i.e. host switching).
Parasite duplication may occur via sympatric or allopatric speciation (Johnson and Clayton, Reference Johnson and Clayton2004). Multiple instances of sympatric speciation would be needed to explain the broad sympatric occurrence of the 2 louse taxa in this study. Thus, parasite duplication through allopatric speciation caused by temporary fragmentation of host populations (Page, Reference Page2003), followed by mutual secondary colonizations of hosts, appears to be the most parsimonious explanation for the pattern we observed. Rhabdomys probably experienced multiple expansion-contraction cycles during glacial–interglacial phases (Zachos, Reference Zachos2001) and allopatric divergence of the parasite would be enhanced by the short generation times (Huyse et al. Reference Huyse, Poulin and Theron2005; Whiteman and Parker, Reference Whiteman and Parker2005) and faster evolutionary rates (Hafner et al. Reference Hafner, Sudman, Villablanca, Spradling, Demastes and Nadler1994; Paterson and Banks, Reference Paterson and Banks2001; Nieberding et al. Reference Nieberding, Morand, Libois and Michaux2004) generally observed in parasites. It is thus plausible that the 2 lineages within P. arvicanthis diverged in allopatry while isolated on host lineages within different refugia (du Toit et al. Reference du Toit, Jansen van Vuuren, Matthee and Matthee2012). If this holds, the current pattern resulted from mutual host colonizations of the 2 parasite taxa across the region. This dispersal would have been facilitated through the secondary contact observed among hosts (du Toit et al. Reference du Toit, Jansen van Vuuren, Matthee and Matthee2012). Importantly, however, host sympatry does not necessarily equate to parasite sympatry (McCoy, Reference McCoy2003), especially for P. arvicanthis which requires bodily contact to move between hosts (Hopkins, Reference Hopkins1949; Ledger, Reference Ledger1980; Marshall, Reference Marshall1981). From the parasite's perspective, host syntopy (occupation of same macro-habitat; Rivas, Reference Rivas1964) will therefore be more important than host sympatry in terms of dispersal opportunity between hosts. For P. arvicanthis, host syntopy probably does occur within the host contact zone and the co-occurrence of both cryptic lineages on the same host individuals implies that parasite syntopy also occurs in certain areas.
The present study clearly lends support to the suggestions of Kim et al. (Reference Kim, Emerson, Traub, Kosztarab and Schaefer1990), in that much of Anoplura diversity is yet to be discovered. Within P. arvicanthis, detailed morphological comparsions are needed to fully resolve the taxonomic status of the 2 genetic lineages and given the extensive variation observed within each of the 2 Polyplax assemblages, more fine-scale comparative phylogeographical analyses are required to unravel the complex patterns observed.
ACKNOWLEDGEMENTS
The National Research Foundation (NRF), South African Biosystematics Initiative (SABI) and Stellenbosch University provided financial support for this research. Private landowners, SANPARKS Scientific Services and other provincial nature conservation agencies are thanked for granting permission to trap on their property or in their respective reserves. Louse specimens were identified by L.A. Durden. Adriaan Engelbrecht, Claudine Montgelard, Bettine Jansen van Vuuren, Sandra Durand, Shelly Edwards and Wynand Heunis are thanked for field assistance. Renfu Shao and Stephen Barker are thanked for providing primer sequences.
APPENDIX A
Table A1. COI haplotypes identified from the 299 Polyplax arvicanthis specimens sampled from 16 localities (codes as in Table 1)

Table A2. GenBank Accession numbers for the gene sequences generated for the subset of specimens, with locality codes as in Table 1 and subscripts indicating P. arvicanthis clade 1 or 2

Table A3. GTR-corrected COI sequence distances among recognized Polyplax species, with GenBank Accession numbers

Table A4. Log10 Bayes Factors for alternative partitioning schemes (unpartitioned and partitioned by codon) of the protein coding COI and CAD genes

APPENDIX B

Fig. B1. Consensus Bayesian and Parsimony COI topology indicating the relationships among the 94 haplotypes within P. arvicanthis (codes as in Table 1). Posterior probabilities and bootstrap support values are indicated above and below nodes, respectively.


