


INTRODUCTION
Analyzing the paleoseismicity in a low-activity intraplate region is still challenging because most earthquakes are limited to a shallow crustal depth without evidence of rupture at the surface (Landgraf et al., Reference Landgraf, Kuebler, Hintersberger and Stein2016). In general, there is no long (>1 ka) paleoseismic record in stable continental regions. Western Europe is an intraplate region, influenced by both the collision between Eurasian and African plates (Ziegler and Dezès, Reference Ziegler and Dèzes2006) and glacio-isostatic deformations (Lambeck and Johnston, Reference Lambeck and Johnston2000; Marotta et al., Reference Marotta, Mitrovica, Sabadini and Milne2004). Very few outcrops allow for the analysis of paleoseismicity in Quaternary deposits on continental western Europe. In eastern and central Brittany, Neogene and Quaternary deposits are preserved within small valleys or basins (Van Vliet-Lanoë et al., Reference Van Vliet-Lanoë, Vandenberghe, Laignel, Laurent, Lauriat-Rage, Louwye and Mansy2002). In southern and western Brittany, such as the Crozon Peninsula and Bay of Brest, the low relief and “blocks and grabens” morphology inherited from the Neogene offer suitable conditions to preserve Quaternary deposits in depressions (Fig. 1). In this region, load casts and plastic deformations are commonly observed in Quaternary deposits and are interpreted as resulting from periglacial activity. Indeed, during the Quaternary glacial stages the region was occupied by discontinuous and/or continuous permafrost, allowing for the development of cryoturbation or the diagenesis of deformed sediments by differential frost heaving and solifluction processes (Van Vliet-Lanoë et al., Reference Van Vliet-Lanoë, Maygari and Meilliez2004; Table 1). However, frequent regional load cast figures do not correspond to periglacial criteria of formation, notably because of the absence of traces of ice segregation and of spatial regularity related to the classic control by desiccation polygons <1 m (Van Vliet-Lanoë et al., Reference Van Vliet-Lanoë, Maygari and Meilliez2004). In Brittany, meter-scale load casts are present in the Aber Ildut valley to the west of Brest, in the Elorn River valley, and on the Crozon Peninsula (Fig. 1B).

Figure 1 Location of the sections on the Crozon Peninsula and on the Elorn estuary. (A) Location of studied zones in the Armorican Massif framework. (B, C) LIDAR (light detection and ranging) image of the Bay of Brest entrance from the Litto3D LIDAR pictures. Completed for tectonic with data from the geologic map of the Department of Finistère, Bureau de recherches géologiques et minières 2008. P, Pénestin; R, sparker seismic profile Roscanvel (see Fig. 8); S, submarine slump. In panel C, major faults are in red; secondary faults are in black. (For interpretation of the references to color in this figure legend, the reader is referred to the web version of this article.)
Table 1 Characteristics of cryoturbations and coseismic involutions (completed from Van Vliet-Lanoë et al., Reference Van Vliet-Lanoë, Maygari and Meilliez2004).

Seismic surveys and coring within the Bay of Brest did not permit us to observe deposits older than the Weichselian (Grégoire et al., Reference Grégoire, Le Roy, Ehrhold, Jouet and Garlan2017). However, the Trez Rouz and Pen Hat sections located on the Crozon Peninsula are exceptional sites exhibiting the most complete sections of middle and upper Quaternary units in Brittany. Studying these sites gives us an opportunity to investigate farther back in time (from ~400 ka to present). The Trez Rouz site is locally famous because of its wavelike peat deformations, traditionally attributed to periglacial activity (Hallégouët, Reference Hallégouët1989). In addition, the entrance of the Elorn estuary (Fig. 1B) locally provided sediment traps, such as at the Kergleuz sections, which recorded and preserved an important part of the Plio-Quaternary geologic history. Sections presented in this study (Fig. 1B) were analyzed from stratigraphic and paleoseismic points of view before being compared to other dated sections with similar records: at Pénestin, close to the Vilaine River estuary (Southern Brittany), and at Le Gurp (Gironde River estuary, Aquitaine coast) (Figs. 1A and 2).
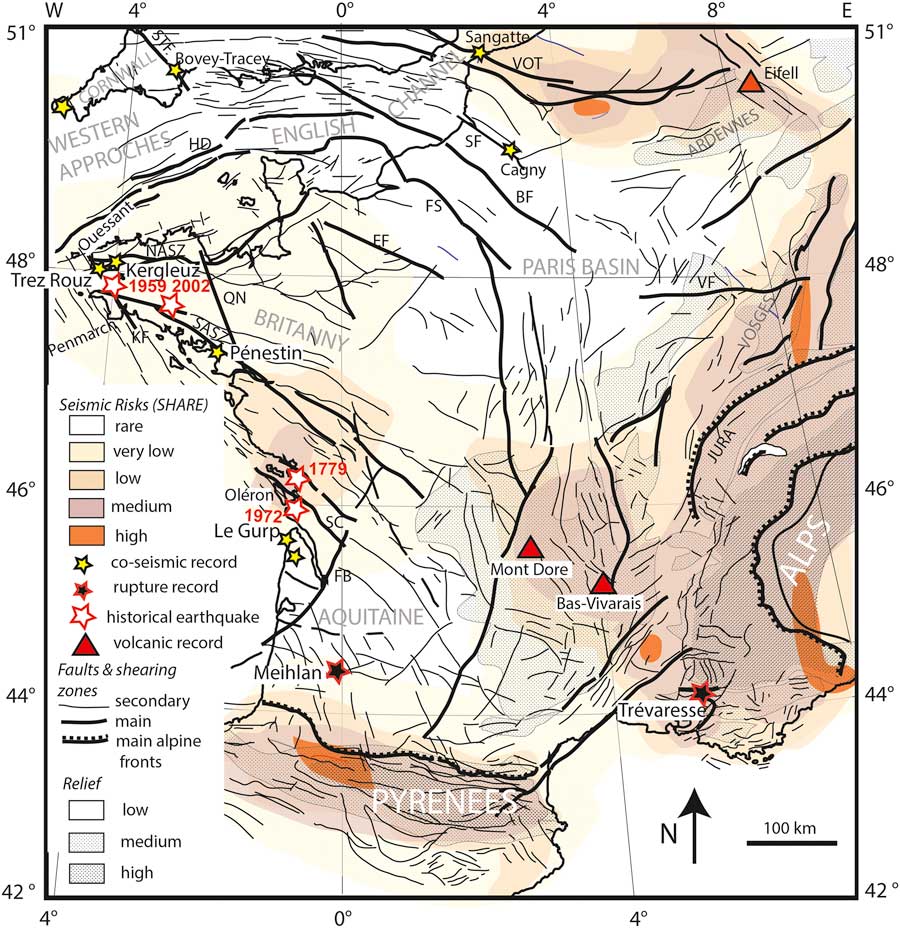
Figure 2 (color online) Map of the main superficial and subsurface faults and shearing zones compiled by the French Bureau de recherches géologiques et minières (1/1,000,000; https://www.geoportail.gouv.fr/donnees/cartes-geologiques) and the British Geological Survey. Details for Aquitaine: Rolet (Reference Rolet1997) and Gély and Sztràkos (Reference Gély and Sztràkos2000); details for northwestern France and Belgium: Mansy et al. (Reference Mansy, Manby, Averbuch, Everaerts, Bergerat, van Vliet-Lanoë and Lamarche2003). Official seismic risks map compiled by Giardini et al. (Reference Giardini, Woessner, Danciu, Cotton, Crowley, Grünthal and Pinho2013; European Seismic Hazard Map [ESHM], Seismic Hazard Harmonization in Europe [SHARE] program]). BF, Bray Fault; EF, Eure Fault; FB, Bordeaux Fault; FS, Seine Fault; HD, Hurd Deep; KF, Kerforne Fault; NASZ, North Armorican Shear Zone; QN, Quessoy–Nort sur Erdre Fault; SASZ, South Armorican Shear Zone; SC, Saintes-Cognac graben; SF, Somme Fault; STF, Sticklepath Fault; VF, Vittel Fault; VOT, Variscan overthrust.
In this article, we aim to define the tectonic, paleoenvironmental, and stratigraphic settings of several deformed Quaternary deposits to argue a mechanistic interpretation of the Quaternary deformation processes at the scale of western Brittany. We aim to determine whether nonperiglacial deformation might result from local or distal coseismic liquefaction of clayey saprolite, mud, and sand, because low magnitude earthquakes with no evidence of surface ruptures presently occur within the study area. Our data will provide a discussion of the processes responsible for the deformation structures, especially clay diapirism. We will also constrain the age of deformations with luminescence and paleoenvironmental methods. We rely on the age of these deformations with similar paleoseismic events recorded on (or close to) other Variscan structures in western Europe (Fig. 2). We also discuss these seismic events in the context of plate tectonics, glacio-isostatic mechanisms, and other less constrained processes, such as the impact of Earth’s rotational velocity and mantle activity on lithosphere unloading.
MATERIAL AND METHODS
A high-resolution swath bathymetric map of the Bay of Brest obtained by a multibeam echo-sounder survey coupled to a detailed topographic map of the Crozon Peninsula and surrounding areas (Litto3D program) are used to locate the most prominent faults controlling the topography. Altitudes are given in meters NGF (French Ordnance Survey, 5 m NGF corresponding to above sea level [asl]). A seismic profile (Fig. 3) was also performed to distinguish the offshore continuity of onshore faults at depth. This profile was acquired with a Sparker Source, a six channel SIG streamer, and a numerical DELPH2 acquisition system. The sparker emission energy ranges from 250 to 500 J, the shooting rate is 1.5 s, and the vessel bottom speed is 5 knots. Seismic processing (simple stacking and filtering, Butterworth, 200–800 Hz) was done to enhance data quality with SPW (Parallel Geosciences Corporation) and Seismic Unix softwares.

Figure 3 (color online) Trez Rouz graben geologic section with saprolite depth at scale (A) and a comparable Sparker seismic profile no. P4450, on its prolongation in the Bay of Roscanvel (B). Stippled lines below structures A to D in the upper diagram correspond to probable water-supplying faults preserved into the saprolite.
Paleoseismological analyses were performed from field observations, descriptions, and regular photographic surveys of coastal sections made from the 1980s onward, but mostly prior to 1997, the recent access of the sections being restricted because of their location in the Crozon Natural Park (dating on the pictures). With the present-day rising sea level, coastal environments are either refreshed or degraded, and several successive surveys allow us to constrain the observed deformed structures in three dimensions. For the Trez Rouz site, first palynological analyses were performed in 1974 by M.T. Morzadec-Kerfourn (Mullenders extraction methodology). A second analysis was made by V. Andrieu-Ponel at the Marseille laboratory using a treatment with a heavy liquid (d=2) in complement to the sampling for seeds and plant remains (Field et al., Reference Field, Velichkevich, Andrieu-Ponel and Woltz2000). All these data are summarized in Figure 4.

Figure 4 (color online) Relative chronology for the study sites, with the stratigraphic position of the coseismic and periglacial deformations. Ages between brackets are estimated. The stratigraphy for the Gurp section follows O’Brien and Jones (Reference O’Brien and Jones2003) and Sitzia et al (Reference Sitzia, Bertran, Bahain, Bateman, Hernandez, Garon and de Lafontaine2015). Those of Pénestin are extracted from Van Vliet-Lanoë et al. (Reference Van Vliet-Lanoë, Bonnet, Hallegouët and Laurent1997) and Van Vliet-Lanoë et al. (Reference Van Vliet-Lanoë, Hibsch, Csontos, Jegouzo, Hallégouët, Laurent, Maygari, Mercier and Voinchet2009). ESR, electron spin resonance; IRSL, infrared-stimulated luminescence; MIS, Marine Oxygen Isotope Stage; NGF, French Ordnance Survey (5 m NGF corresponding to above sea level); SASZ, South Amorican Shear Zone.
Dating of the Quaternary units was previously performed by electron spin resonance (ESR) methods on the Trez Rouz, Pen Hat, and Penestin sections (M. Laurent, in Van Vliet-Lanoë et al., Reference Van Vliet-Lanoë, Bonnet, Hallegouët and Laurent1997, Reference Van Vliet-Lanoë, Hibsch, Csontos, Jegouzo, Hallégouët, Laurent, Maygari, Mercier and Voinchet2009). New infrared-stimulated luminescence (IRSL) ages on Marine Oxygen Isotope Stage (MIS) 6 deposits were performed on the Pen Hat section (Table 2). Sand-sized K-feldspar minerals were prepared using the standard procedure including dry sieving, treatments with HCl and H2O2, and density separation (d<2.58). The prepared K-feldspar samples with 150–200 μm grain size were mounted on stainless steel discs using silicone oil. Each aliquot contained 10–20 grains. All luminescence measurements were conducted with a Riso TL/OSL (Thermo-Luminescence/Optically-Stimulated Luminescence) DA-20 reader, and the luminescence signal was detected through a combination of blue filters (7-59 and BG-39) with a neutral density filter (ND10). The dose rates were calculated by radioactivity measurements of the samples using high-resolution gamma spectrometry. The equivalent dose (D e ) of the samples were measured using elevated temperature post-IR IRSL (pIRIR), stimulated at 290°C after preheating at 320°C for 60 s and with the first IR stimulation at 200°C. By increasing the first stimulation temperature from the standard 50°C (Thiel et al., Reference Thiel, Buylaert, Murray, Terhorst, Hofer, Tsukamoto and Frechen2011) to 200°C, the signal can be considered to be free from anomalous fading (e.g., Ito et al., Reference Ito, Tamura and Tsukamoto2017). Ten aliquots each were measured for samples PHD1–6, and six aliquots were measured for GWD1–2 and TRG1–2. Mean D e values with 1σ standard uncertainty were used to determine the ages of the samples, except for GWD1–2, whose D e values are in saturation. For these two samples, the minimum ages were calculated using 2 times characteristic saturation dose (D 0) obtained from the dose response curve. To test the validity of the applied pIRIR protocol, a dose recovery test was performed. Six aliquots each for PHD1–6 were bleached for 4 hours in a solar simulator (Hönle SOL2). Three aliquots per sample were given a laboratory beta dose of 250 Gy, and we tested if this laboratory dose could be accurately determined. The residual dose originated from the remaining pIRIR signal after the 4 hour bleaching was subtracted from the recovered dose. The dose recovery ratio has a tendency to overestimation of the given dose; however, they are all consistent with the acceptable range (0.9–1.1 Gy) within 2σ uncertainty.
Table 2 Infrared-stimulated luminescence data and results for the Pen Hat section. “NGF” indicates French Ordnance Survey (5 m NGF corresponding to above sea level). “Lum Nr” indicates Luminescence Number.

GEOLOGIC SETTING
The Bay of Brest forms the boundary between two Variscan domains of the Armorican massif, the Leon domain to the north, and the central Armorican domain to the south (Fig. 1A; Ballèvre et al., Reference Ballèvre, Bosse, Ducassou and Pitra2009). Crozon Peninsula is located to the south of the Bay of Brest and is affected by a low-grade brittle deformation with folding and faulting, along several main tectonic structures, mostly inherited from the Devonian Variscan orogeny and reactivated during the Eocene Pyrenean orogeny, the Oligocene rifting phase, and lately the Miocene-Alpine orogeny (Ziegler and Dézes, Reference Ziegler and Dèzes2006; Anell et al., Reference Anell, Thybo and Artemieva2009). The later tectonic phase mostly occurred from the Langhian-Serravalian to the late Messinian under a 150° trending shortening axis (Bergerat, Reference Bergerat1987) and produced vertical motions of west–east elongated blocks (Le Roy et al., Reference Le Roy, Gracia-Garay, Guennoc, Bourillet, Reynaud, Thinon, Kervevan, Paquet, Menier and Bulois2011). Further vertical motion of the Crozon Peninsula did not occur during the Plio-Quaternary, as proved by an Upper Miocene low-stand platform preserved in several places close to the present-day sea level, at Porz Kubu (Fig. 1B) Le Rhys, close to Douarnenez (Van Vliet-Lanoë et al., Reference Van Vliet-Lanoë, Vandenberghe, Laignel, Laurent, Lauriat-Rage, Louwye and Mansy2002), and at Pénestin (Vilaine River estuary; Van Vliet-Lanoë et al., Reference Van Vliet-Lanoë, Hibsch, Csontos, Jegouzo, Hallégouët, Laurent, Maygari, Mercier and Voinchet2009) (Fig. 2).
The morphology of the Crozon Peninsula mainly results from Late Hercynian pedimentation (Triassic, ~250 Ma), further reshaped by successive marine transgressions, from the Early Jurassic (203 Ma) to Late Cretaceous (~65 Ma; e.g., Bessin et al., Reference Bessin, Guillocheau, Robin, Schroëtter and Bauer2015). The intense weathering of emerged Brittany, which occurred during most of the Cretaceous and Paleogene, provided up to 30 m of argillaceous saprolite (Wyns, Reference Wyns1991) preserved in basement compartments downwarped by Cenozoic inversion tectonics.
The study zone is located north of the main active structure of the region, the South Amorican Shear Zone (SASZ; Fig. 1B). The two main brittle faults around the Crozon Peninsula are the right-lateral 145° trending Kerforne and the left-lateral 045–070° trending Elorn Fault Systems that branch eastward to the North Armorican Shear Zone (Plusquellec et al., Reference Plusquellec, Rolet, Darboux, Bosold, Chantraine, Chauris and Chauvel1999; Darboux et al., Reference Darboux, Marcoux, Hallégouët, Lebret, Thomas, Margerel, Blanchet and Carn2010; Le Gall et al., Reference Le Gall, Authemayou, Ehrhold, Paquette, Bussien, Chazot, Aouizerat and Pastol2014; Figs. 1 and 2). The morphology of the Bay of Brest outlet (also called the Goulet) is largely controlled by these faults.
The opening of the Bay of Brest occurred after the lower Oligocene (lower Rupelian; Hallégouët et al., Reference Hallégouët, Ollivier-Pierre and Esteoule-Choux1976). The collapse of regional deep weathered blocks of basement, well marked in the topography and visible in the digital elevation model (Fig. 1B and C) allowed for the further excavation of the Goulet during the Neogene and Quaternary transgressive-regressive repetitive marine stages, especially by tidal scouring at the entrance of the bay. The Goulet embayment flooded at least after the Middle Miocene as coastal Langhian faluns have been discovered on the peri-Armorican shelf off Ouessant Island and the Penmarch Peninsula (Andreieff et al., Reference Andreieff, Bouysse, Horn and Monciardini1972), to the west of the Bay of Brest (Fig. 2). The oldest deposits in the Elorn estuary are Lower Pliocene (lower Zanclean, Za1, ~4.8 Ma) and suggest a limited opening of the bay (tidal clays) during this period. A landward transgression followed and allowed the deposition of a stratigraphic sequence constituted by poorly preserved Piacenzian units, Gelasian units dated at 2.4±0.3 Ma by ESR methods, and finally the Tiglian muds (Van Vliet-Lanoë et al., Reference Van Vliet-Lanoë, Vandenberghe, Laignel, Laurent, Lauriat-Rage, Louwye and Mansy2002; Darboux et al., Reference Darboux, Marcoux, Hallégouët, Lebret, Thomas, Margerel, Blanchet and Carn2010). From the Gelasian onward, the sea level globally lowered. South of the Bay of Brest, the graben of Trez Rouz was flooded during most of the Pliocene (Chauris et al., Reference Chauris, Plusquellec, Hallegouët, Darboux, Melou, Chauvel, Le Corre, Babin, Morzadec and Thonon1980; Fig. 1B).
SEISMIC SETTING
Currently, a number of Variscan structures are seismically active faults that could be assigned to the far stress field produced by the Africa-Eurasia convergence and the mid-Atlantic ridge push, with a northwest–southeast compressional stress and a northeast–southwest extensional stress deduced from numerical modeling analyses (Golke and Coblentz, Reference Golke and Coblentz1996), and GPS and seismological studies (Mazabraud et al., Reference Mazabraud, Béthoux, Guilbert and Bellier2005; Perrot at al., 2005; Nocquet, Reference Nocquet2012). The stress field is mainly strike slip with an extensional component attributed either to the buoyancy forces arising since the last deglaciation and explaining the general apparent uplift in Brittany (Bonnet et al., Reference Bonnet, Guillocheau, Brun and Van Den Driessche2000) or to local variations in rheology favoring stress perturbation (Mazabraud et al., Reference Mazabraud, Bethoux and Delouis2013).
The seismicity around the Bay of Brest is significant, with several earthquakes (Arroucau, Reference Arroucau2006; Haugmard, Reference Haugmard2017) with low magnitudes between 1.6 ≤ M w ≤ 3.2 and within a range of depth from 2 to 25 km, following the SI-Hex catalog from 1965 to 2009 (Cara et al., Reference Cara, Cansi, Schlupp, Arroucau, Béthoux, Beucler and Bruno2015). However, the seismicity in the western part of France shows an occurrence of moderate earthquakes with M w ≥ 4, such as the Hennebont earthquake in 2002, M w 4.3, along the SASZ (Perrot et al., Reference Perrot, Arroucau, Guilbert, Déverchère, Mazabraud, Rolet, Mocquet, Mousseau and Matias2005). During the instrumental period (since 1965), only one stronger earthquake occurred, with M w 5.0, close to La Rochelle (Cara et al., Reference Cara, Cansi, Schlupp, Arroucau, Béthoux, Beucler and Bruno2015) in 1972.
The historical seismicity presents a similar pattern along the Atlantic margin of France, with 61 events of 4>M w >5, and 7 with M w ≥5 between 1286 and 1959 (FCAT-17 catalog; Manchuel et al., Reference Manchuel, Traversa, Baumont, Cara, Nayman and Durouchoux2018; SISFRANCE www.sisfrance.net). Four of them are located in the Vendée and La Rochelle area including one of the biggest historical events, the M w 6.3 Bouin earthquake that occurred in the Marais Breton in 1799 (Manchuel et al., Reference Manchuel, Traversa, Baumont, Cara, Nayman and Durouchoux2018). Two other events occurred close to Meucon (in 1286 and 1930), and one M w 5.4 event occurred near Quimper in 1959 probably along the SASZ (Manchuel et al., Reference Manchuel, Traversa, Baumont, Cara, Nayman and Durouchoux2018). Our study sites are located 55 km from Quimper, 105–115 km from Hennebont, and at a minimum distance of 25–40 km from the SASZ.
DATA
Trez Rouz
The key section, Trez Rouz, is located on the Roscanvel peninsula of Crozon (Figs. 1B and 5) at the entrance of a southwest–northeast trending shallow depression linking the Bay of Brest to the Atlantic Ocean. The formations that outcrop along the coast (48°18.31′N; 4°34.28′W) are located at the western termination of a 060° trending graben, which is bound by satellite faults of the 060° trending Elorn Fault system. The site is also under the influence of several branches of the 150–160° trending Kerforne Fault System (Fig. 1B). Indeed, northwest–southeast trending faulting has been observed into Paleozoic shale that mostly crop out at the southern end of the beach. This graben preserves 20–25 m of saprolite and supposed Pliocene sandy gravel deposits (Chauris et al., Reference Chauris, Plusquellec, Hallegouët, Darboux, Melou, Chauvel, Le Corre, Babin, Morzadec and Thonon1980). The overall geometry of the graben infill seems rather similar to the observation extracted from a Seismic Sparker profile located east of the site. This profile shows the structures extending the graben onshore to the east in the Roscanvel Bay, partly affected by a flooded river incision, with possible Pliocene relic sedimentary bodies (Fig. 3).

Figure 5 Trez Rouz sites. (1) Location of the Trez Rouz section (in red) on the high-resolution digital elevation model. (2) Log of the section and detail of the section structures A, B, C, D, and E. Black arrow: rivulet. Note the shortening deformation figures of the units TRZ9 and TRZ7. The red square corresponds to the section investigated for plant macrofossil assemblage and palynology. (For interpretation of the references to color in this figure legend, the reader is referred to the web version of this article.)
The northwest side of the Trez Rouz graben (Figs. 3 and 5) is shaped by at least two erosional surfaces. The highest one is perched at about 15 m NGF, to the north, and affects the faulted and weathered sandstones constituting the Pointe du Pouldu, located in the graben (Fig. 3). Following the clay mineralogy of the sediments (Melou, Reference Melou1968), the Pointe du Pouldu corresponds to the feeding zone of most of the periglacial slope deposits in the main section. These deposits are rich in kaolinite and sandstone clasts (TRZ9). The southern part of the graben is occupied by ~2 m of Quaternary sediments lying on a much more shallow basement (5 m close to the rivulet, black arrow in Fig. 5A, emerging at ~50 m to the south of the river). The second erosional surface corresponds to a flat surface that truncates the shale and can be interpreted as a raised platform at 7 m NGF, related to the last raised beach (possibly Eemian, MIS 5; Fig. 5E).
Stratigraphic record (Figs. Reference Bahain, Falguères, Laurent, Voinchet, Dolo, Antoine and Tuffreau4 and 5-2)
Periglacial deposits are commonly labeled “heads” in western France and the United Kingdom. Their description has been completed from Van Vliet-Lanoë et al. (Reference Van Vliet-Lanoë, Bonnet, Hallegouët and Laurent1997) for the TRZ1 to TRZ3 deposits (Fig. 5). New observations have shown a succession of four main upward dissymmetric injections or folds (A-B-C-D; Fig. 5), from north to south. The units are described subsequently.
TRZ1: Tidal mud, stratified and faulted. Only visible in the southernmost major injections (D) (Fig. 5D).
TRZ2: Lower peat complex. It consists of two levels of black peat separated by a gyttja layer and includes large fragmented wood remains.
TRZ3: Beige clayey loam, including angular clasts of quartz and unweathered shale. This unit is derived from the local saprolite (Melou, Reference Melou1968) and is faulted by 060–070° trending fractures spaced about 70 cm apart, with vertically injected clasts of quartz and shales concentrated in structure B (Fig. 5B).
TRZ4–6: Main peat complex (Fig. 5-2). Above this unit, most of the deposits are derived from the weathered Landevennec sandstone to the north (Melou, Reference Melou1968). It is the sequence studied by Morzadec-Kerfourn (Reference Morzadec-Kerfourn1974) and Field et al. (Reference Field, Velichkevich, Andrieu-Ponel and Woltz2000).
TRZ4a: Bleached clayey loam, faintly stratified, laterally linked to an organic gyttja type accumulation, truncated by a stone line, and faulted by 060–070° trending fractures spaced about 70 cm apart (Fig. 5E).
TRZ4b: Dark gray organic loamy clay.
TRZ5a: Peat, homogenous, dark brown, evolving in a water-laid accumulation of wood and bark fragments (Pinophyta, Alnus, Betula, shrubs, ferns), often in a vertical position (injection).
TRZ5b: Humic sand—sandy schorre soil evolving laterally into a tidal channel.
TRZ6a: Peaty loam, rich in wood fragments and seeds (Potamogeton), richer in intraclasts to the top; partly fragmented to the top.
TRZ6b: Stratified alternation of silty sand and gravels, supported by a silty matrix, corresponding to a tidal channel to the south of the main structure B (Fig. 5B). It partly overlaps structure B and is slumped.
TRZ6c: Humic bleached loam reworking sand and quartz gravel and onlapping TRZ6a and TRZ6b. To the south, a thick peat complex is preserved at its base.
TRZ7–8: Lower head complex sloping to the north. TRZ7 consists of a series of two heads, including several weakly developed hydromorphic paleosoils, and ends with very coarse clasts of shale and quartz. At the top of structure B, the upper layer presents gravels in stacking (slump) with fragmented organic remains, resulting in the bulging of structure B. On the southern side of the main deformation, between the two most important injections, the TRZ7 layer is overthickened and almost horizontal at its base; it consists of a 1-m-thick deformed aggradation of sandy to gravely series including more loamy layers, somewhat organic, with rare wood fragments. It seems to correspond to a dell infilling. TRZ8 consists of a humic loam, interstratified sandy loamy heads deformed by periglacial ploughing blocks (Fig. 6B), with some coarse clean sand at the base, and it corresponds to a gyttja. A thick gley complex buried this layer.

Figure 6 (color online) (A) Lateral injection in structure D, deforming unit TRZ2 (observation 2017). (B) Ploughing (soliflucted) block involutions between structures B and C, unit TRZ10; deforming TRZ8 organic soil (2004).
TRZ9–10: This is a second sequence of heads, partly reworking dune sand and humic material, buried under bleached heads, including large clasts. TRZ10, a clayey loamy head, is rubified by pseudo-gley paleosol on reworked saprolite.
TRZ11–13: Upper sequence of yellowish heads, mostly loamy. It includes a brown podzolic paleosol at its base that evolves to the south of the rivulet into a raised cobble beach (TRZ12) including stony patterned ground to the north. These heads truncate the whole sequence with a slope toward the south.
Paleoenvironmental reconstruction of the main peat complex at Trez Rouz
The presence of Azolla filiculoides (Morzadec-Kerfourn, Reference Morzadec-Kerfourn1974) indicates a pre-Eemian age for the main peat complex (TRZ4–6). Peat layers are formed under mild temperate oceanic conditions with thermophilous aquatic plants, indicating deposition during interglacial periods. The absence of Tertiary pollen discounts an early Pleistocene age (last occurrence or last appearance datum/LADs) and is thus middle Pleistocene. This peat was first attributed by palynological studies to the Holsteinian (MIS 11; Morzadec-Kerfourn, Reference Morzadec-Kerfourn1974, Reference Morzadec-Kerfourn1999; Van Vliet-Lanoë et al., Reference Van Vliet-Lanoë, Bonnet, Hallegouët and Laurent1997; Field et al., Reference Field, Velichkevich, Andrieu-Ponel and Woltz2000). The sandy layer, TRZ5b, intercalated within the peat complex has been dated to 470±53 ka by ESR methods (MIS 13; Van Vliet-Lanoë et al., Reference Van Vliet-Lanoë, Laurent, Bahain, Balescu, Falguères, Field, Hallégouët and Keen2000). Several interglacial stages that had slightly higher sea levels than today (MIS 9, MIS 11, MIS 13, and MIS 15; Rohling et al., Reference Rohling, Grant, Bolshaw, Roberts, Siddall, Hemleben and Kucera2009) have similar palynological characteristics (Scourse et al., Reference Scourse, Haapaniemi and Colmenero-Hidalgo2009). The plant macrofossil assemblage does not contain any biostratigraphic markers that allow for a specific interglacial stage determination.
TRZ4–5a corresponds to a marshy area partly submerged under a slightly brackish, shallow water body with both woodland (Quercus, Corylus, Fraxinus, Ilex aquifolium), waterside, and damp ground habitats (Alnus glutinosa, Osmunda regalis in TRZ5a) present on the surrounding slopes. After this humiferous clayey sand deposition, poor in plant macrofossils, the dated TRZ5b clayey sands were deposited within the marsh, probably associated with a slight cooling and storminess. This may be related to the opening of a coastal ridge or most likely to the colluvial infill by dune sand mixed with clayey slopewash, isolating the depression.
TRZ6a peat corresponds to a renewed shallow brackish lagoon with Caulinia goretskyi, Potamogeton occidentalis, and Ruppia maritima, possibly tracing another high stand in a forested landscape. The absence of both reed swamp and damp woodland in the site suggests a narrow depression with some spring seepage, with most of the local saprolite being eroded. The presence of Vitis and Buxus in TRZ6a suggests rather mild conditions, initially warmer than TRZ4–5, followed by the onset of limited climate cooling. These conditions can be correlated with the Cromerian Interglacial IV recorded as MIS 13 in the Netherlands (Zagwijn, Reference Zagwijn1996). As the ESR dating gives a maximum age of 523 ka, the whole main complex might fit either with MIS 13a or MIS13c. It is thus covering the thermal spike of MIS 13a (~490 ka; Railsback et al., Reference Railsback, Gibbard, Head, Voarintsoa and Toucanne2015). The entire main peat complex (TRZ4–5a) should have formed during MIS 13a to the eustatic maximum MIS 13c. More precisely, TRZ4–5a might fit the MIS 13c (~525 ka) because palynological content indicates in this unit an ongoing transgression (Fig. 4).
TRZ6c could correspond to the classic Holsteinian (MIS 11; Koutsodendris et al., Reference Koutsodendris, Müller, Pross, Brauer, Kotthoff and Lotter2010), which is longer and warmer than MIS 13. The unit is associated with TRZ6b, which represents a shallow tidal channel, probably initially 25 m wide, with a lateral peaty salt marsh (Fig. 7, phase I). Units TRZ1 and TRZ2 should correspond to interglacial high stands older than MIS 13, probably the complex MIS 15, with THREE high stands (MIS 15e, 15c, and 15a; Cromerian Interglacial III: Railsback et al., Reference Railsback, Gibbard, Head, Voarintsoa and Toucanne2015). They represent the closing of a tidal channel and two episodes of brackish peat formation (TRZ2) separated by a gyttja.

Figure 7 Reconstitution of different phases of deformation of the Trez Rouz section. Red stars stand for injection. MIS–Marine Oxygen Isotope Stage; NGF–French Ordnance Survey (5 m NGF corresponding to above sea level). (For interpretation of the references to color in this figure legend, the reader is referred to the web version of this article.)
The last humic layer, TRZ10, consists of lacustrine organic sediment deposited near the shore. TRZ10 was considered as an upper interglacial stage by Morzadec-Kerfourn (Reference Morzadec-Kerfourn1974) presenting “cold-temperate” vegetation (Corylus, despite presence of Ilex) in the lower part and a late temperate period in the upper part. The unit could correspond to part of the MIS 7, as TRZ12 is clearly connected to the south with the last raised beach (MIS 5). The presence of a thin loess cover at the top of TRZ13 heads (Fig. 5E), with periglacial patterned ground, suggests that the whole sequence is older than Eemian (MIS 5). Below, the pseudo-gley soil (TRZ10) is rubified, partly inherited from the Landevennec sandstone, which is related to some seasonal hydromorphism, consistent with the morphology. This unit may have form during MIS 7 or earlier.
The remaining organic soil, the base of TRZ8, should, by deduction, correspond to a MIS 9 paleosol stretched by solifluction. Unit TRZ9 is deposited by periglacial solifluction and colluviation, which implies available moisture and seasonal frost. The conditions favorable to these processes normally occurred during early glacial conditions, when the sea level was not too low and the climate was still oceanic (with the presence of snow). This unit could be correlated with MIS 8c. The injection of structure A occurred early during this substage, because jarosite, a sulfate complex inherited from the bacterial degradation of pyrite issued from brackish or marine waters, is present in the structure.
Structures and deformation
Four main structures are considered here, from north to south A-B-C-D, forming upward dissymmetric hydroplastic injections, oriented 060° (Figs. 5, 6A, and 8).
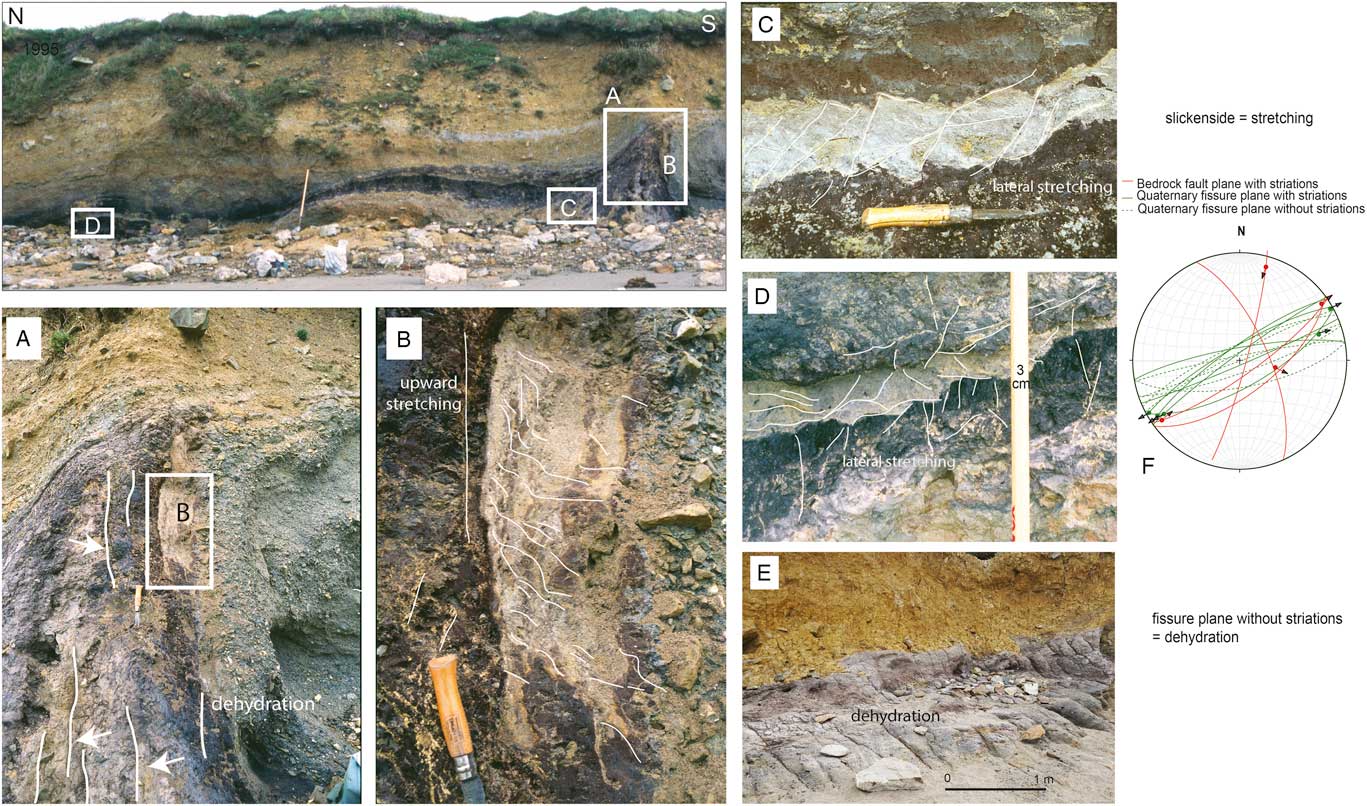
Figure 8 Details of sites 8-1 and 8-2. Structure B details (Fig. 5). (A and B) Site 8-1 showing main injection, liquefaction (red stars in Fig. 7) retimed by stretching fissuring (slickensides in white), C-D to the north and B to the south; notice dehydration fissures below the injection in A. Site 8-2 showing stretching (stretching fissure) (C) and fissuration (retraction) (D) related to the dehydration of the liquefied saprolite. (E) Simple fissuring by dehydration, north of structure C. Notice the antithetical character of the stretching fissures on each side of the injection: C–D to the north and B to the south. The diagram plots the orientation of the basement faults and the two types of fissuration in the sediment. (F) Fault planes and associated slickenside (black arrows). (For interpretation of the references to color in this figure legend, the reader is referred to the web version of this article.)
The northernmost structure A is the largest (5 m wide). This structure vertically deforms the unit TRZ8 and is present exclusively in saprolites. The B, C, and D structures are thin (<2 m wide). They are mostly tilted to the southwest, in conformity with the present-day slope. They rework several generations of peats (MIS 11: TRZ6; MIS 13: TRZ5; MIS 15: TRZ2). Deformation B is the most spectacular and affects the dated sandy layer (TRZ5b). Structure C reworks the two oldest peats and is cored by a third peat. Structure D only reworks the two older peat units (TRZ2) and is injected by stratified clays (Fig. 5D, TRZ1). Some small sandy liquefaction features occurred within fold B in association with the brecciation of the lower part (TRZ5a; Figs. 7B [red star] and 8-1). Similar brecciation deformed the upper part of the injected peat structure C. In TRZ4, quartz vein clasts are vertically oriented but in a steplike stacked succession as in an injection (Fig. 5A). Fragments of roots are mostly still in connected positions in the TRZ6a peat. None of the ligneous remains are intact in the TRZ5a and TRZ2 peats, and most of them are fractured wood and bark fragments and dispersed throughout the entire sediment. These suggest flotation and liquefaction. Many wood fragments were reworked with oriented clasts in unit TRZ6c, attesting to mudflow and erosion of the main peat injection. One of the deformation features occurred in the upper part of TRZ6c when the water table level was still high (floated fragments). Some larger deformations clearly suggest fold shortening between injection folds B and C (Fig. 5, unit TRZ7) and to the south of structure A.
A set of fissures, mostly parallel and vertical, affects most of the upward injected features (structures A, B, C, and D; Figs. 5 and 8-2). The fissures trend 060° parallel to the length of the graben and to the direction of major faults in the Paleozoic basement that crops out on the northern side of the graben (Figs. 5–2 and 8–2 [diagram]). Horizontal microstructures that look like slickensides are present on some fissure planes. They are similar to slickensides on basement faults that trend 060° (Fig. 3). Such slickensides are common in clayey soils after desiccation (Irfan, Reference Irfan1996), but here they are likely oriented following the local stress field. This deformation is contemporaneous with a general consolidation of the fissured units. At a smaller scale, the injected masses in fold B are affected at the same time by antithetic microfracturation, dipping at 90° in the TRZ4 organic layer, with scalelike normal successive collapses and in a form of 20° dipping microshear planes in the stretched loamy sand (TRZ5b; Fig. 8-2, C and D). These deformation structures do not affect unit TRZ6a. They seem related to substratum retraction, fissuring, and consolidation by drainage and desiccation. These microfaults in the peat are underlined by jarosite.
Structure D is located at the crossing of two injections trending 150° and 060° with lateral injection blisters (Fig. 6A). These two directions correspond to those of the Kerforne Fault System and the Elorn Fault System, respectively. These two fault systems join at the Trez Rouz site (Fig. 1B). Periglacial deformations end the record of each set of units including frost creep bending and ploughing blocks (Fig. 6B).
Sequence of deformation events
Retro-deformation analysis allowed us to restore stratigraphic units to their original geometries and to recognize several seismic events (Fig. 7, phase I). From MIS 15 to MIS12, a succession of fluvial and coastal units (TRZ1 to TRZ7) incised the thick saprolite preserved in the graben (phase I, Fig. 7). The first main deformation occurred from the end of TRZ6c deposition, probably at the time of the transition between MIS 11 and the onset of the MIS 10 cooling event, ca. 380 ka (phase II, Fig. 7). This deformation is associated with the formation of the B, C, and D structures, further bent by solifluction. After that, periglacial slope deposits partly filled the depression between the uplifted zone and the northern border fault (phase III, Fig. 7). The next seismic event is attributed to structure A, which is younger than most of the TRZ9 unit (phase IV, Fig. 7). This event produces only local retraction fissures, the other structures being (TRZ1 to TRZ6) now consolidated. An early MIS 8c age could be attributed to the event that deformed the TRZ9 unit. The deformation is possible because of the presence of marine water that impregnated the saprolite (jarosite), indicating that the sea level was still high despite the periglacial colluvial nature of TRZ9. This may also be the result of a persisting high sea level or saturation by seismic pumping from a shallow marine water wedge (Figs. 3 and 7). In addition, periglacial solifluction was still active, regulating the northern side of the graben in two steps separated by paleosols (phases V and VI).
Pen Hat section
The Pen Hat section is located (48°16.6′N; 4°37.17′W) between the Toulinguet and Pen Hir Points (Figs. 4 and 9A). The two ridges are armored by Armorican sandstones, raised by a northeast–southwest trending faulted anticline leading to the outcrop of Brioverian quartz-rich shales. Pen Hat anticline is separated from the Trez Rouz graben by the Kerforne Fault System (Fig. 1B). The Pen Hat section is located along a fossil cliff incised in the faulted quartz-rich shale at the contact with the sandstones (Fig. 9A). The bedrock was abraded by marine erosion and is partly buried by two series of Pleistocene deposits. A Holocene dune and a beach cobble ridge occupy the northern part of the bay. This section was completely independent of the Bay of Brest fluvial system during low stands (Hallégouët, Reference Hallégouët1994).

Figure 9 Pen Hat study site. (A and A’) Location and global section. The deformation structures are located at the red star. (B) Water escape structures with fracturing related to its propagation (in unit PH5). (C) Load cast level affecting paleosol PH4. (D) Horizontal section in the largest water escape showing tube propagation to the southeast (in unit PH4). (For interpretation of the references to color in this figure legend, the reader is referred to the web version of this article.)
Stratigraphy (Fig. 4)
The most complete section is visible in the northeastern part of the Pen Hat bay, at the foot of Toulinguet Point, with an approximately 20-m-thick layer of Pleistocene sediment. The upper levels crop out along the lower to central portion of the bay. The lower contact is highly weathered and is thus the source of dark-gray clayey saprolite from the quartz-rich shales. The base of the Pen Hat section (unit PH4) yielded an ESR age of 403±70 ka or MIS 11 (Van Vliet-Lanoë et al., Reference Van Vliet-Lanoë, Laurent, Bahain, Balescu, Falguères, Field, Hallégouët and Keen2000).
The following units may be distinguished (Fig. 4):
PH1: Marine cobbles and gravels in a silty (kaolinitic crystalline silt) sandy matrix, resting on a platform cut into quartz-rich shale, ~ 5 m NGF.
PH2: Mixed marine pebbles and clasts in a loamy matrix. This unit corresponds to a shore deposit with shore ice rafting characteristics.
PH3: Marine sands with some gravels. A lower paleolithic industry is included, close to the foot of the paleocliff.
PH4: Hydromorphic “podzolic” sandy clayish paleosol, buried by gray clayey sands with some sandstone and shales flakes. This sand yields an ESR age of 403±70 ka BP (Van Vliet-Lanoë et al., Reference Van Vliet-Lanoë, Laurent, Bahain, Balescu, Falguères, Field, Hallégouët and Keen2000). This unit is interpreted as an oxidized organic gley in a salt marsh depression located between two beach ridges.
PH5: Level of brownish sand deformed by load casts, consolidated.
Units PH4 and PH5 are locally pierced by hollows or pipes filled by marine sands with local concentrations of heavy minerals, with tubular stratified “marine” sand bodies infilling the hollow in PH4 (Fig. 9C). Pressure fracturing is marked at the base of the hollows. Some partly reworked archaeological artifacts are preserved (Fig. 4).
PH6: Dark-gray stratified clayish mud including lateral heads, thinning to the south, strongly consolidated.
PH7a: Stratified sand body interlayered with gray silty clay; it forms a storm built tidal bar, invading a low marsh (washover fan) and evolving into beach on the top, at the contact of the 7 m platform (southern part of the section). Behind this ridge, a lagoon facies with developed tidal clayey layers and with some admixture of clasts toward the top is present. The ESR dating (Van Vliet-Lanoë et al., Reference Van Vliet-Lanoë, Laurent, Bahain, Balescu, Falguères, Field, Hallégouët and Keen2000) and the IRSL dating failed because there was too little initial bleaching of the clayey sandstone saprolite, with aberrant age between 126 and 143 ka. However, the basal stratified marine sands from the similar and nearby Trégana section (washover fan; 6 km to the north, on granite; see Figs. 1B and 4) provided IRSL ages of 254±18 and 271±20 ka (early MIS 7; see Table 2).
PH7b: Eolian sand including gravels and clasts in upper horizons, dropped from the overhanging cliff. The IRSL dating yields an age of 161±12 ka.
PH8a: Eolian sand, slightly humic and some frost wedges in the southern part of the section. The IRSL dating yields an age of 138±10 ka.
PH 8b: Humic podzolic soil developed in eolian sand.
PH9: Eolian sand including some dropped clasts from the cliff.
PH10 to PH19 corresponds to the upper Pleistocene heads following the Eemian (MIS 5e) paleosol. PH11 yields an IRSL age of 105±7 ka. They are connected with a cryoturbated beach in the central part of the bay. The Holocene dune sand, PH19, includes Pomatia elegans dated at 5220±320 cal yr BP at its base.
Interpretation
The stratigraphic interpretation and correlations with the Trez Rouz units are given in Figures 4 and 10. We argue for seismic deformation produced the load casts in unit PH5 (Fig. 8C) and the erratic hollows filled by tubular bodies, themselves filled by stratified marine sands, with local concentrations of heavy minerals in PH4. These structures represent a water escape, under pressure and confined upward by the overconsolidated stratified clay of unit PH6 (Fig. 9A, B, and D). The existence of overconsolidation of the lower units at Pen Hat, of a level of load casts in unit PH5, and of younger oriented water escape features in unit PH4–5, confined in space by unit PH6, argue for a series of earthquakes. PH4 yielded an ESR age of 403±70 ka, suggesting the largest liquefaction events are younger, but older than PH7, a MIS 7a tidal complex (Fig. 4). The load cast event (PH5) is thus slightly younger than 403±70 ka.
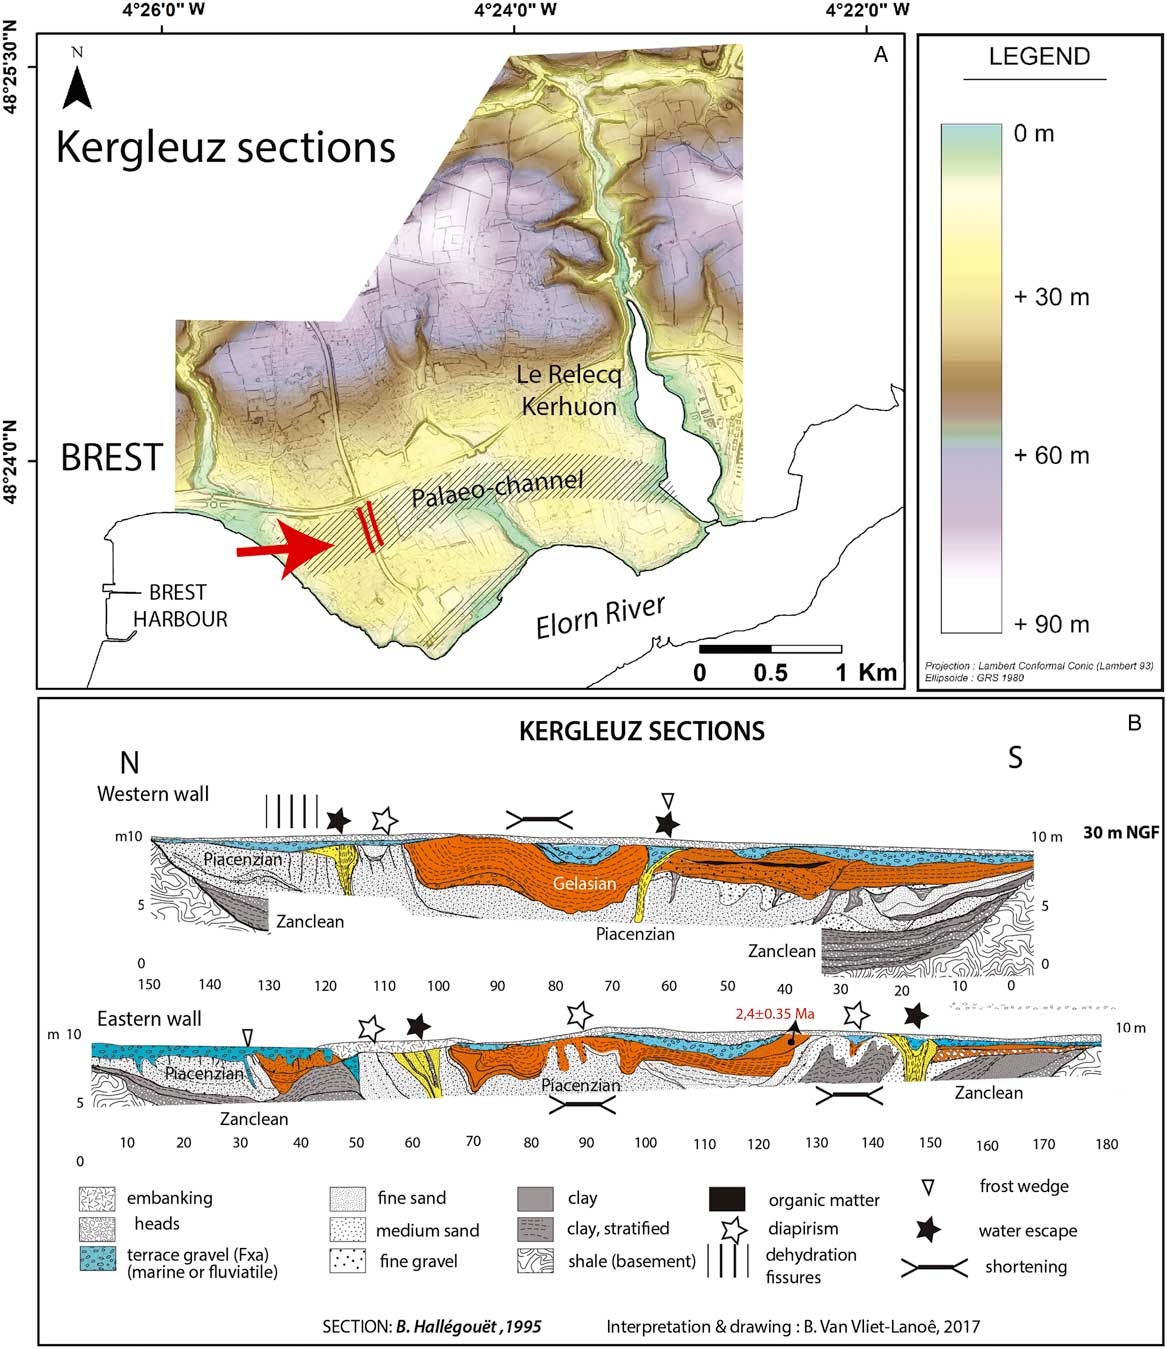
Figure 10 Deformation at Kergleuz during the 1995 excavation of the highway across a paleochannel. (A) Location of the section on a digital elevation model: sections in red. (B) Sections. In yellow: main water-escape features. Blue: ca. 430 ka Fxa gravel terrace. Orange: Gelasian (~2.4 Ma). Please note the different vertical and horizontal scales. (For interpretation of the references to color in this figure legend, the reader is referred to the web version of this article.)
Kergleuz section
The Kergleuz section is located at the outlet of the Elorn valley, on an abrasion terrace on the right bank of the Elorn estuary (48°23.62′N; 4°24.29′W; Fig. 1B), at an elevation of 30 m NGF. The Elorn Fault System morphologically controls this part of the valley. Most of the sediments are clays and are preserved in a 12-m-deep, 150-m-wide incision cut within quartz-rich shale. The fluvial infilling (Fig. 3) mostly consists of Zanclean and early Quaternary deposits (Darboux et al., Reference Darboux, Marcoux, Hallégouët, Lebret, Thomas, Margerel, Blanchet and Carn2010).
Description
A complex deformation system is evident from the stratigraphy proposed by Hallégouët (Reference Hallégouët1994). Deformations mostly affect the Piacenzian and Gelasian sands (ESR dating to 2.4±0.35 Ma) and terrace gravel that rest on Zanclean clayey infratidal sediments (Darboux et al., Reference Darboux, Marcoux, Hallégouët, Lebret, Thomas, Margerel, Blanchet and Carn2010). These deformation structures are truncated by the periglacial slope deposits resting on the lower unit of the Middle Terrace group (unit Fxa of the French geologic map; Darboux et al., Reference Darboux, Marcoux, Hallégouët, Lebret, Thomas, Margerel, Blanchet and Carn2010), deformed like the Gelasian unit in the western wall of the Kergleuz section (Fig. 10).
Clay layers are folded mostly synclinally, before being truncated by the 30 m asl thin alluvial terrace Fxa. Fold limbs are limited by upward vertically injected sand masses and by three to four vertical large mud escapes of about 5 m wide (in yellow in Fig. 10B). These sand-escape diapirs are similar in shape and size to those of the clayish structure A at Trez Rouz. Shortening structures, dehydration fissures, and clay layer brecciation provide evidence for liquefaction and possible load casts (Fig. 10). The periglacial head cover is not deformed. Frost wedges are often superimposed on diapirs. The basal Zanclean tidal clays are only subject to wavy deformation. Frost wedges (Fig. 10B), probably sand wedges, postdate most of the deformations.
Interpretation
The setting up of the Fxa Terrace basal surface likely occurred in the late Miocene (western and northern France; Van Vliet-Lanoë et al., Reference Van Vliet-Lanoë, Vandenberghe, Laignel, Laurent, Lauriat-Rage, Louwye and Mansy2002), during the opening of the Bay of Brest. The age of this terrace is not accurately known but could be considered to be ~400 ka by comparison with similar ESR-dated Fxa deposits in northern and northwestern France (Cordier et al., Reference Cordier, Harmand, Frechen and Beiner2006; Bahain et al., Reference Bahain, Falguères, Laurent, Voinchet, Dolo, Antoine and Tuffreau2007; Voinchet et al., Reference Voinchet, Despriée, Tissoux, Falguères, Bahain, Gageonnet, Dépont and Dolo2010) (Fig. 4). The first major development of frost wedges in Brittany occurred in MIS 8 (280–240 ka; Pénestin section: Van Vliet-Lanoë et al., Reference Van Vliet-Lanoë, Bonnet, Hallegouët and Laurent1997, Reference Van Vliet-Lanoë, Hibsch, Csontos, Jegouzo, Hallégouët, Laurent, Maygari, Mercier and Voinchet2009). The upper boundary of the Fxa terrace unit is deformed; its deformation might have occurred around the same time (same event?) as in Trez Rouz and Pen Hat (Fig. 3).
The Gurp section (Gironde estuary, 45.4345°N, 1.1530°W)
Background
Observations performed on this site (Figs. 1A and 5) occur in the vicinity (<30 km) of the SASZ, in the entrance to the Gironde estuary (Mazabraud et al., Reference Mazabraud, Béthoux, Guilbert and Bellier2005, Reference Mazabraud, Bethoux and Delouis2013) (Fig. 2). Present-day seismicity in this zone is significant, with historical earthquakes up to M w 6 (SI-Hex: Cara et al., Reference Cara, Cansi, Schlupp, Arroucau, Béthoux, Beucler and Bruno2015; Manchuel et al., Reference Manchuel, Traversa, Baumont, Cara, Nayman and Durouchoux2018). The stratigraphy of the section was described by Tastet (Reference Tastet1999), which describes several units of clay, sands, and peats. The stratigraphic position of the Gurp clay topped with peat (called “lignite”; Fig. 4) was attributed to the ends of MIS 11 or MIS 9 (Diot, Reference Diot1999; O’Brien and Jones, Reference O’Brien and Jones2003). Recently, Sitzia et al. (Reference Sitzia, Bertran, Bahain, Bateman, Hernandez, Garon and de Lafontaine2015), using ESR methods, dated the Amélie sands located above the peat to 217±31 and 222±31 ka (Fig. 3), which correlated this unit to MIS 8 (243–280 ka).
Description
The Holstenian (MIS 9) littoral deposits are mechanically deformed by successive events of load casts. Here, deformations in the clay (~2 m thick) show sliding planes stained with iron hydroxides and load casts, associated with upward clay injection into the peat, leading to macroscopic circular patterns called pseudo-pingo features (Dubreuilh and Marionnaud, Reference Dubreuilh and Marionnaud1973; Dubreuilh, Reference Dubreuilh1976). These features are affected by a retraction fissure set and brecciation, which suggests a postdeformational dehydration. Beneath the peat, the lower part of the Amélie sands display ground patterned by small cryogenic features, disturbed by clustered liquefaction features (Fig. 11) comparable to load casts in seismic settings (Van Vliet-Lanoë et al., Reference Van Vliet-Lanoë, Maygari and Meilliez2004).
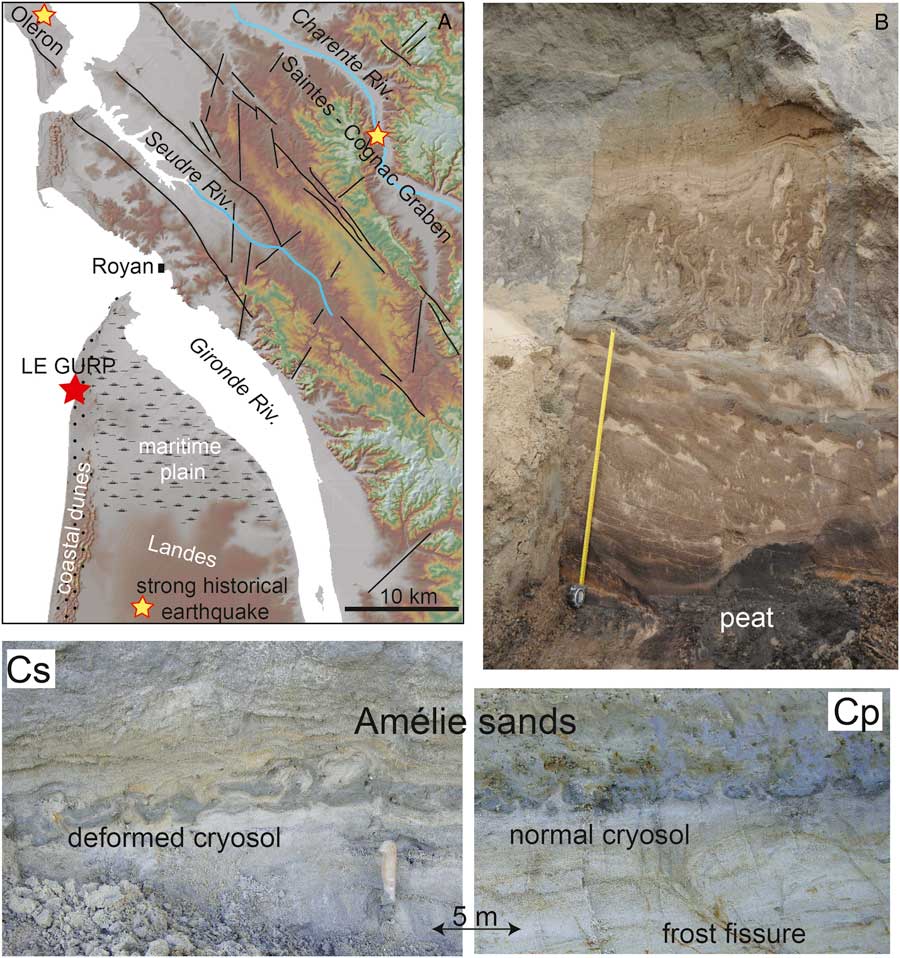
Figure 11 (color online) Le Gurp study site. (A) Regional digital elevation model. (B) Coseismic involutions above the Le Gurp peat (courtesy J.L. Schneider). (Cp) Small, periglacial ground pattern in the Amélie Sands. (Cs) The same unit deformed by liquefaction.
Interpretation
The ages of the Gurp unit should be similar to that of the Trez Rouz site with stacked and deformed coastal interglacial deposits close to today’s sea level, although deformations are commonly attributed to periglacial features (Tastet, Reference Tastet1999; Sitzia et al., Reference Sitzia, Bertran, Bahain, Bateman, Hernandez, Garon and de Lafontaine2015; Andrieux et al., 2017). Despite the interpretations of Sitzia et al. (Reference Sitzia, Bertran, Bahain, Bateman, Hernandez, Garon and de Lafontaine2015) that correlated the Amélie sands with MIS 8, we chose to use the stratigraphic position provided by the ESR dating (217±31 and 222±31 ka) consistent with the MIS 7. The estuarine sand, beneath the Amélie sands, separated by a major discontinuity with a paleosol, and above the MIS 11 peat, was correlated with MIS 9. According to our observations, the Gurp section shows at least two main events: (1) at the end of MIS 11, after the peat formation and before the estuarine sands deposition; and (2) at the end of MIS 9, older than the Amelie sands but younger than the estuarine sands, late MIS 7–based ESR dating. The lower part of the Amélie sands also shows evidence of smaller and younger events during the middle MIS 7.
DISCUSSION
Arguments for seismically induced deformations
Before this study, deformation structures at Trez Rouz, Pen Hat, and Kergleuz were considered to be a result of periglacial processes (Melou, Reference Melou1968; Morzadec-Kerfourn, Reference Morzadec-Kerfourn1974; Hallégouët, Reference Hallégouët1989), despite the lack of syngenetic evidence of segregated ice. However, the numerous features shown allow us to argue that deformations took place during or just after interglacial stages (MIS 11 and 9; Fig. 4). With this timing, the deformations should have been produced by other processes—seismic events being the most probable (see Table 1).
Neither fault reactivation nor diagnostic evidence of frost mounds has been found at Trez Rouz or Kergleuz despite evidence of late permafrost during MIS 8a and 2. The only periglacial features present are scarce frost fissures, ploughing block involutions, clast or cobble frost jacking, and bending of features by frost creep.
Most of the younger deformed units highlighted in this study indicate that they formed at a sea level close to the present day, thus in temperate to boreal conditions (MIS 11 and MIS 9a deposits; Fig. 4). Indeed, the MIS 9e, MIS 11a, and MIS 13a high stands have regionally reached +20 to +30 m (corresponding to the Middle Terrace Fx in estuaries), whereas the MIS 9a and MIS 5e are closer to today’s sea level along the coast of western Europe (Van Vliet-Lanoë et al., Reference Van Vliet-Lanoë, Laurent, Bahain, Balescu, Falguères, Field, Hallégouët and Keen2000). The age of the youngest units affected, deduced by ESR dating and the stratigraphic evidence, puts them at MIS 11, 9a/8c. Stratigraphic evidence suggests that paleoearthquakes occurred during the onset of a cooling period with a limited glacio-eustatic regression (Fig. 4). This scenario postulates that the sea level dropped only by 10 to 20 m below its interglacial maximum of +20 and −30 m during MIS 11a and 9a, respectively, for most of the events considered in our study. At Trez Rouz, a sea level close to today’s is likely for the youngest seismic event and is supported by the occurrence of jarosite along structure A. This implies the likelihood of a persisting brackish water prism persisting at these sites when the deformation occurred.
Furthermore, deformations observed at Trez Rouz above the thickest body of saprolite (25 m) needed large water storage at depth to have occurred (Figs. 3 and 4). Deformations are probably enhanced by recurrent liquefaction and a downslope mass movement, occurring when the water table was high. This situation occurs rarely during glacial stages. Deformations affecting the thickest alluvial layer (15 m) in the Kergleuz incision also suggest a high elevation of the water table. Erosional features visible at Trez Rouz, Pen Hat, and Kergleuz indicate overconsolidation processes and superficial fissuring of the deformed zones. Large water escape structures also exist at Kergleuz (Fig. 11), but their age is hard to determine more accurately than lower or middle Quaternary. The occurrence of subsurface overconsolidation of the saprolite or in the clayey units in the three sites, as well as intraclast formation (Kergleuz) or brecciation, or mud injection or water escape, suggests a rapid liquefaction and deformation in agreement with an assumption involving earthquakes (Van Vliet-Lanoë et al., Reference Van Vliet-Lanoë, Hibsch, Csontos, Jegouzo, Hallégouët, Laurent, Maygari, Mercier and Voinchet2009). The development of large deformations and shortening with injections may be related to a slower motion of the affected units over at least several days after the seismic initiation because it progressively affects the base of the overlying units.
Coseismic liquefaction and sediment deformation by clay diapirism
Detailed observations made on the three studied sites allow us to determine the likely mechanisms of deformation. Similar superficial liquefaction features associated with clay diapirism were already attributed to middle Quaternary seismic activity south of the study zone in the Vilaine estuary (Fig. 2; Van Vliet-Lanoë et al., Reference Van Vliet-Lanoë, Hibsch, Csontos, Jegouzo, Hallégouët, Laurent, Maygari, Mercier and Voinchet2009).
Liquefaction susceptibility reflects the relative resistance of soils (sandy or silty) to loss of fabric and strength when subjected to ground shaking. As water is a noncompressible fluid, the alternating squeezing and suction produced by vibrations from the local water table in the faulted Paleozoic basement induces an excess of pore water pressure, exceeding the liquid limit (Woith et al., Reference Woith, Wang, Milkereit, Zschau, Maiwald and Pekdeger2003). Oversaturation is reached by fabric destruction (unconsolidated sand or porous saprolite) and/or by coseismic water pumping (Muir-Wood and King, Reference Muir-Wood and King1993; Sibson, Reference Sibson1994), which leads to loss of soil strength and liquefaction, or even fluidization (Sibson, Reference Sibson1994; Montgomery and Manga, Reference Montgomery and Manga2003; Derakhshandi et al., Reference Derakhshandi, Rathje, Hazirbaba and Mirhosseini2007). With fluidization and a very low dynamic viscosity, buoyancy forces and hydraulic fracturing develop in the confining layer, with differential loading (Bolton and Maltman, Reference Bolton and Maltman1998). During the hydrofracturing process, an inner hydraulic pressure gradient was probably involved in tension gashes opening and forming “clastic” dykes in peat (Sibson, Reference Sibson1994; Levi et al., Reference Levi, Weinberger, Aïfa, Eyal and Marco2006). These processes also allowed (1) an incipient swell or doming that stretched the overburden cover (Powley, Reference Powley1999), (2) mud injected close to its apex within the confining layer, and (3) an upward stretching and thinning of the flanking units (Figs. 5 and 8A; Van Vliet-Lanoë et al., Reference Van Vliet-Lanoë, Hibsch, Csontos, Jegouzo, Hallégouët, Laurent, Maygari, Mercier and Voinchet2009). Youd et al. (Reference Youd, Steidl and Nigbor2004) showed that ground oscillations during an earthquake led to a continual rise of pore water pressure after ground shaking ceases, triggering the prolonged postshock deformation. When the hydraulic pressure is lowered by dewatering, the clay diapirism normally stops, and the processes of consolidation begin, followed by a later collapse (Powley, Reference Powley1999). Coseismic pumping also leads to overconsolidation of sediments at depth by water expulsion to the surface, although the superficial layers are first liquefied and further overconsolidated after desiccation (Youd et al., Reference Youd, Steidl and Nigbor2004). This could explain the late retraction fissures formed by desiccation in the zones suspected to have been liquefied, especially at the Trez Rouz and Kergleuz sites.
Coseismic liquefaction is commonly studied in sands (e.g., Obermeier et al., Reference Obermeier, Martin, Frankel, Youd, Munson, Munson and Pond1993). Because kaolinite-rich saprolites behave as quick clays along shore cliffs exposed to the swash impact of waves, it is better to use the term “clay diapirism” instead of “shale diapirism” in our study. This mechanism, already well observed at Pénestin (Van Vliet-Lanoë et al., Reference Van Vliet-Lanoë, Hibsch, Csontos, Jegouzo, Hallégouët, Laurent, Maygari, Mercier and Voinchet2009), could explain most of the mesoscopic deformation structures observed in saprolites at the Kergleuz and Trez Rouz sites, which includes the extension in sands (unit TRZ5) and retraction fissures developed by dewatering and desiccation in the injected saprolite or liquefied sediments. The collapse of the interstitial porosity by vibration also explains why any remobilization by a latter event is almost impossible in sands and in saprolites. The mechanisms are not fundamentally different in both materials. Furthermore, clay diapirism also explains shortening fabric in partly consolidated material in the same places.
The stretching by solifluction and/or thinning of the overburden alluvial body, upslope at Trez Rouz, limited the confining pressure for the injection in structure A. Moreover, postdiapirism consolidation could have prevented a renewed liquefaction in the same location. This is also true for structures B to C, leading to the transfer of the liquefaction zone to the northern part of the graben (structure A). The confining of the saprolite under the accumulation of TRZ9 slope deposits at the northern edge of the graben, and the absence of preexisting overconsolidation, facilitate the upward migration of the saprolite in structure A (Fig. 7, phase IV).
Impact of altered Variscan structures on deformation initiation
The main deformation process highlighted at Trez Rouz, Kergleuz, and Pénestin (Van Vliet-Lanoë et al., Reference Van Vliet-Lanoë, Hibsch, Csontos, Jegouzo, Hallégouët, Laurent, Maygari, Mercier and Voinchet2009) is a small-scale clay diapirism, initially triggered by coseismic water pressure. Further loading and lateral spreading on an already deformed and deeply weathered shale bedrock allowed the clay diapirism to develop.
The initial bulge shape, induced by liquefaction, is modified by lateral or oblique upward migration of fluidized clays and may generate a network of clay dykes or sand pipes, as happened at Pen Hat. In classical clay diapirism, the diapirs usually develop in the form of ring or conic faults, which enhance the rise of the diapir. Here, and in all other studied sites, the bulge shape is parallel to the water escape from the basement, leading to injection swarms roughly parallel to the basement faults. This localized overpressure source results in tension gash development in the confining stratified alluvial system, accumulated in a trough to the south of structure B at Trez Rouz (Fig. 3). The folds and injections are parallel to the main basement structures, but also to the orientation of the preexisting confined channel sedimentary pattern (TRZ6b; Fig. 7, phase I). The parallelism between sand fissures and channels is similar to the sand dikes along the Mississippi River caused by the New Madrid 1811 and 1812 earthquakes (Obermeier, Reference Obermeier1996). The absence of surface fault rupture and the subparallel characteristic of the injections related to the basement faults result from a mechanism of water injection from basement faults into the capping saprolite (Fig. 3A). Mechanically, the water table level must not be deeper than 5 m from ground level to create these structures (Olson et al., Reference Olson, Green and Obermeier2005).
Clay diapirism is rather common in Europe, for instance, in the Oligocene Bovey-Tracey basin located in Devon in the United Kingdom along the Sticklepath Fault (Fig. 2; Van Vliet-Lanoë et al., Reference Van Vliet-Lanoë, Hibsch, Csontos, Jegouzo, Hallégouët, Laurent, Maygari, Mercier and Voinchet2009), and in the lignite grabens in Germany and Poland (Eissmann, Reference Eissmann1987). Site effects (Semblat et al., Reference Semblat, Kham, Parara, Bard, Pitilakis, Makra and Raptakis2005) on unconsolidated sedimentary bodies certainly amplified the likelihood of diapirism in all the studied sites near Variscan structures. The minimal thickness of saprolite needed to cause diapirism is about 10 m, as evident at Pénestin and Kergleuz.
Seismo-tectonic significance
Currently, the focal depth for most of major instrumental earthquakes indicates that the accommodation of the regional plate deformation is recorded mostly along major shear zones (mostly Variscan shear zones; Mazabraud et al., Reference Mazabraud, Bethoux and Delouis2013). The present-day stress field is northwest–southeast with a clear strike-slip signature and a slight west–east transtensive component in Brittany (Olaiz et al., Reference Olaiz, Muñoz-Martín, De Vicente, Vegas and Cloetingh2009). Seismic analysis produced after the Lorient/Hennebont earthquake in 2002 (M w 4.3 or Lg 5.4 magnitude scales) along the SASZ indicates a main 170° trending regional stress field (Perrot et al., Reference Perrot, Arroucau, Guilbert, Déverchère, Mazabraud, Rolet, Mocquet, Mousseau and Matias2005). No fault displacement affecting the surface has been detected from this event or during the historical period. Generally, the regional seismicity is rather low. No mud volcanoes have ever been observed on the Holocene mudflats of the Bay of Brest after the recent earthquakes (e.g., October 11, 2013; December 11, 2013; October 30, 2015; December 8, 2016; December 11, 2016; January 24, 2018: M l 3.4 to 3.9, local magnitude according to Comissariat à l'Energie Atomique network) or after the recent, major Hennebont (in 2002; M w 4.3) and Quimper (in 1959; M w 5.4) earthquakes. Nevertheless, Holocene submarine slumps in estuarial clays are present at the entrance of the Elorn estuary (Grégoire et al., Reference Grégoire, Le Roy, Ehrhold, Jouet and Garlan2017; Fig. 1B: S). Clay diapirism associated with liquefaction has only been observed in middle Pleistocene deposits in this region. This process needs specific conditions that do not currently occur in Brittany and surrounding areas, despite the fact that environmental conditions look similar between the middle Pleistocene and today, notably from sedimentary and sea level points of view (relative sea level close to the 0 NGF; see the “Trez Rouz” section). Therefore, as for middle Pleistocene peat deposits, Holocene mudflats in the Bay of Brest could easily be marked by mud ejection above basement faults in case of a major earthquake.
The only major regional faults able to generate strong earthquakes are the Elorn and the Kerforne Fault Systems and the SASZ (Figs. 1 and 2). The major system, the SASZ, is the farthest away, >25 km, from our studied sites, while the other faults exist at depth beneath our studied sites (Fig. 1). To estimate the range of magnitudes possible to explain the paleoearthquakes, we considered regional magnitude-bound relations adapted from stable continental regions, based on relationships between earthquake magnitude and the most distal occurrences of level-ground liquefaction from the earthquake source (Obermeier et al., Reference Obermeier, Martin, Frankel, Youd, Munson, Munson and Pond1993; Olson et al., Reference Olson, Green and Obermeier2005), because no magnitude-bound relationships are available for Brittany. Based on the minimum distance between the studied sites and the SASZ (25–40 km), a minimum M s of 6.4 to 6.9 is required to produce liquefaction at the studied sites (M s values are similar to M w when they are greater than 5.5; Lolli et al., Reference Lolli, Gasperini and Vannucci2014). For the other two faults, located closer, a M s of 5.5 is enough. If we consider that a saprolite has high liquefaction susceptibility, because of its fragile porous fabric, the required minimum M s for an earthquake along the SASZ can be reduced to an M s of 6 to 6.4 and reduced to M s 5 for the closest faults (Kerforne and Elorn Faults).
Moreover, because earthquakes occurring during periods of relatively high sea levels and consequently high water tables, with site amplification the magnitude need not be so high for significant deformation. Indeed, the discharge created by a lowering sea level could open the fissures, promoting deeper water infiltration, reducing the friction and thus limiting the accumulation of strain, especially on shale or clay. Fluid pressure would propagate as slow stress waves along fissure paths and could enhance the effects of earthquakes (Sibson, Reference Sibson1994; Segall and Rice, Reference Segall and Rice1995; Mulargia and Bizzarri, Reference Mulargia and Bizzarri2014).
Geodynamic significance
Any M w 5 earthquake along the Kerforne and Elorn Faults, or M w 6 earthquake along the SASZ, is documented by historical and instrumental seismicity, but the possibility that such events occurred during the Quaternary cannot be excluded. Indeed, according to the length-magnitude scaling relationship (Wells and Coppersmith, Reference Wells and Coppersmith1994), the ~40-km-long Elorn and Kerforne faults and the ~100-km-long segments of the SASZ possibly could generate earthquakes of a maximum magnitude ~6.8 and ~7.4, respectively. Recently, Calais et al. (Reference Calais, Camelbeeck, Stein, Liu and Craig2016) suggested that large earthquakes in intraplate contexts such as in Brittany do not obey the seismic recurrence cycle, such as those located at the frontiers of plates. Moreover, the authors suggest that large earthquakes in stable continental regions are better explained by transient perturbations of local stress on fault strength that release elastic energy from a prestressed lithosphere.
From the stratigraphic analysis and the available dating, at least two periods of clusters of earthquakes are evident in western France: (1) at the onset of MIS 10, ~380 ka, and (2) at the onset of MIS8, ~280–265 ka (Fig. 3). No older or younger important deformations is evident, except some younger events in the Aquitaine during the Younger Dryas stade (Schneider et al., Reference Schneider, Van Vliet-Lanoë and Sitzia2012). The second period (280–265 ka) is frequently associated with other potential paleoseismic events in western Europe. It could be the case for major falling down of the Sangatte paleocliff, the Cagny Epinette living-floor faulting in the Somme valley, and recurrent load casts in saprolite in central Brittany (Fig. 2; Van Vliet-Lanoë et al., Reference Van Vliet-Lanoë, Vandenberghe, Laignel, Laurent, Lauriat-Rage, Louwye and Mansy2002). Nevertheless, some deformations such as reverse faulting affecting the 160 ka loesses of Sangatte are now interpreted as thermokarstic features (Van Vliet-Lanoë et al., Reference Van Vliet-Lanoë, Brulhet, Combes, Duvail, Ego, Baize and Cojan2017). Sediment records in our study zone are incomplete because of lack of exposures (McCalpin, Reference McCalpin1996; Caputo, Reference Caputo2005; Beck, Reference Beck2009), so other earthquakes may have been missed. We highlight many discontinuities in the records, even when overconsolidation normally limits the erosion efficiency (see Fig. 3). Dating and paleoclimate records clearly indicate that the seismic events occurred during the onset of MIS 10 and 8, so we postulate that these two periods of seismic events could be triggered by of the rapid growth of major ice sheets (particularly MIS 10; Van Vliet-Lanoë et al., Reference Van Vliet-Lanoë, Bonnet, Hallegouët and Laurent1997, Reference Van Vliet-Lanoë, Vandenberghe, Laignel, Laurent, Lauriat-Rage, Louwye and Mansy2002). We did not highlight any paleoseismic events at the onset of the glaciations that are more recent than MIS 8 in western France. The Gurp section, located closer to the Alpine sutures, is still active. However, the ice caps of the less extensive subsequent glaciations (MIS 6, 4, 2) could be too small and too far away from the study zone to produce a forebulge that adequately deforms the Armorican massif lithosphere and adequately increases the stress loading. Also, some cryogenic consolidation of the saprolite (permafrost) and old tidal muds during the cold Saalian I (MIS 8; 280–240 ka) could prevent new liquefaction during the onset of more recent glaciations.
Glacio-isostatic stress perturbation is not the only factor that could trigger a major earthquake in Brittany. Internal Earth dynamics such as, for example, changes in pressure-driven flow within the asthenosphere or slab sinking could also bring answers to the origin of these middle Pleistocene intraplate seismic events. Indeed, these paleoearthquakes could have been induced by the African-Eurasian plate convergence, and, more precisely, a brief acceleration of plate motion during the investigated period is possible (Iaffaldano and Bunge, Reference Iaffaldano and Bunge2015). This convergence is also postulated as the origin of other paleoseismic events during the same period, occurring to the south of the studied zone, closer to the plate boundary. For instance, on the northern foot slope of the Pyrenean mountains, superficial ruptures have been evidenced, deforming the upper terrace of the Adour River at Meilhan dated to <500 ka (Fig. 2; Carbon et al., Reference Carbon, Combes, Cushing, Granier and Grellet1995). Moreover, to the south of the Western Alps, coseismic ruptures dated to between 100 and 300 ka occurred along the Trévaresse Fault (Fig. 2; Aix-en-Provence: Chardon et al., Reference Chardon, Hermite, Ngyen and Bellier2005). Additionally, orbital forcing enhanced by solar activity and affecting Earth’s rotation velocity could be envisaged as another source of lithospheric loading favoring seismic periods (Bendick and Bilham, Reference Bendick and Bilham2017). This forcing also influences the climate and dynamic processes in the liquid metallic core of Earth controlling the magnetic field (Hide and Dickey, Reference Hide and Dickey1991; Worm, Reference Worm1997; Encrenaz et al., Reference Encrenaz, Bibring and Blanc2003; Laut, Reference Laut2003). Perturbations in the deepest part of Earth could also affect the stress field near the surface by possibly accelerating mantle convection and plume activity in the asthenosphere (Larson and Olson, Reference Larson and Olson1991; Worm, Reference Worm1997). Curiously, the highlighted seismic periods occurred during the onset of glaciations and at the same time as two magnetic low (geomagnetic low dipole) periods at 380 and 280 ka (Worm, Reference Worm1997; Ménabréaz et al., Reference Ménabréaz, Thouveny, Bourlès and Vidal2014)
CONCLUSION
The combined examination of dating, geomorphology, and sedimentologic and paleoecological data from sites with Quaternary deformations in western Brittany allow for an analysis of the conditions that drive paleoseismicity in an intraplate region of Europe. From a mechanical point of view, clay diapirism development and liquefaction in regions with limited tectonic activity is linked to the occurrence of an unconsolidated sedimentary or saprolitic clay unit, with the presence of a rather shallow water table and a confining surface layer. The triggering seismicity is not necessarily important (not much higher than present day) and is probably associated with site effects. From a geodynamic point of view, two periods of coseismic events are evident: during early MIS 10 (~380 ka) and early MIS 8 (~280–265 ka). They may be associated with the dynamics of Africa-Eurasia’s plate convergence, in part accommodated in the far field by reactivation of major shear zones (Fig. 2). Still open to discussion is the possible glacio-isostatic impact on the stress field during the onset and decay of ice sheets together with their forebulge dynamics and the influences of orbital forcing on lithospheric loading.
ACKNOWLEDGMENTS
This research did not receive any specific grant from funding agencies in the public, commercial, or not-for-profit sectors. We first thank the “Reserve Naturelle Régionale de Crozon” in Brittany to have allowed the complementary sampling for new IRSL dating at Pen Hat. We thank especially Jamie Shulmeister and Roy Van Arsdale for their constructive recommendations to improve our paper, including enhancements to scientific clearness and language. We thank also an anonymous French reviewer for his judicious comments on the French seismic activity.


