I. Introduction
Prosecco is one of the most popular sparkling wines in the world (Boatto, Barisan, and Pomarici, Reference Boatto, Barisan and Pomarici2017). The impressive growth in demand witnessed in recent years spurred changes in the appellation system as well as efforts on the part of producers to differentiate their products in terms of brand, cuvée, price, and packaging. How can these changes impact consumer loyalty?
In the sparkling wine market, consumer loyalty is mainly associated with appellation (Thiene et al., Reference Thiene, Galletto, Scarpa and Boatto2013; Onofri, Boatto, and Dal Bianco, Reference Onofri, Boatto and Dal Bianco2015; Dal Bianco et al., Reference Dal Bianco, Boatto, Trestini and Caracciolo2018). Moreover, consumer loyalty comes from comparing various appellations, grape varieties, packaging, brand or sensory profiles to the respective prices, especially when purchasing is infrequent (Corsi, Overton, and Casini, Reference Corsi, Overton and Casini2014).
This article investigates consumer loyalty in the Italian market for Prosecco wine. In particular, we examine the relationship among wine appellation, price, and consumer loyalty. To that effect, we run a Dirichlet model (DM) on Nielsen scan data to estimate brand performance measures (BPM) and study purchase patterns in the sparkling wine market.
The article is structured as follows. Section II provides an overview of the literature on brand loyalty. Section III describes data and methodology, Section IV presents the results, and Section V concludes.
II. Literature Review
Customer loyalty is the most important component of brand equity. Customer loyalty can express itself in terms of attitudes (i.e., commitment to the brand) or behaviors (i.e., purchase patterns), or a combination of both (Uncles, Dowling, and Hammond, Reference Uncles, Dowling and Hammond2003).
Methodologies for measuring brand loyalty can be parametric, for example, structural equation or state preference models, or non-parametric (Cohen, Lockshin, and Sharp, Reference Cohen, Lockshin and Sharp2012; Jarvis, Rungie, and Lockshin, Reference Jarvis, Rungie and Lockshin2007). The literature on wine brand loyalty mainly adopts a behavioral approach.
Focusing on Prosecco, Thiene et al. (Reference Thiene, Galletto, Scarpa and Boatto2013) estimate a latent class regression model using survey data and report consumption patterns for various Prosecco appellations. Onofri, Boatto, and Dal Bianco (Reference Onofri, Boatto and Dal Bianco2015) apply a probit model to Nielsen scan data to test the relationship between Prosecco appellations and consumer features. Dal Bianco et al. (Reference Dal Bianco, Boatto, Trestini and Caracciolo2018) investigate the German market using a Heckman probit model on German Nielsen scan data. They find a general lack of awareness of the different Prosecco appellations.
In this article, we follow a different approach and methodology. We estimate behavioral loyalty using a non-parametric DM. This model has received a lot of attention in the last decade (Cohen, Lockshin, and Sharp, Reference Cohen, Lockshin and Sharp2012; Jarvis, Rungie, and Lockshin, Reference Jarvis, Rungie and Lockshin2007; Corsi, Overton, and Casini, Reference Corsi, Overton and Casini2014; Rungie et al., Reference Rungie, Laurent, Mtimet and Jarvis2006).
The DM estimates BPMs while interpreting market dynamics and consumers purchase patterns (Ehrenberg, Uncles, and Goodhardt, Reference Ehrenberg, Uncles and Goodhardt2004). In repeat-purchase markets, the DM assumes that customers exhibit polygamous behavior, that is, their loyalty is split among a repertoire of brands. Among these brands, purchases occur “in a seemly irregular or even as-if-random manner” (Ehrenberg, Uncles, and Goodhardt, Reference Ehrenberg, Uncles and Goodhardt2004, p. 1307).
The DM has been applied to the wine market. Corsi, Overton, and Casini (Reference Corsi, Overton and Casini2014) employed the DM to explore the impact of European wine policy on consumer loyalty to appellations, price, and external attributes within the Italian market. Jarvis, Rungie, and Lockshin (Reference Jarvis, Rungie and Lockshin2007) focused on loyalty to varieties in the Australian wine market.
III. Research Methodology and Data
The specific DM used in this article was first proposed by Goodhardt, Ehrenberg, and Chatfield (Reference Goodhardt, Ehrenberg and Chatfield1984), and later refined by Rungie (Reference Rungie2003). The DM assumes that the market is stationary, that is, consumer brand choices change slowly over time through information and experience. Furthermore, we assume that markets are not differentiated within single brands; each brand has a unique market share and probability of being purchased.
The DM is a probability density function for the purchases of all brands in a product category over a given period of time. The model combines the Beta Binomial Distribution (BBD), which models the category purchase rate, and the Dirichlet Multinomial Distribution (DMD), which models the probability of choosing the i-brand within a product category (Rungie, Reference Rungie2003). The DM input data are BPMs (see Table 1): market share, penetration rate, purchase frequency, sole loyals (i.e., consumers that buy one brand only), share of category requirements, and repeat purchases (Corsi, Overton, and Casini, Reference Corsi, Overton and Casini2014). The DM output are BPMs estimates, that is, theoretical values from fitting BBD and DMD to raw purchase data through the likelihood method (Ehrenberg, Uncles, and Goodhardt, Reference Uncles, Dowling and Hammond2003). The comparison between theoretical values and observed penetration and purchase frequency highlights the double jeopardy phenomena, whereby brands with small markets suffer from low purchases and low brand loyalty (Jarvis, Rungie, and Lockshin, Reference Jarvis, Rungie and Lockshin2007).
Table 1 Observed BPMs

Loyalty is evaluated through the loyalty-related BPMs and the polarization index (ϕ), which is calculated using parameters of DMD probability density function (Jarvis, Rungie, and Lockshin, Reference Jarvis, Rungie and Lockshin2007). The polarization index ranges from 0 (minimum loyalty) to 1 (maximum loyalty).
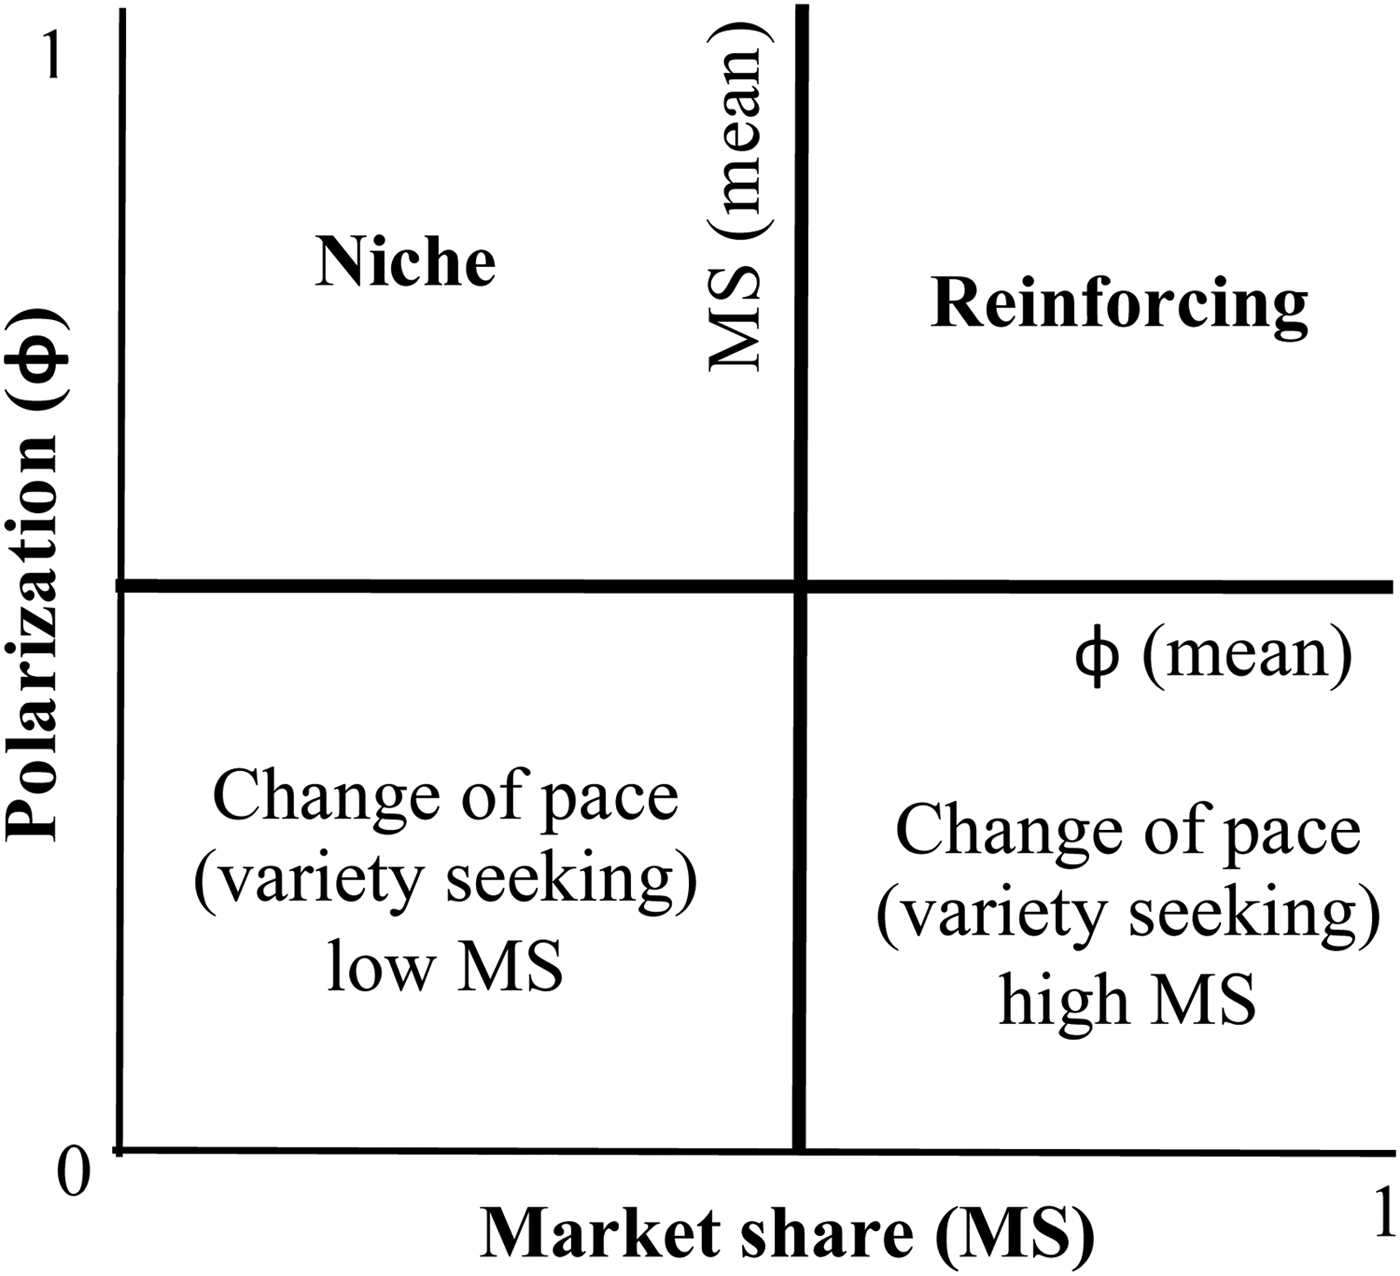
In Figure 1, we plot the polarization index against market shares (Corsi, Overton, and Casini, Reference Corsi, Overton and Casini2014). The scatterplot describes consumer loyalty patterns by comparing brand-specific repurchase behavior with average market-wide loyalty, as well as deviations of single brands with respect to their product category (Corsi, Overton, and Casini, Reference Corsi, Overton and Casini2014).

Figure 1 A Representation of Polarization Positioning
The four quadrants can be described as follows: attribute levels in the upper-right quadrant exhibit “excess loyalty” (Jarvis, Rungie, and Lockshin, Reference Jarvis, Rungie and Lockshin2007), while attribute levels located in the upper-left quadrant show “niche” behavior. Attribute levels located in both lower quadrants display “change of pace” tendencies. These tendencies are typical of variety-seeking brands lacking in reliable consumer base or occasionally chosen by consumers loyal to larger brands, but willing to diversify their purchase repertoire.
We draw on 2015 Nielsen scan data (A. C. Nielsen, 2017), which cover the retail sale of sparkling wines in Italy.Footnote 1 The sample accounts for 80% of the volume of all off-premise sales of non-champagne sparkling wines in Italy (or 67% in value)—a market that represents around 2.4 million hectoliters in annual sales (Champagne accounts for an additional 400,000 hectoliters).Footnote 2 In the Italian market, sparkling wines enjoy an observed 51.7% penetration rate (b) (Nielsen scan data) and market shares of approximately 20% with respect to overall wine sales (Euromonitor, 2017). The purchase frequency (w) is 3.37 liters on average for each buyer. Non-appellation and Prosecco each represent approximately 30% of the overall sparkling sales. Classic-method wines such as Franciacorta, Trento, and Oltrepo Pavese enjoy a significant value-based market share (22–23%) as a result of their high-price positioning. Champagne's market share is also significant. Sweet sparkling wines, such as Asti and Brachetto, and small appellations such as Dolomiti, have market shares of less than 10%. Market shares refer to values.
IV. Results
The DM is estimated on the Nielsen sample, which is subdivided by appellations (11 appellations and 1 non-appellation) and price categories (5 categories, following the classification proposed by Rabobank International (2003)).
Dirichlet theoretical values (Table 2) follow observed penetration and purchase frequency, while loyalty-related measures showed greater deviations (Table 3). Values that are higher than the corresponding theoretical values, especially for repeated purchases (Cohen, Lockshin, and Sharp, Reference Cohen, Lockshin and Sharp2012), suggest a higher loyalty for Classic sparkling wines. In contrast, negative deviations in price categories report lower loyalties in wine priced between €3 and €7. However, this picture might be influenced by seasonality effects colliding with the model's stationary market assumption.
Table 2 Observed BPMs (O) and Theoretical Dirichlet Values (T) by Appellation and Price Bracket

* Percentage of buyers purchasing the same brand five or more times.
Source: A. C. Nielsen (2017).
Of all appellations considered, Prosecco exhibits the highest penetration rate and purchase frequency (Table 2). According to Fader and Schmittlein (Reference Fader and Schmittlein1993), high-market shares are typically associated with greater observed loyalty than DM theoretical values would predict. With regards to sole loyals and repeat purchases, however, Prosecco is in line with other appellation wines.
Loyalty measures for appellation sparkling wines are illustrated in the scatterplot (Figure 2).Footnote 3 DOC Prosecco and DOGC Prosecco are both located in the upper-right quadrant, showing similar loyalty characteristics even though DOC wines enjoy significantly higher-market shares. The Dolomiti appellation, which includes wines produced in mountainous areas, displays niche behavior. Classic-method sparkling wines exhibit different features. The Trento DOC does not show excess loyalty, while Franciacorta reaches a wider share of variety-seeking customers. Sweet sparkling wines fare poorly: they exhibit low market shares and attract variety-seeking consumers. This assessment is confirmed by recent negative trends in the Italian market for sweet sparkling wines. Foreign appellations do not report high loyalty; their consumption is restricted to a small market.
Sparkling wines priced less than 5 euros (approximately 30% of sales) include non-appellation and sweet sparkling wines, while wines priced more than 10 euros (approximately 30% of sales) cover mainly classic-method sparkling wines (Table 2). Prosecco covers a wide range of prices (€4–€10) that overlap in three price categories.
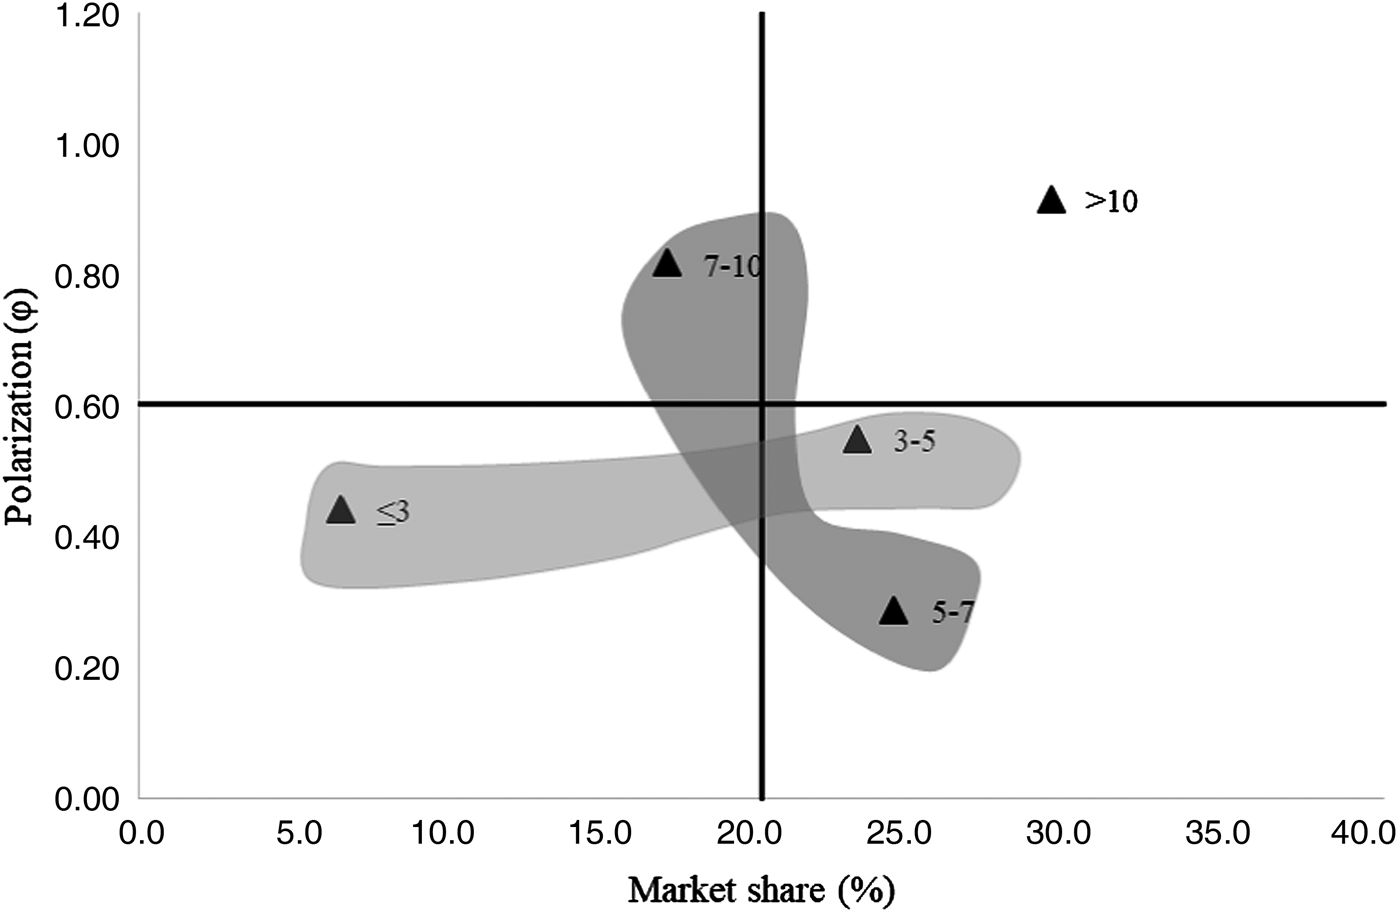
The model shows that lower-priced wines exhibit different purchasing patterns compared to the upper-tier wines. The scatterplot in Figure 3 suggests the existence of a high loyalty for super-premium and ultra-premium wines (bottles more than €7) and low loyalty for basic, popular, and premium wines (bottles less than €7). The latter (approximately 60% of sales) might be due to the fact that consumers in this category tend to shift between different price points (shaded area), as opposed to sticking to the most affordable wines. This is positive for high-priced Prosecco: loyalty is greater for higher-priced wines.
V. Conclusion
This article investigates consumer loyalty in the Italian retail market for Prosecco, focusing on the impact of appellation and price.
We first found that consumers are loyal to the Prosecco appellation. We then showed that wines in the higher-price segment (10 euros or more) benefit from strong customer loyalty. These wines, although they have limited production and penetration rates, exhibit high value-based market shares. High-priced Prosecco wines benefit from these results.
Wines in the lower-price tiers (5 euros or less), include a wide value-for-money assortment and are mostly without appellation. Loyalty in this segment is mainly due to the tradition of opening bottles during annual celebrations.
In this context, suppliers should consider the potential impact of promotional strategies with deep discounts (Corsi, Overton, and Casini, Reference Corsi, Overton and Casini2014). These strategies, although they might improve competitiveness and sales in the short run, can hurt the appellation's image, and, thus, consumer loyalty in the long run.
Finally, we note that the limits of the analysis include the failure of the DM model to take into account seasonality effects. This analysis could be further refined by investigating the role of single brands and sensory attributes on consumer loyalty and by including analyses of market segmentation among sparkling wine consumers.


