


1. Introduction
Elephants have been poached for their ivory since antiquity (Barbier et al., Reference Barbier, Burgess, Swanson and Pearce1990). The African Elephant (Loxodonta africana) population, which was between three to five million in the 1930s and 1940s (World Wildlife Fund, 2015), fell to about 1,300,000 by 1979, and to around 600,000 in 1989 (Barbier et al., Reference Barbier, Burgess, Swanson and Pearce1990). This led to international commercial trade in African elephant ivory being declared illegal in 1989 under the Convention on International Trade in Endangered Species (CITES).Footnote 1 Yet continued poaching threatens elephants with extinction. Wittemyer et al. (Reference Wittemyer, Northrup, Blanc, Douglas-Hamilton, Omondi and Burnham2014) estimated that between 2010 and 2012 about 34,000 African elephants were poached annually. This is between 5 and 8 per cent of a population believed to number between 400,000 and 630,000 (Thouless et al., Reference Thouless, Dublin, Blanc, Skinner, Daniel, Taylor, Maisels, Frederick and Bouche2016). Elephants are listed as ‘vulnerable’ under the International Union for Conservation of Nature (IUCN) ‘Red List’ of threatened species (Blanc, Reference Blanc2008). Since these poaching rates are unsustainable, there is much concern for the plight of elephants.
Following the collapse of the Soviet Union in the early 1990s, however, ivory from extinct mammoth (Mammuthus primigenius) carcasses became available as a substitute for elephant ivory (Martin and Martin, Reference Martin and Martin2010, Reference Martin and Martin2011), with Russian mammoth ivory exports rising to about 85 metric tonnes per year since 2010. A large stock of mammoth tusks, from perhaps as many as 10 million carcasses, lies beneath the Arctic tundra (Lister and Bahn, Reference Lister and Bahn2007).
This paper examines the effect exports of Russian mammoth ivory had upon the the illegal market for elephant ivory.Footnote 2 We provide estimates of this impact by analyzing data from two sources. These include a time series of the aggregate world tonnage of seizures of elephant ivory, and a panel of the number of elephant ivory seizures by country using all countries in the world. Our methodology is to use mammoth ivory supply to explain the observed interdictions of elephant ivory. To deal with the potential endogeneity between mammoth and elephant ivory, we utilize an instrumental variable approach. Because mammoth ivory is often discovered incidentally to mining operations, we use the Russian mining industry rents as an instrumental variable to identify the effect mammoth ivory has had upon elephant poaching and elephant ivory interdictions.
We find that a one tonne (1000 kilograms) increase in Russian mammoth ivory exports causes interdiction seizures of illegal African elephant ivory to decrease by as much as 0.8 tonnes. At 10 kilograms of ivory per elephant, and an estimated 12 per cent interdiction rate, the 84 tonnes of Russian mammoth ivory exports produced on average per year between 2010–2012 may have reduced elephant ivory poaching by as many as 50,000 animals per year. At the current African elephant population levels of between 400,000 and 630,000 animals, absent mammoth ivory poaching would be well beyond sustainable levels. By way of comparison, poaching in the decade prior to the ban was about 100,000 animals per year (Barbier et al., Reference Barbier, Burgess, Swanson and Pearce1990), so our estimates suggest that as much as three-quarters of the reduction (50,000 out of 66,000 fewer animals poached) may be due to the present levels of mammoth ivory exports. We also find that absent mammoth ivory, elephant ivory prices might have been been double their current levels, and we argue that this is likely the mechanism by which mammoth ivory has affected elephant poaching.
There is a growing literature on the effect substitutes have upon illegal activity. Fischer (Reference Fischer2004) suggests that the legal trade in substitute ivory could make it easier for poachers to ‘launder’ their illegal wares (see also Stiles, Reference Stiles2004, Reference Stiles2009; Bulte and Damania, Reference Bulte and Damania2005; Bulte et al., Reference Bulte, Damania and van Kooten2007). While this may be the case for elephant ivory grandfathered in the 1989 ban,Footnote 3 and for elephant ivory made available in the 1999 and 2008 CITES approved sales of African stockpiles, as well as for the relatively minor trade in hunting trophies,Footnote 4 it probably is not the case for mammoth ivory. Martin and Vigne (Reference Martin and Vigne2011), Martin and Martin (Reference Martin and Martin2010, Reference Martin and Martin2011), and Vigne and Martin (Reference Vigne and Martin2014) find that markets in Hong Kong and China generally distinguish between the two types of ivory, and that when they do not, the two can be easily identified. Thus for ivory, it is difficult to pass off illegal elephant ivory as its legal mammoth ivory substitute, which may explain why mammoth ivory trade is still legal.
The remainder of the paper is organized as follows. Section 2 describes the events leading to the CITES ban on elephant ivory trade and presents stylized facts about the post-ban era. Section 3 presents a theoretical model, which distinguishes among different equilibria using the stylized facts and motivates the empirical analysis. Section 4 empirically analyses the effect mammoth ivory has had upon elephant ivory interdictions, elephant poaching, and elephant ivory prices. Section 5 uses our empirical estimates to determine the magnitude of the effect that mammoth ivory has had on reducing poaching. Section 6 concludes.
2. The mammoth and the elephant ivory markets
This section provides background on the elephant and mammoth ivory trade. Data sources and summary statistics are contained in the online appendix.
2.1 Pre-ban ivory trade
Prior to the CITES ban on trade in elephant ivory in 1989, 30 of the 37 African countries with elephant populations exported elephant ivory. Total African ivory exports per year averaged about 300 tonnes in the 1950s, 400 tonnes in the 1960s, 700 tonnes in the 1970s, and nearly 800 tonnes by the 1980s, reaching its peak of 1,162 tonnes in 1980 (Barbier et al., Reference Barbier, Burgess, Swanson and Pearce1990). The decline in ivory production in the late 1980s, however, may not have corresponded to a decline in animals killed by poachers, because average tusk size was decreasing as the large male elephants were eliminated by poachers.Footnote 5
The CITES ban was the third step in a series of tightening restrictions on elephant ivory trade. In 1976, CITES listed elephants in Appendix II, which required exporters to issue certificates for exports and importers to demonstrate that their imports had certificates. In 1986, CITES further tightened control over ivory trade by forcing the exporting countries to submit a management plan including harvest quotas for elephants before CITES would issue export certificates. Reported exports declined after 1986, perhaps in part due to exporting countries switching to illegal trade rather than submitting management quotas from CITES. This system collapsed because the exporting countries were unwilling to restrict their own exports when the verification of others’ exports was not possible. This led to all international trade in elephant ivory being banned by listing African elephant ivory in Appendix I, effective January 1990 (Barbier et al., Reference Barbier, Burgess, Swanson and Pearce1990).
2.2 Post-ban ivory trade
Following the 1989 CITES ban on elephant ivory trade, the Elephant Trade Information System (ETIS), a sub-organization of CITES, began monitoring illegal trade in elephant ivory and ivory related products. Figure 1 shows the worldwide post-ban African elephant ivory seizures for the period 1989–2013. The line marked with circles is worldwide tonnage (in metric tonnes) of elephant ivory seizures (raw and worked). The line marked with squares shows the worldwide number of interdictions resulting in a seizure. It is clear that both the total tonnage and total number of seizures increased during the period 2010–2013.Footnote 6 Elephant ivory seizures have averaged over 20 tonnes per year since 1989, and seizures from 2009–2012 averaged 40 tonnes per year. Since not all illegal ivory trades are seized, however, the ETIS ivory seizure data represents only a fraction of poaching.Footnote 7 The number of interdictions occurring in Africa are also shown (triangles). The African seizures data is not available after 2010, but it remains fairly constant through 2010. Finally, the line marked with diamonds shows the Proportion of Illegally Killed Elephants (PIKE), a survey of elephant carcasses by Monitoring the Illegal Killing of Elephants (MIKE). The PIKE data shows that across survey sites the median proportion of elephant carcasses which were killed illegally has been increasing since those surveys began in 2002, suggesting that the rising interdictions reflects an increase in poaching. This increase could be the result of an increase in ivory demand, stricter law enforcement, or both.Footnote 8 Below, we attempt to sort out these different effects.
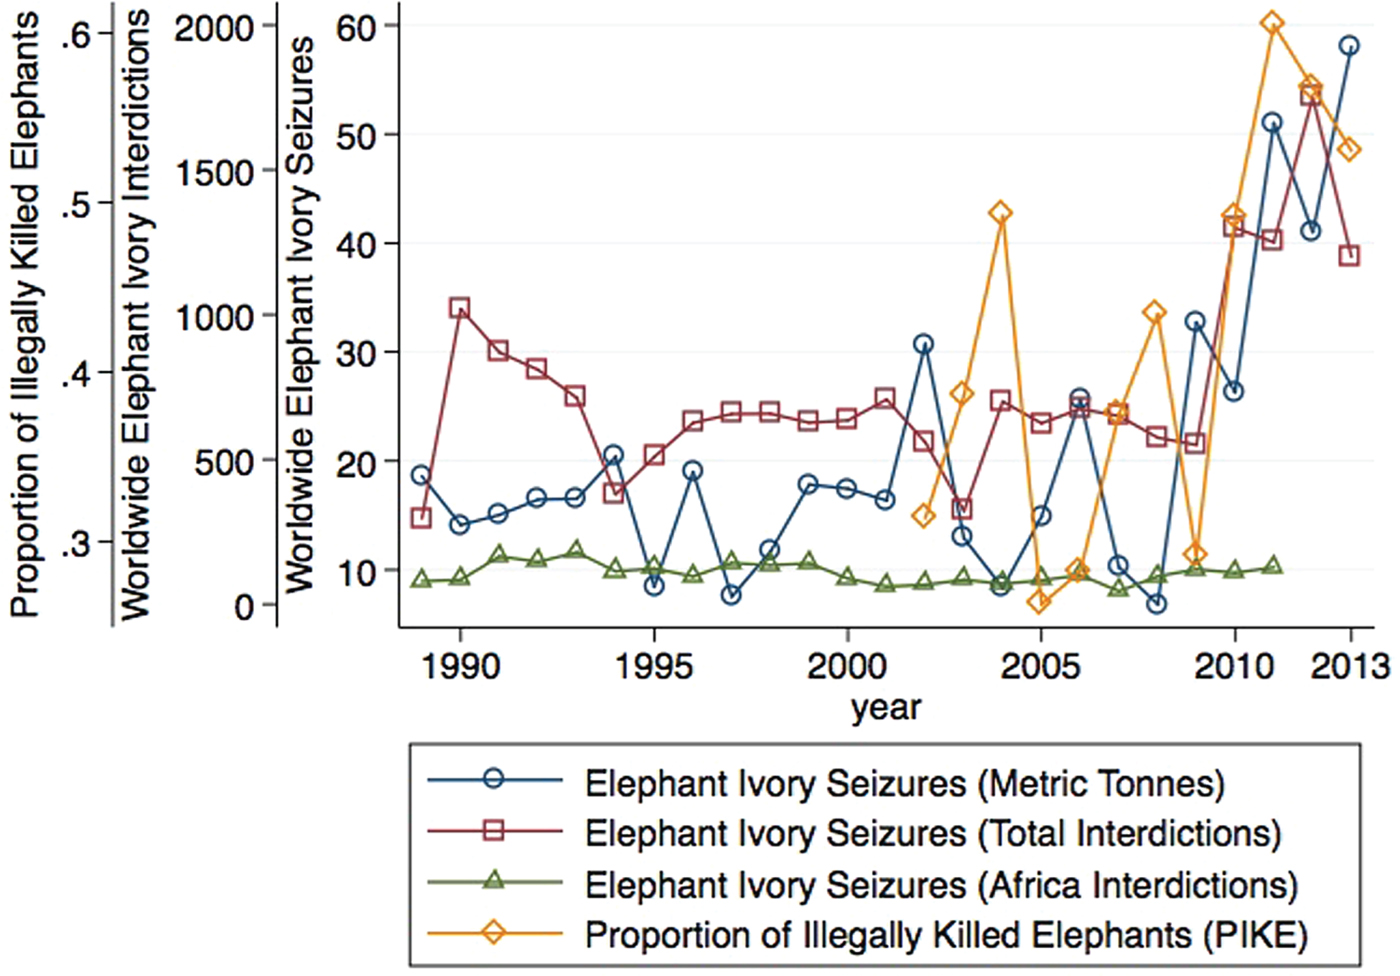
Figure 1. Elephant ivory seizures, number of interdictions, 1989–2013, and proportion of illegally killed elephants, 2002–2013.
Figure 2 shows estimates of the elephant population in Africa and the effective African range of elephants from surveys in 1995, 1998, 2002, 2006, and 2013. The elephant population estimates are given as ‘definite’ (i.e., directly observed) (circles), ‘probable’ (squares), ‘possible’ (diamond), and ‘speculative’ (triangles). All estimates show that the African elephant population was rising in the decade prior to 2007, but has been declining since.Footnote 9 Interestingly, the decade of unambiguously rising elephant population occurred in spite of a declining range. The line marked with an ‘x’ shows elephant range estimates relative to the range in 1995.Footnote 10

Figure 2. African elephant population and range estimates, 1995–2013.
Mammoth ivory, from the large woolly elephant relative which became extinct in the Holocene, has become an important source of ivory in the post-ban era. Mammoth ivory can be crafted in the same way as elephant ivory, competes with the elephant ivory-crafted artifacts and is demanded by ivory customers (Martin and Martin, Reference Martin and Martin2010). Nearly 50,000 mammoth carcasses have been excavated in the 250 years since Siberia became a part of Russia in the 17th century, though that trade had mostly vanished during the Soviet era, and a stock of around 10 million mammoth carcasses are thought to lie beneath the permafrost in the Arctic tundra (Lister and Bahn, Reference Lister and Bahn2007). This stock is exploited by the mammoth tusk hunters every summer. Although mammoth hunters are required to have permits from the Russian government to sell mammoth ivory, many mammoth hunters operate without a valid permit (Larmer, Reference Larmer2013); thus, mammoth ivory is an exhaustible resource exploited under conditions of open access.
In figure 3, the line marked with circles shows Russian mammoth ivory exports for the period 1988 to 2013. Russian mammoth ivory exports have been increasing, averaging approximately 17 tonnes per year for 1991–2000 and averaging 60 tonnes per year for 2001–2013.Footnote 11 Mammoth ivory trade declined by more than 50 per cent during the Great Recession, but has subsequently recovered. Also shown in figure 3 are the total mammoth ivory imports in Hong Kong, Macao, and China (squares).Footnote 12 Hong Kong, Macao, and China's combined average annual mammoth ivory imports account for over 95 per cent of total Russian exports.
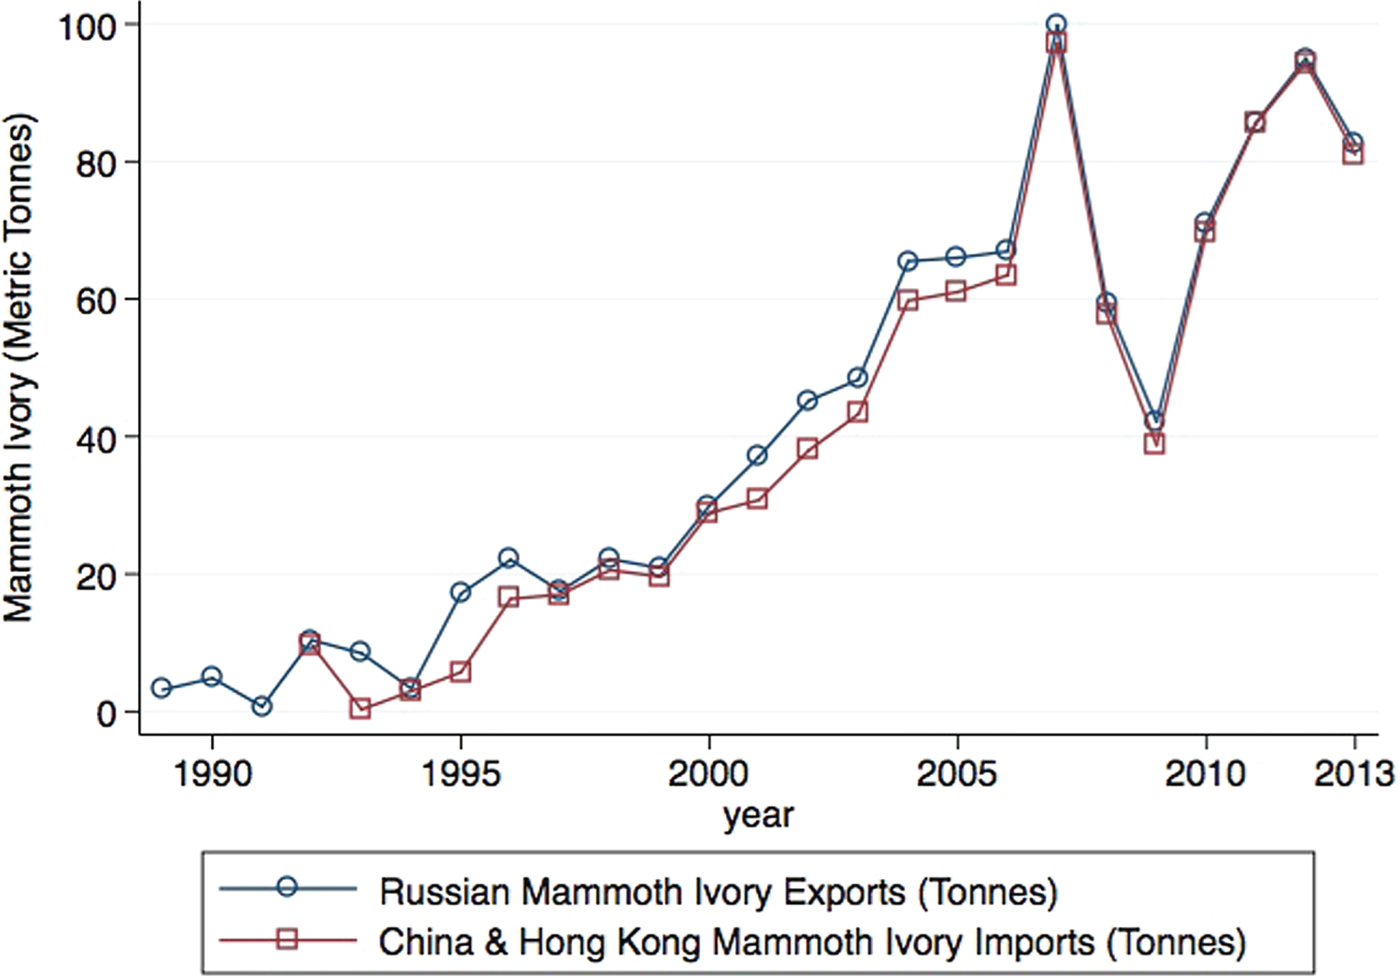
Figure 3. Russian mammoth ivory exports and Hong Kong plus China mammoth ivory imports, 1988–2013.
Figure 4 displays (nominal) elephant and mammoth ivory prices in dollars per kilogram, both pre- and post-ban, collected from several sources. The vertical line corresponds to the 1989 CITES ban on elephant ivory trade. Raw ivory prices (left-scale) pre-ban from Barbier et al. (Reference Barbier, Burgess, Swanson and Pearce1990) roughly doubled in the decade leading up to the ban on ivory trade. Post-ban raw prices are from UN COMTRADE, calculated from export data. These show that elephant ivory permitted trade prices were very high right after the ban, much lower in the mid 1990s, but started to rise again in the late 2000s. Permitted elephant ivory prices, however, are imputed from small quantities of sales. Mammoth ivory prices, which are based upon larger and more continuous quantities of sales, were very volatile until the mid 1990s, when they settled down to around $ 50 per kilogram. Like elephant ivory prices, mammoth ivory prices started to rise in the late 2000s, though both have fallen again at the end of the sample. A second source of data (right-scale) is the average wholesale price of worked elephant and mammoth ivory from market surveys collected from Martin (Reference Martin2006), Martin and Martin (Reference Martin and Martin2010, Reference Martin and Martin2011), Martin and Vigne (Reference Martin and Vigne2011) and Vigne and Martin (Reference Vigne and Martin2014) for the years 1987, 2002, 2004, 2006, 2009, 2010, and 2014. The worked ivory prices show a substantially larger increase post-2010 than do raw ivory prices for both mammoth and elephant ivory, suggesting an increase in the demand for workmanship by consumers.

Figure 4. Elephant and mammoth ivory prices.
An important implication of the variation in prices and production of mammoth and elephant ivory in the post-ban era is that mammoth and elephant ivory are imperfect but close substitutes, since both were being consumed in positive quantities even as prices varied. This implication is explored in the theoretical analysis.
Some elephant ivory trade has been permitted in the post-ban era. This includes hunting trophies, privately owned ivory crafts and raw ivory from elephants killed before the 1989 ban. CITES approved two major African elephant ivory auctions post-ban: in 1999, 50 tonnes of elephant ivory was auctioned to Japanese dealers at an average price of $ 103/kg, and in 2008, 101.8 tonnes of elephant ivory was auctioned at an average price of $ 157/kg, where Chinese dealers bought 62 tonnes and Japanese dealers bought the remainder (Stiles, Reference Stiles2004, Reference Stiles2009). Hsiang and Sekar (Reference Hsiang and Sekar2016) argue that increased poaching can be traced to the 2008 sale. Rising demand, as suggested both by rising Chinese incomes and by rising ivory prices, may have played a role in the increase in poaching. Furthermore, Moyle (Reference Moyle2014) attributes the increase in ivory trade to the convergence of lower shipping cost, interest rate declines, and rising instability in Africa.
3. Theoretical analysis
To motivate our empirical analysis and to provide an explanation of the stylized facts documented in section 2, we extend Kremer and Morcom's (Reference Kremer and Morcom2000) model of poaching with storage. We extend their model by considering (1) substitution between mammoth and elephant ivory, and (2) the effects of key demand and supply shifters.
Let h be the number of elephants poached, E be the stock of elephants, q be the number of mammoth tusks dug out of the tundra, M be the stock of remaining mammoth tusks, X be the stores of elephant ivory, p be the black market price of elephant ivory, m be the legal price of mammoth ivory, y be the income in the ivory demand region, I be the institutional quality in the elephant supply region, R be a supply shifter for Russian mammoth ivory, and r be the risk adjusted rate of return expected by those who store elephant ivory.
Letting  $\dot{z}\equiv {{\rm d}z}/{{\rm d}t}$ denote the time derivative of variable z, we follow Kremer and Morcom (Reference Kremer and Morcom2000) and express the equation of motion for elephants as
 $$\dot{E} + \dot{X} = G(E) - h,\quad E(0) = E_0>0,$$
where G(E) is the biological growth function, which has the properties that G(E) > 0 for 0 < E < K, G(E) < 0 for E > K, and that G(0) = G(K) = 0, for the carrying capacity, K, of elephants. Thus, the elephant population is measured in ivory units, so that elephants can be turned into stores, and stores into consumption, both at a 1:1 ratio.
The exhaustible mammoth ivory stock is reduced at the rate of extraction, q:
 $$\dot{M} = -q,\quad M(0) = M_0 > 0.$$
The demand and supply for illegal elephant ivory is
 $$h=D^{e}(p,m,y),\quad {\rm and}\quad h=S^{e}(p,E,I),$$
 where the superscript ‘e’ is for ‘elephants’ and where subscripts denote partial derivatives when a variable and time periods when a number. For demand it is assumed that  $D_{p}^{e}<0$ (the quantity demanded is decreasing in own price),
  $ D_{m}^{e}\geq 0$ (substitution effects are non-negative), and
  $D_{y}^{e}\geq 0$ (income effects are non-negative). For elephant poaching supply,
  $ S_{p}^{e}\geq 0$ (supply is possibly less than perfectly elastic),
  $ S_{E}^{e}>0$ (a larger elephant population yields higher poaching levels for a given price), and
  $S_{I}^{e}\leq 0$ (rising institutional quality lowers poaching for a given price) for supply. This is an open access supply curve, with no rents accruing to poachers.
Similarly, the demand and supply for mammoth ivory (superscript ‘m’ for ‘mammoth’) is given by
 $$q=D^{m}(m,p,y),\quad {\rm and}\quad q=S^{m}(m,R),$$
 where  $D_{m}^{m}<0$ (demand is decreasing in own-price),
  $D_{p}^{m}\geq 0$ (substitution effects are non-negative), and
  $D_{y}^{m}\geq 0$ (income effects are non-negative), and where
  $S_{m}^{m}\geq 0$ (supply may be less than perfectly elastic). Again, this supply curve reflects the open access supply curve, so there are no rents, except for infra-marginal producers’ surplus when the supply curve is less than perfectly elastic (i.e, when
  $ S_{m}^{m}>0$). The supply shifter R increases the quantity supplied at any price, so that
  $S_{R}^{m}>0$. The main candidate for the mammoth supply shifter R is that mammoth ivory is produced not just by ivory hunters specifically looking for ivory, but also by miners, road builders, and others who are digging in the tundra and who incidentally find mammoth ivory. We use this mammoth ivory shifter in the empirical section to help us identify the effects that mammoth ivory has had upon elephant poaching.
Kremer and Morcom (Reference Kremer and Morcom2000), in contrast, assume that  $D^{e}_{m} = D^{m}_{p}=D^{e}_{y}=D^{m}_{y}=S^{m}_{R}=S^{e}_{I}=0$ and that the supply curves S e and S m are perfectly elastic in own price, though their (inverse) elephant supply curve is shifted by the elephant population size, with p = c(E), where c ′(E) < 0. Extinction is possible in Kremer and Morcom because at price c(0), demand is still positive: h = D e(c(0)) > 0. We are making a similar assumption, though our notation does not allow such a simple statement of the extinction condition.
Kremer and Morcom (Reference Kremer and Morcom2000) identify three types of equilibrium ‘subpaths’ that may occur. These are the ‘poaching, no storage’ (PNS) subpath, where h > 0 and  $X=\dot{X}=0$, the ‘storage, no poaching’ (SNP) subpath, where h = 0, and
  $\dot{X}<0$ while X > 0, and the ‘poaching with storage’ (PWS) subpath, where h > 0 and X > 0. Each subpath may also exist here, though which are consistent with the observed trends is to be determined.
In either the SNP or PWS subpaths, where storage of elephant ivory occurs, the equilibrium elephant ivory price satisfies Hotelling's rule, so that those holding stores are indifferent between producing from their stores today or holding their stores for sale in the future,
 $$\dot{p}/p = r > 0.$$
In a PWS equilibrium, extinction of elephants eventually occurs. Let X E(E) denote the stores as a function of the elephant population along the PWS extinction path. X E(0) is the quantity of elephant ivory stores at the moment T E when elephants become extinct that can satisfy future demand for elephant ivory when price obeys Hotelling's rule given by (5),
 $$X_E(0) = \int\nolimits_{T_E}^\infty D^e(p_{T_E}e^{r(t-T_E)},m_t,y_t) \,{\rm d}t.$$
 The elephant ivory price is anchored by the poaching price  $p_{T_{E}}$, at the moment of extinction of elephants, implicitly defined by
  $0 = S^{e}\lpar p_{T_{E}}\comma \; 0\comma \; I_{T_{E}}\rpar $, so that the last elephant is poached. The price
  $ p_{T_{E}}$, and hence, X E(0), also depend upon the prevailing institutional quality
  $I_{T_{E}}$ at time T E, and X E(0) also depends upon the future income levels y τ, τ ≥ T E, and upon the mammoth stock at the moment elephants become extinct,
  $M_{T_{E}}$, since that affects the future mammoth ivory prices m τ, for τ ≥ T E. Observe that a decrease in the mammoth ivory price m causes demand for elephant ivory to fall, since
  $D^{e}_{m}>0$, so that X E(0) decreases as well.
Now, let us turn to an analysis of the subpaths.
3.1 The PNS subpath–simplest case
There are two poaching, no storage (PNS) equilibrium subpaths to consider. In the extinction PNS subpath, the harvest rate h is greater than the population growth rate G(E), so  $\dot{E}<0$. In the sustainable PNS subpath, h < G(E), so that
  $\dot{E}>0$. Both PNS subpaths have zero stores of elephant ivory
  $X=\dot{X} = 0$, and each has a positive elephant population E.
To gain intuition for the PNS subpaths, consider the case in which the mammoth ivory market affects the elephant ivory market, but not vice versa. Thus, the poaching equilibrium price p and output h is given by the pair of equations h = S e(p, E, I) and h = D e(p, m, y), where the elephant population E, the mammoth ivory production q, the mammoth ivory price m, demand region income y, and institutions I are parameters. Using Cramer's Rule, it follows that the poaching rate and the ivory price vary according to
 $${\rm d}h = \underbrace{{\displaystyle{{D_p^e S_E^e } \over {D_p^e -S_p^e }}}}_{{({\rm + })}}\;{\rm d}E + \underbrace{{\displaystyle{{D_p^e S_I^e } \over {D_p^e -S_p^e }}}}_{{({\rm - })}}\;{\rm d}I + \underbrace{{\displaystyle{{-S_p^e D_m^e } \over {D_p^e -S_p^e }}}}_{{({\rm + })}}\;{\rm d}m + \underbrace{{\displaystyle{{-S_p^e D_y^e } \over {D_p^e -S_p^e }}}}_{{({\rm + })}}\;{\rm d}y,$$
 $${\rm d}p = \underbrace{{\displaystyle{{S_E^e } \over {D_p^e -S_p^e }}}}_{{({\rm - })}}\;dE + \underbrace{{\displaystyle{{S_I^e } \over {D_p^e -S_p^e }}}}_{{({\rm + })}}\;{\rm d}I + \underbrace{{\displaystyle{{-D_m^e } \over {D_p^e -S_p^e }}}}_{{({\rm + })}}\;{\rm d}m + \underbrace{{\displaystyle{{-D_y^e } \over {D_p^e -S_p^e }}}}_{{({\rm + })}}\;{\rm d}y.$$
Thus, all else constant, the equilibrium poaching rate h is increasing in the stock of elephants E, the price of mammoth ivory m, and the demand region income y, and is decreasing in institutional quality I. The equilibrium poaching price p is decreasing in the stock of elephants E, but increasing in the mammoth ivory price m, the institutional quality I, and demand region income y. Both h and p are independent of the mammoth ivory production q, and supply conditions in Russia, except through how those affect the mammoth ivory price, m.
Hence, the implicit solution to the open access poaching level h*(E) ≡ h(E; I, m, y) is increasing in E, so that for h*(0) > G(0) and h*(E) < G(E) for some E > 0, h*(E) will intersect G(E) at least twice, e.g., at 0 < E u* < E s* < K, with E s* stable and E u* unstable.Footnote 13 To see the stability, note that if E < E u* or E > E s*, then h*(E) > G(E) so that  $\dot{E}<0$, while if E u* < E < E s*, then G(E) > h*(E) so that
  $\dot{E}>0$. Thus, below E u*, extinction occurs, and above E u*, the poaching equilibrium approaches the steady-state, E s*. Let h ∞(E) ≡ lim m→∞h(E; I, m, y) denote the equilibrium elephant ivory demand when mammoth ivory production is prohibitively expensive. It follows from (7) that h ∞(E) > h*(E) for all E. These harvest rates are shown in figure 5. Note that
  $0<E_{u}^{\ast}<E_{u}^{\infty }<E_{s}^{\infty } E_{s}^{\ast}<K$.

Figure 5. Poaching-No Storage population dynamics, with and without a substitute.
Two conclusions immediately follow. First, the coincidental timing of the CITES ban on elephant ivory trade in 1989 and the collapse of the Soviet Union in 1991–1992 resulted in two separate causal effects. The CITES ban raised institutional quality I by increasing international pressure on poaching. By (7) and (8), this lowered the poaching rate h and increased the poaching price p. The collapse of the Soviet Union, however, lowered the cost of mammoth ivory m, which lowers both the poaching rate h (the shift from h ∞(E) to h*(E) in figure 5) and the poaching ivory price p (due to substitution effects). Thus, the falling elephant ivory prices in the early 1990s were an artifact of the fall in mammoth ivory prices, not the increase in international pressure on poaching (whose effect would be to raise, not lower, elephant ivory prices), though both effects cause poaching to decrease. This effect upon ivory prices occurred in spite of only a small quantity of mammoth ivory reaching the market in the early years of the ban.Footnote 14
Second, at the pre-ban poaching rate, h ∞(E), for the population of elephants to be falling requires that E is below its unstable equilibrium,  $E_{u}^{\infty}$. But with mammoth ivory becoming available, at the harvest rate h*(E), the new unstable population level E u* was below the current population level, E. This would account for the recovery of the elephant population observed in the two decades following the ban. Since the elephant population at the time of the ban was about 600,000 elephants, and was falling, and since the ‘probable’ elephant population in 1995 was 386,000, and was rising, we conclude that
  $E_{u}^{\infty } > 600\comma \; 000$ elephants and that E u* < 386, 000 elephants.
3.2 The sustainable PNS subpath
Now consider what happens when prices and quantities in both markets simultaneously clear. In that case, in addition to the poaching market conditions, the PNS equilibrium also has the equivalent conditions in the mammoth ivory market, along with the equations of motion for the stocks:
 $$\eqalign{h = S^e(p,E,I) = D^e(p,m,y)\,\,\,q &= S^m(m,R) = D^m(m,p,y) \cr & X = \dot{X} = 0,\,\,\,\dot{E} = G(E)-h\,\,\,{\rm and}\,\,\,\dot{M} = -q.}$$
 Let us determine whether the sustainable PNS equilibrium is capable of explaining the first two decades of the ban. Consider what happens when  $ \dot{E}>0$ and
  $\dot{R}$ is greater than zero. The equilibrium when only the causal effects are the increase in the population of elephants and the increase in Russian mineral production is shown in figure 6, which is drawn with inverse supply and demand curves labelled D̂ and Ŝ respectively, with price as a function of quantity, to distinguish them from the demand and supply curves used in the text, in which quantity is written as a function of price. The direct effects are that an increase in the population of elephants E shifts the (inverse) elephant poaching supply curve down to
  $\hat{S}_{1}^{e}$ from
  $\hat{S}_{0}^{e}$ because the cost of poaching drops as the elephant population increases, and an increase in Russian mining activity R shifts the mammoth supply down to
  $\hat{S} _{1}^{m}$ from
  $\hat{S}_{0}^{m}$ because more mammoth are found incidentally to mining. These direct effects cause both ivory prices to fall, since the supply shifts move to lower price levels on the demand curves. The indirect effect is that as both commodities’ prices fall, the demand for each type of ivory falls because now its substitute has become cheaper. Thus, in equilibrium, both ivory prices fall, and for a similar magnitude shifts in demand and supply in elephant ivory, the elephant poaching stays about the same, and when the shift in mammoth ivory supply is greater than the shift in mammoth ivory demand, mammoth ivory production rises.Footnote 15 Thus:
Proposition 1.
With an increase in the elephant population due to being in the sustainable PNS equilibrium, and with a shift in mammoth ivory supply as the Russian mining industry expands, all of the pre-2007 stylized facts can be explained: poaching is falling, the elephant population rises, prices of both ivory fall, and mammoth ivory production rises.
Proof: See the online appendix.□
This shows both that the PNS sustainable equilibrium is consistent with the pre-2007 stylized facts, and that the increasing supply of mammoth ivory is a necessary part of that explanation.

Figure 6. The sustainable PNS equilibrium. a. Elephants. b. Mammoths.
3.3 The poaching with storage subpath, PWS
In the PWS subpath, the equilibrium elephant ivory price obeys the storage condition (5), supply and demand for mammoth ivory are given by (4), respectively, and net additions to stores defined by (1):
 $$\dot{p}=rp,\quad q=S^{m}(m,R)=D^{m}(m,p,y),\quad {\rm and}\quad \dot{X}+ \dot{E}=G(E)-h,$$
and the supply and demand for elephant ivory satisfying
 $$\matrix{ {\left\{ {\matrix{ {h = S^e(p,E,I)\quad {\rm \&\ }\quad h{\rm +\ }s{\rm =\ }D^e(p,m,y)} \cr {h{\rm =\ }D^e(p,m,y)\quad {\rm \&\ }\quad h{\rm +\ }s{\rm =\ }S^e(p,E,I)} \cr } } \right\}} & {{\rm as}\quad \dot{X}{\rm =\ }\left\{ {\matrix{ {{\rm -\ }s < } \cr {s > } \cr } } \right\}{\rm 0}.} \cr }$$
 Kremer and Morcom (Reference Kremer and Morcom2000) show that the PWS extinction path is the locus X = X E(E) which approaches the extinction stores level X E(0) as elephants become extinct.Footnote 16 Since  $\dot{E}<0$ along this locus,Footnote 17
  $ {\rm d}X/{\rm d}E = X_{E}^{\prime }\lpar E\rpar =\dot{X}/\dot{E}$, which implies that
  $\dot{X}<0$ occurs for E < Ẽ u and for E > Ẽ s. In addition, during a cull, the PWS extinction path X E(E) can be approached by killing elephants and turning them into stores at rate dX/dE = −1. The important implication is that either along the extinction path X E(E) or during a cull, the elephant population is decreasing. Stores, however, may be either increasing or decreasing. Furthermore, along either X E(E) or during a cull, the price of elephant ivory p must be rising at the rate of interest. An example of the PWS equilibrium in stores-elephants space, including the shaded area where getting to the locus X = X E(E) is made possible by a cull, is shown in figure 7.

Figure 7. The population and stores dynamics in the PWS equilibrium.
Do there exist conditions under which the PWS equilibrium reproduces the stylized facts observed post-2007? Post-2007, the overall African elephant population was falling, poaching and interdictions were rising, and both ivory prices were rising. The fall in the elephant population shifts the supply so that fewer elephants are poached for a given price. Suppose, as shown in figure 8, that initially the elephant poaching price is at p 0, where given demand  $\hat{D}_{0}^{e}$, demand for elephant ivory is h 0, but given supply
  $\hat{S}_{0}^{e}$ elephants are being poached at rate h 0 + s 0, with s 0 being added to stores. This corresponds to an elephant population E 0 in figure 7 such that
  $\tilde{E}_{u}<E_{0}<\hat{E}$, where stores are increasing and the population of elephants is decreasing. Once the elephant population is reduced to Ẽ u, net additions to stores are zero, so that at the corresponding price p 1, the new supply
  $\hat{S}_{1}^{e}$ and demand
  $ \hat{D}_{1}^{e}$ intersect at poaching level h 1 with s 1 = 0. Further reductions in the elephant stock drive
  $E_{2}<\tilde{E}_{u}$. This shifts the supply to
  $\hat{S}_{2}^{e}$, and given demand
  $\hat{D}_{2}^{e}$, the price p 2 satisfying the poaching condition results in poaching of h 2, and total demand equal to h 2 + s 2, so that some demand is satisfied from stores.Footnote 18

Figure 8. The PWS equilibria. a. Elephants. c. Mammoths.
Therefore, during this sequence all of the elephant poaching indicators satisfy the post-2007 stylized facts. But this means that the demand for elephant ivory must have been shifting faster than the supply of elephant ivory to be in this equilibrium. There are two things that can cause that: increases in income, and increases in the price of the mammoth ivory substitute. Since continued increases in the mining industry in Russia cause the mammoth ivory supply curve to shift so that a greater mammoth ivory is supplied at a given price, then for both mammoth ivory production and the mammoth ivory price to rise, it must be that the demand for mammoth ivory is shifting outwards faster than the supply of mammoth ivory.
The next proposition shows that the first part of the PWS subpath, where stores are being accumulated,  $\dot{X}>0$, is consistent with the post-2007 era observations that both ivory outputs and both ivory prices are rising, but the elephant population is falling.Footnote 19
Proposition 2.
In the post-2007 era, elephant poaching and interdictions, s + h, and mammoth ivory output, q, have been rising, prices of both types of ivory, elephant, p, and mammoth, m, have been rising, and the elephant population, E, has been falling. This is consistent with the PWS equilibrium where  $\dot{X}>0$ as long as (1) the effects of higher illegal elephant ivory price increases dominate the effect of lower elephant population, and (2) demand side price and income effects dominate supply side effects in both Russian and African markets.
Proof: See the online appendix.□
An equilibrium which is consistent with the stylized facts is thus the line sequence A to B in figure 7. In this equilibrium, pre-2007 is in the poaching, no storage equilibrium, starting from an elephant population greater than E u* and therefore increasing, moving to the right along line segment A. Along this segment, the elephant population is rising. Increasing activity in Russian mining contributed to rising mammoth ivory production, which causes both elephant and mammoth ivory prices to fall, and held poaching somewhat in check. But by 2007, the elephant population had risen to the point where it intersects the locus X E(Ê) at point Ê. Since the biological population in 2006 was estimated to be 628,000 elephants (according to the ‘probable’ estimate), this places Ê somewhere above 628, 000 animals. Thereafter, the equilibrium is on the poaching with storage equilibrium path X E(E), along the segment denoted B. For this equilibrium to be possible, two things must occur. First, the locus X E*(E) associated with the harvest level h*(E) when price m is finite must have shifted down enough that at Ê stores be zero,  $X_{E}^{\ast }\lpar \hat{E}\rpar =0$. This is possible, since we know that demand for elephant ivory would fall once mammoth ivory becomes available. Second, Ê must occur to the left of the cull line associated with X E*(0). We cannot say much about whether this is true or not, except to note that if it is a cull that is occurring, it is a slow motion cull, at least relative to the destruction of the American bison, which with comparable sized herds, was driven nearly to extinction in less than a decade (Taylor, Reference Taylor2011). Then post-2007, the elephant population is falling, stores are rising, and prices are rising both to compensate holders of stores and because the elephant population is falling, making poaching more expensive.
In the online appendix we show that the extinction PNS equilibrium is also consistent with rising ivory prices and with a falling elephant population observed in the post-2007 period, and that the SNP equilibrium is inconsistent with both the pre-2007 period and with the post-2007 period.
3.4 Implications from the theory
In our empirical work which follows, we make use of the insights from these equilibria. The first insight from the theory is that the mammoth ivory supply shifter of Russian mining industry revenue affects mammoth ivory production directly, and then affects elephant ivory production and prices through changes in mammoth ivory production. Second, we see that the post-2007 stylized facts require controlling for demand effects. Thus, we include both China's income and CITES permitted elephant ivory sales as demand shifters. In addition, we control for institutional quality in Africa. These are described in more detail in the next section.
4. Empirical analysis
Now we turn to an empirical analysis of the effect that mammoth ivory production has had upon African elephant ivory poaching. We first describe the methodology as it is applied to the worldwide tonnage of elephant ivory seizures and to the implied prices of legally traded elephant ivory. Then we present the results, first for the time series of elephant ivory seizures and prices, and then for a panel of the ETIS number of elephant ivory interdictions by country for the world.
4.1 Methodology
The effect Russian mammoth ivory exports have had upon worldwide elephant ivory seizures and permitted sales prices of elephant ivory is estimated by the following regressions:
 $$\eqalign{{\rm Dependent\ Variabl}{\rm e}_t = & \alpha _0 + \alpha _1 {\rm Russian\ Mammoth\ Ivory\ Export}{\rm s}_t \cr & + \alpha _2 {\rm Institutional\ Qualit}{\rm y}_t + \alpha _3 {\rm China\ Per\ Capita\ GD}{\rm P}_t \cr & + \alpha _4 {\rm CITES\ Permitted\ Sale}{\rm s}_t + \alpha _5t + \varepsilon _t,\quad t = 1989, \ldots ,2013,}$$
where the dependent variables are the total tonnage of elephant ivory seizures or the imputed price of CITES permitted trades. Each regression includes as explanatory variables Russian mammoth ivory exports (the variable of interest), measures of institutional quality in the African countries (supply shifters), China GDP per capita (demand shifters), the tonnage of CITES approved sales in African elephant ivory, and a time trend.
The tonnage of Russian mammoth ivory exports is the key variable of interest. But because mammoth and elephant ivory are substitutes, elephant ivory harvests and prices may also affect mammoth ivory exports, generating the potential for reverse causality. To deal with this problem we use an instrumental variable approach.
The instrument we use is motivated by three points. In an interview, Canada Fossils president Pierre Parré, noted that ‘the global mining boom\ldots is feeding the mammoth boom’ (Evans, Reference Evans2010), and that ivory prices were inversely correlated with the gold price (personal communication with Mr. Parré, 30 May 2014). As miners search for gold and other minerals in the Russian Arctic, they may incidentally discover mammoth tusks, thereby increasing Russian mammoth ivory exports. Second, the sparcely populated Yakutiya region of Russia, where mammoth ivory tusks are found, is principally a mining region (Larmer, Reference Larmer2013). Third, our theoretical model suggests that while a mammoth supply shifter may affect the ivory market, it does so by its affect upon the mammoth ivory market. Therefore, we use as our instrument the value of Russian mineral rents (excluding energy).Footnote 20
Figure 9 shows how Russian mammoth ivory exports correlate with the Russian mineral rents and with gold prices. Russian mammoth ivory exports are highly correlated with Russian mineral rents ( r = 0.89) though less so with gold prices (r = 0.59). Russian mineral rents correlate with the rise in Russian mammoth ivory exports 1990–2007, the fall in exports in 2008 and 2009, and the subsequent rise in exports post 2008. Furthermore, Russian mineral rents are only weakly correlated with African elephant ivory interdictions (r = 0.47) and with elephant ivory prices ( r = 0.03),Footnote 21 suggesting that it satisfies all of the requirements of an instrumental variable.

Figure 9. Russian mammoth ivory exports, and the instruments, Russian mineral rents, 1989–2014.
Now, let us turn to the control variables. Martin et al. (2006, 2010) identify the rise in China's GDP per capita as a contributor to the continued poaching of elephants. We noted in figure 3 that over 95 per cent of mammoth ivory exports have gone to China and to Hong Kong, indicating that this is the market where mammoth and elephant ivory interact.
We also control for institutional quality in Africa, since that is where the poaching occurs and from where most flows of ivory begin. The ‘Polity II’ index is the African mean level of a democracy index.Footnote 22 More democratic countries may have higher institutional quality. This index has been rising. A second measure is the World Bank's ‘Rule of Law’ Index, which is only available from 1996 forward.Footnote 23 The Rule of Law Index African average was rising in the beginning of the sample, but has lately been falling. A third measure of institutional quality is expenditures on public order as a percentage of GDP. This data, from IMF statistics on government expenditures, is a direct measure of enforcement, but it is available for only a sample of countries within each year.Footnote 24 The African mean of expenditures on public order measure has been increasing throughout the sample. The final measure of institutional quality is a Conflict Index, which aggregates data on assassinations, coups, revolutions, riots, purges, general strikes, government crises and anti-government demonstrations. The African mean for this index has risen dramatically since 2007.Footnote 25
We include CITES data on permitted sales of elephant ivory to control for possible effects from the sales in 1999 and 2008, and we include a time trend variable to capture other temporal effects not otherwise measured.
Several variables, however, could not be included in the aggregate seizures and ivory price regressions. These include the elephant population and range variables, which are only available for a few years (1995, 1998, 2002, 2007 and 2013). Similarly, the Martin price survey data is only available for the years 1987, 2002, 2004, 2006, 2009, 2010 and 2014. The MIKE survey data in illegal kills of elephants, which is only available 2002–2013, is not included in the time-series analysis, but it and the number of interdictions by country, only available 1989–2010, are examined separately in the panel estimations.
In the panel estimations, the institutional quality variables are country-specific. In the time-series price and seizures regressions, these are the simple averages over all African countries.
Now, let us turn to the econometric results.
4.2 Instrumental variable estimation results
Since the instrumental variable first-stage regression (of Russian mammoth ivory exports on Russian mineral rents) is the same for both the worldwide elephant ivory seizures and for the elephant ivory price regressions, we begin by showing the results from that first-stage regression.
The first-stage regressions for the IV model are reported in table 1. Since theory does not guide us as to which institutional quality variables should be included, we report seven specifications for each dependent variable. All specifications include Russian mammoth ivory exports, the demand shifter China GDP per capita, institutional quality measure Polity II, and a linear time trend. Column (1) contains just these three variables; column (2) adds the Rule of Law Index and column (3) includes instead the Conflict Index. Column (4) adds the tonnage of CITES permitted elephant ivory sales to column (3) controls. Columns (5)–(7) repeat columns (2)–(4) but adding Expenditures on Public Order.
Table 1. Time series first-stage instrumental variable regression results
Notes: Dependent variable: Russian Mammoth Ivory Exports (tonnes). Robust Standard Errors in parentheses. Significance levels: ***p < 0.01, **p < 0.05, *p < 0.1 Units: a Billions of 2005 US$. b Thousands of 2005 U.S. Dollars. c African mean. d Tonnes. ePercent of GDP.
The coefficient on Russian mineral rents is positive in each specification and is statistically significant in four of the seven regressions. A billion dollar increase in Russian mineral rents is associated with an increase of two to four tonnes in Russian mammoth ivory exports. The instrument is weak in the sense that the partial F statistic for the instrument is less than 10 in value in every regression.
It is interesting that China GDP per capita is negative in every specification (though statistically significant only in model (3)), suggesting that mammoth ivory may be an inferior good. The time trend is positive and significant in all but model (2). Except for the Polity II index, the African institutional variables are mostly insignificant. The permitted ivory trade is negative (and significant in model (7)), suggesting that part of the decline in mammoth exports in 2008–09 may have been due to the large sale of African elephant ivory in 2008. Overall, about 90 per cent of the variation in mammoth ivory exports is explained by these variables in the time series.
4.3 Elephant ivory seizures estimation results
Now, let us consider the effect Russian mammoth ivory exports may have had upon seizures of elephant ivory. We estimate this effect using instrumental variable estimation regressions of elephant ivory seizures on Russian mammoth ivory exports.
The instrumental variable results reported in table 2 use Russian mineral rents to instrument Russian mammoth ivory exports. All specifications show that an increase in Russian mammoth ivory exports reduce African elephant ivory seizures. The estimated coefficients of Russian mammoth ivory are statistically significant in all specifications. One tonne of Russian mammoth ivory exports causes elephant ivory seizures to decrease by between 0.4 and 1.1 tonnes.
Table 2. Worldwide elephant ivory seizures, instrumental regression results, 1989–2013

Notes: Dependent variable: Worldwide Elephant Ivory Seizures (tonnes). Instrumental variable regression estimates. Newey-West standard errors in parentheses. Significance levels: ***p < 0.01, **p < 0.05, *p < 0.1. Units: a Tonnes. b Thousands of 2005 US$. c African mean. d Percent of GDP.
Chinese GDP per capita is positively correlated with elephant ivory seizures, and statistically significant in five of the seven specifications with an increase of US$ 1000 of Chinese per capita income resulting in a 6 to 20 tonne increase in elephant ivory seizures, depending upon the specification. Together with the result in table 1, these suggest that as the Chinese become richer, they demand more elephant ivory and less mammoth ivory.
The estimated coefficient of Polity II is positive in sign and statistically significant in columns (2), (4), and (5). The Rule of Law variable in column (2) is negative in sign but is not statistically different from zero. The Conflict Index is positive in sign but is not statistically different from zero. Expenditures on Public Order and Safety is positive in sign and statistically significant in column (7). The CITES Elephant Ivory Sales variable is negative in sign and statistically significant in column (7) indicating that one tonne of permitted sales reduced elephant ivory interdictions by as much as 0.17 tonnes. The time trend variable is statistically insignificant in all specifications.
4.4 Imputed elephant ivory price estimation results
Next, we turn to the regressions on imputed permitted elephant ivory trade prices. Table 3 presents the instrumental variables results for the post-ban elephant ivory permitted trade price regressions.
Table 3. Permitted elephant ivory price, instrumental variable regression results, 1989–2013

Notes: Dependent variable: Legally traded elephant ivory prices (nominal U.S. dollars per kilogram). Instrumental variable regression estimates. Newey-West standard errors in parentheses. Significance levels: ***p < 0.01, **p < 0.05, *p < 0.1. Units: a Tonnes. b Thousands of 2005 U.S. Dollars. c African mean. d Percent of GDP.
The effect of Russian mammoth ivory is estimated to be negative in all specifications (except columns (1) and (5)) and is statistically significant in columns (3), (6) and (7). Thus, for each tonne of Russian mammoth ivory exports, we find that the price of elephant ivory decreases by about $ 1.50 per kilogram. At the mean rate of 84 tonnes of mammoth ivory per year observed 2010–12, this implies that elephant ivory permitted trade prices would be between $ 118–134 per kilogram higher had mammoth ivory not been available, or about double current prices. This is broadly supportive of the hypothesis that mammoth ivory production has reduced the incentive for poaching of elephants, and identifies the mechanism as being the reduction in the price poachers may expect.
Other notable results are that the effect of China GDP per capita is positive in all specifications except in column (5). This is consistent with demand from China driving the market, with elephant ivory prices rising by $ 10–45 for each $ 1,000 increase in Chinese GDP per capita.
The Conflict Index is negative and statistically significant in all specifications, suggesting that reductions in institutional quality in African result in lower elephant ivory prices. However, the Polity II index is also negative (and significant in some specifications), which is surprising since it was associated with higher interdictions in table 2. Neither Rule of Law nor Expenditures on Public Order are statistically significant in any specification. Finally, the CITES Elephant Ivory Sales variable flips signs in the two specifications but is not statistically different from zero in either.
4.5 Panel data estimation results
Because the results just reported are based on a sample of only 25 years of aggregated data, we turn now to an analysis of the effect of Russian mammoth ivory exports using a more detailed panel data set on interdictions of illegal elephant ivory. This panel has the advantage that it utilizes interdictions from 106 countries. It has the disadvantages that both the main variable of interest, Russian mammoth ivory exports, and the instrumental variable, Russian mineral rents, vary only across time, not across countries, and that elephant ivory interdictions data is available only until 2010.Footnote 26 In each panel estimation, we use the same specifications as in (12), although the models are estimated using a panel fixed-effects (by countries) instrumental variables estimator, with errors clustered by countries.
Table 4 reports the instrumental variables panel fixed-effects regression results for the number of elephant ivory interdictions, using data from all countries for which interdictions have been reported in the ETIS data between 1989 and 2010. All specifications show that an increase in Russian mammoth ivory exports decreases the number of elephant ivory interdictions, with all coefficients statistically significant in all but columns (2) and (5). Other results include positive and significant effects on the number of interdictions from increases in China GDP per capita, positive and significant effects from an increase in the Polity II Index, and negative and significant effects from the CITES permitted African elephant ivory sales. The difference in the Polity II Index relative to the other panels is likely due to the fact that this panel includes many developed countries, where as the other two panels only include the lesser developed African and Asian countries. The first-stage results of these panel estimates are reported in the online appendix. Also reported there are estimates using only African countries. These estimates are qualitatively similar to those in table 4.
Table 4. Number of elephant ivory interdictions by country, by year, panel fixed-effects instrumental variable regression results, 1989–2010

Notes: Dependent variable: log(Number of elephant ivory interdictions+1) by country, by year. Fixed-effects Instrumental Variables Panel Regression. Standard errors (clustered by Country) in parentheses. Significance levels: ***p < 0.01, **p < 0.05, *p < 0.1. Units: a Tonnes. b Thousands of 2005 US$. c Country-Specific. d Percent of GDP.
In the online appendix, we report a panel on interdictions only in African countries, and two additional panels using data from the MIKE carcass surveys. Thes MIKE data, however, is only available from 2002 forward, and is based upon surveys of varying quality.
5. Effect of mammoth ivory on poaching
Finally, we use our estimates to determine the effect that mammoth ivory has had upon elephant poaching. Our approach is to take the estimate of Wittemyer et al. (Reference Wittemyer, Northrup, Blanc, Douglas-Hamilton, Omondi and Burnham2014), that on average 33,600 elephants were illegally poached every year between 2010 and 2012, and to compare that with the counterfactual of the change in the number of elephants that would have been poached had there been no mammoth ivory exports from Russia.
For the seizures time series, where the econometric model was of the form Y = a + bM, with Y the dependent variable and M mammoth ivory, and where a represents the mean estimated effect of all other exogenous causes, and b the estimated effect of one tonne of mammoth ivory upon Y, the marginal effect is dY = bdM. To get the change in the number of animals poached, we multiply dY by  $33\comma \; 360/\bar{Y}$, where
  $\bar{Y}$ is the mean of the dependent variable over 2010–2012. For the interdictions panel where the estimation was of the form ln(Y + 1) = a + bM, the marginal effect upon the dependent variable was calculated as
  ${\rm d}Y=be^{a+bM}{\rm d}M = b\lpar \bar{Y}+1\rpar {\rm d}M$. The resulting estimates are presented in table 5, with each column corresponding to the regression coefficient from columns (1)–(7) of the models reported in tables 2 and 4, respectively.Footnote 27
The implied change in number of elephants poached per year for the time series estimates from table 2 (row 1) show that the 83.9 tonnes of mammoth ivory exports per year reduced poaching by 29,000–85,000 elephants, depending upon the specification. On average the time series point estimates imply each year that 54,927 fewer elephants were poached because of the Russian mammoth ivory exports. Row 2 shows the estimates on the change in number of elephants poached from the panel on interdictions by country from table 4. These estimates range from an additional 6,600 elephants poached per year (column (2)) to 29,100 fewer elephants poached (column (7)), with a mean of 14,700 fewer elephants poached. Thus, the seizures time-series (row 1) show mean reductions in poaching, which if absent, would have more than doubled current poaching rates. The interdictions panel estimates (row 2) mean reductions in poaching, which if absent, would have increased poaching by about 50 per cent.
Table 5. Implied effect of mammoth ivory on the number of poached African elephants

Notes: The numbers represent the regression model estimate of the change in the number of elephants poached per annum 2010–2012, relative to the counterfactual of having had no mammoth ivory exports from Russia. A negative number implies that mammoth ivory reduced elephant poaching; a positive number implies that mammoth ivory increased elephant poaching.
Thus, the presence of mammoth ivory substitute may have had a sizeable positive effect upon reducing the number of elephants poached. Absent these effects, the situation concerning elephants would certainly be much more dire. It should not be a surprise that the development of a market in mammoth ivory could yield large effects upon elephant poaching, since a $ 100 per kilogram reduction in the legal price corresponds to a reduction in around $ 1,000 per animal poached.
6. Discussion and conclusions
This paper studies the effect that Russian exports of mammoth ivory has had upon the poaching of African elephants. The CITES ban on elephant ivory trade initially showed an increasing elephant population and falling ivory prices, but over the past decade has seen falling elephant populations, rising poaching, rising interdictions of illegal elephant ivory and rising ivory prices. Our theory shows that the early successes were due in part to the presence of reduced costs of producing the mammoth ivory substitute. We also show that the subsequent rise in poaching is due to rising Chinese demand.
Our empirical analysis of worldwide elephant ivory seizures finds that at the current production levels of over 80 tonnes of Russian mammoth ivory exports per year, mammoth ivory production may have reduced poaching by as many as 55,000 African elephants per year. Our empirical analysis based on panels of observed illegal kills and numbers of interdictions of illegal elephant ivory finds a reduction of between 15,000 and 35,000 in the number of elephants being poached per year. At current poaching rates of 34,000 elephants per year, these estimates imply that absent the mammoth ivory trade, the poaching could increase by between 50–200 per cent, which would endanger elephants. We also find that absent mammoth ivory exports, raw elephant ivory prices would be nearly double their current rates, which is likely the mechanism behind the reductions in poaching.
Supplementary material
The supplementary material for this article can be found at https://doi.org/10.1017/S1355770X18000554.
Acknowledgements
We have benefited from comments by Edward Barbier, Julian Blanc, Christopher Costello, Herb Emery, Logan Ferree, Esmond Martin, Lucija Muehlenbachs, Horatiu A. Rus, Trevor Tombe, Lucy Vigne; two anonymous referees, an associate editor, and the editor of the journal; as well as from seminar participants at the University of Calgary, the 2014 Canadian Resource and Environmental Economics Annual Conference, the 2015 Canadian Economic Association Annual Conference, the 2015 DICE-ITC Wildlife Trade Conference, the 2015 Southern Economic Association Annual Meeting, and the 2016 American Economic Association Annual Meeting. All errors are our own.


