


Social media is a group of Internet-based applications that builds on the foundation of web 2.0 and that allows the creation and exchange of user-generated content.Reference Kaplan and Haenlein 1 In 2012, a survey by the Pew Research Center’s Internet & American Life Project showed that 67% of Internet users use social networking sites and that women are more likely to use social media than men.Reference Duggan and Brenner 2 The user demographics suggest that most users of social media are under 50, and the majority are aged between 18 and 29 years. Those who live in urban areas are more likely than rural people to use social media.
The role of social media or web-based surveillance in disaster preparedness and response in large populationsReference Arnold 3 , Reference Bradt, Abraham and Franks 4 is now regarded as an important area of research and practice, which could transform disaster response worldwide.Reference Coiera 5 - Reference Merchant, Elmer and Lurie 8 Crowd-sourcing through social media has potential for accessing locally situated information from the public in support of public health emergency preparedness and response.Reference Merchant, Elmer and Lurie 8 A study of the adoption and use of social media among state public health departments suggested that the use of social media by state health departments is 60% (n=30), whereas 87% had a Twitter (Twitter, San Francisco, CA) account, 56% had Facebook (Facebook, Menlo Park, CA), and 43% had been using YouTube (YouTube, San Bruno, CA) to promote health behaviors.Reference Thackeray, Neiger, Smith and Van Wagenen 9 For example, the Twitter network was instrumental in providing information to the public about the availability in specific locations of vaccine against H1N1 during the 2009 influenza pandemic in Virginia.Reference Merchant, Elmer and Lurie 8 Similarly, during the 1995 Chicago heat waves, a web-based buddy system allowed at-risk people to receive medical attention and social services in a timely manner.Reference Semenza, Rubin and Falter 10 As the world’s most populous country, China faces particular challenges in dealing with emerging epidemic outbreaks in a sufficiently timely manner to safeguard the population from the deadliest local and global threats.
Ebola virus disease (EVD) is a life-threatening disease transmitted via blood or body fluids from infected patients or contaminated equipment. The outbreak of EVD began in Guinea in March 2014 and developed strong foci in Guinea, Sierra Leone, and Liberia. The disease spread rapidly, affecting many countries in West Africa. According to the World Health Organization (WHO), as of December 7, 2014, 6388 people of the 17,942 confirmed infections had died in 7 countries around the world. This was by far the deadliest outbreak of EVD to date and aroused serious concern for imported infections in China as the number of annual arrivals from Africa and Chinese employees for cooperation projects in Africa is significant. On July 30, 2014, a Hong Kong woman returning from Kenya exhibited symptoms that were similar to EVD, and this suddenly focused the attention of the government and citizens of China who, up to that point, had regarded EVD as a distant threat.
In this study, we quantified the Chinese public’s response to the African Ebola epidemic by analyzing relevant data from Weibo (Weibo Corp, Beijing, China), which is the most popular social media platform in China with over 100 million daily posts. The content of posts that relate to EVD is an important real-time barometer of public attitudes to an emerging crisis, and the capacity to follow the evolution of these attitudes over time is unique. Depending on the outcome of such analyses, the results can provide information on public attitudes, the quality of information being shared, and the span of public attention. Perhaps most importantly, the results may provide key insights into how best to ensure the public can keep themselves informed and be prepared to act appropriately in such circumstances.
To explore this potential, we first retrieved Weibo messages containing the key word “Ebola” and quantified the dynamics of the number of microblogs from March 2014 to March 2015. Second, we filtered those microblogs that had more than 100 comments and reposts and classified the posters of these microblogs as “influential propagators.” By analyzing the content generated by influential propagators within the specified timeline, we can identify the major topics relating to Ebola that the public are concerned about and explore the reasons underlying any observed fluctuations in public attention to the issues. Third, to gain insight into the structure and evolution of communication channels during the outbreak, we analyzed the contact network for participants contributing to the comments section under the postings of one influential propagator. These analyses helped us to develop a better understanding about the usefulness and timeliness of social media networks in promoting public health awareness for preparedness and informed response to an emerging crisis.
METHODS
Social Media in Disease Surveillance
Online social media platforms have developed rapidly in the past decade. Contrary to traditional media, the interactivity between users of social media and the diverse content that is generated make these platforms an important potential source of information for disease surveillance relevant to early detection, improved preparedness, and a more effective response. More importantly, the huge quantity of time-sensitive data can serve as pool of information for conducting surveillance of rapidly emerging events. As a consequence of these potential advantages, several studies have evaluated different aspects of the use of social media in disease surveillance.
Digital disease surveillance is a recent advancement in early detection of infectious diseases or in research on other diseases (eg, mood disorders). This form of surveillance has branched out from Internet-based technologies in earlier years to mobile technologies.Reference Brownstein, Freifeld and Madoff 11 , Reference Wesolowski, Stresman and Eagle 12 Over the last 2 decades, current developments have gone beyond human health with applications extending to even animal health and monitoring of vector-borne diseases, transport modeling, as well as spatiotemporal mapping of unusual health events harnessing information on the Internet.Reference Khan, McNabb and Memish 13 - Reference Rényi 16 Digital disease surveillance is based on the extraction of data through formal (ie, government controlled and sanctioned information) and informal electronic information to identify abnormal or unusual events that may occur in the community, in a given population, or in a geographic locality during a specified period. Examples of Internet-based usage are mostly informal, such as the use of search query data,Reference St Louis and Zorlu 17 , Reference Yom-Tov, White and Horvitz 18 online news,Reference Keller, Blench and Tolentino 19 , Reference Velasco, Agheneza and Denecke 20 and social media and networks,Reference St Louis and Zorlu 17 , Reference Velasco, Agheneza and Denecke 20 , Reference Signorini, Segre and Polgreen 21 whereas mobile technologies include formal data such as call detail records, which identify the location of the original call made, and even smart phones with global positioning systems (GPS).Reference Wesolowski, Stresman and Eagle 12 , Reference Stevens and Pfeiffer 15 The concept of online disease surveillance has recently experienced significant realizations and progress. Various online syndromic surveillance methods and models are being continuously developed, assessed, and improved with data from (1) search engine queries (such as Google queries), (2) social network blogs (eg, Twitter microblogs), and (3) health website accesses (eg, Wikipedia visits).
Twitter, as one of the most widely used and accessible micro-blogging services, is a major focus of studies on social networks. Most disease surveillance on social networks is based on Twitter data.Reference Signorini, Segre and Polgreen 21 For example, Lampos et alReference Lampos, De Bie and Cristianini 22 analyzed the content of Twitter feeds to track the prevalence of influenza-related illness in regions of the United Kingdom and presented an automated tool with a web interface to trace updated flu-score data from Twitter and official data. Signorini et alReference Signorini, Segre and Polgreen 21 tracked public reaction to H1N1 flu virus and showed that Twitter can be used to measure elements of public concern about health-related events. Aramaki et alReference Aramaki, Maskawa and Morita 23 attempted to use Twitter to detect the incidence of flu. The high correlation between predicted and realized outcomes showed that Twitter texts have the potential to reflect the actual incidence of events and that natural language processing (or NLP) technology can be used for Twitter content. Using NLP to convert human language to machine-readable format has the potential to inform public health preparedness for targeted and timely intervention, which has been underutilized for improving public health preparedness.Reference Mirhaji 24 Notwithstanding the promise of social media approaches, relatively few studies have been conducted of the potential for Sina Weibo to support public health outcomes in China, despite the large number of users in China.
Sina Weibo was launched in September 2009 and is a microblog platform analogous to Twitter. Users can write posts of up to 140 characters attaching photos, videos, and emoticons and locating geographical information. Posts generated by users on Weibo are publicly accessible for viewing and interactions such as commenting, reposting, or liking. In a short time, Weibo has become a widely used and influential platform, largely because of easy accessibility and wide and rapid connectivity. The subsequent development of support for mobile applications also boosted the popularity of the platform. Weibo consists of 60% male users and 40% female users, with 40% of the users in the age group of 21 to 25 years and 32% in the age group of 26 to 30 years.Reference Zhang and Pentina 25 Various activities are conducted by Weibo users, including self-expression, contacting friends, following celebrities, and participating in interest groups or social activities. Information diffusion is a powerful function of the Weibo platform with plenty of strong and weak ties among users. A comparative study of user behavior and motivation of Weibo and Twitter suggest significant differences as well as new insight for multilingual and culture-awareness of user modeling.Reference Gao, Abel, Houben and Yu 26
Current research using the Sina Weibo platform mainly focuses on the large number of user-generated content such as topic mining, sentiment analysis, and user classification. Topic mining deals with the use of text clustering algorithms or probability models to identify topics from short texts automatically, which can be used to detect spam information. Sentiment analysis is an important methodology for extracting user attitudes and feelings during an event, which is frequently used to monitor public opinion and analyze user preference in Weibo. User classification is used to understand users’ behavior and preferences. Although these analysis methodologies do not specially focus on the application of disease surveillance, they provide insight into techniques that could work and some basic understanding of information diffusion and the potential for content analysis.
Relatively few studies have been done on the potential for analyses related to public health using Weibo. Fung et alReference Fung, Fu and Ying 27 analyzed public awareness of H7N9 using Weibo data and demonstrated that Weibo can be a useful platform for exploring public reaction to disease outbreaks in China. The development of approaches to topic classification of microblogs provide us with the tools for classifying the social media data.Reference Chen, Li and Nie 28 Cui et alReference Cui, Yang and Wang 29 classified Weibo content to predict the outbreak of flu by improving on Chinese text processing methods. Wang et alReference Wang, Paul and Dredze 30 further identified health-related topics on Weibo by applying probabilistic topic models that can characterize each topic by a probability distribution over words by the Latent Dirichlet Allocation (LDA) model and further identify health topics by the Aliment Topic Aspect Model (ATAM). Because the messages on Weibo are all in Chinese (only 1.6% of users are from other countries),Reference Fu and Chau 31 the developed applications of text analysis for English language are not applicable. Language is a major hindrance in transferring research results and methodologies from Twitter to Weibo.
Our research focuses on the development of new approaches specifically for use with Weibo data as a proof of concept for supporting public health awareness and response in China. We use public awareness of Ebola as a case study and identify the topics that concerned the public over time, identify the evolution of structures of the social networks, and quantify the role that influential propagators played in the spread of information. We believe that identification and exploration of the role of influential propagators (ie, who is able to influence others with their posting and comments about the subject) can be an important step in promoting public health awareness for improving our efforts in coordinating disaster medicine and public health preparedness.
Weibo Data Collection and Analysis
The choice of appropriate key words that relate to particular public health preparedness is a critical first step to ensure that useful information is extracted from posts for use in subsequent analyses. Recall is defined as the result of the number of documents that are relevant to the key words divided by the total number of documents that are relevant to the topic.Reference Ono, Hishigaki and Tanigami 32 To explore the key words that can represent the response to EVD clearly and accurately, we downloaded the document “Frequently asked questions on Ebola virus diseases” from the website of the World Health Organization (WHO), 33 which describes 13 common questions about EVD, including the definition, infection reasons, symptoms, and preventive methods. We extracted key words from this document by inputting the document into the Natural Language Processing to Information Retrieval (NLPIR) system to extract key words automatically and calculated weighted values. In this analysis, 9 was the frequency and 14.71 (discussed below) was the weight value; the higher the weight value, the greater the importance of the key word.Reference Zhou and Zhang 34 Table 1 presents the top 5 key words.
Table 1 Top 5 Key Words in the Extraction Output

As shown in Table 1, the highest-weighted key words contained “埃博拉” (Ebola). Thus, we can infer that the search results using the key word Ebola can capture the content searched for by using the other 2 key words. We also tried searching content in Weibo by using only the key words “medical staff” or “public health,” but the search results were mostly about common medical issues rather than the Ebola event. The public response to EVD differs from that to, for example, influenza H7N9, primarily because there was not any confirmed case of EVD in China. Therefore, people who talk about influenza may use various words to describe or express the symptoms instead of mentioning the disease name directly, whereas for EVD, people usually refer to the name directly in Weibo content. On the basis of the above analysis, we decided to choose “埃博拉” (Ebola) as the key word to retrieve related content in Weibo. We then searched the data by using this key word covering postings made by users between March 2014 and March 2015 and analyzed the posts that were retrieved. The total volume of Weibo posts retrieved in this way was 5,120,376 for the year, with an average weekly volume of 89,831. However, Weibo can only display 50 pages equaling 1000 records per search, which meant that we could collect only a subset of all Ebola-related messages for use in further NLP processing. To account for this, we used relative frequency, rather than absolute numbers of outputs returned, and assumed that the 1000 records returned per search were statistically representative of all relevant records. For each of the retrieval posts, we collected data on the information in each post and on the number of comments and reposts.
Observation of Trends
The weekly number of posts related to Ebola was collected throughout the whole period to quantify and visualize trend in the volume of messages. This reveals the change tendency in public attention and displays an overview of the public reaction to Ebola in the social network. On the basis of the trend analysis, we could also identify the peak points and analyze trends in the number of different “kinds” of users. For example, research published in the Chinese literature by Li and Liu classified Weibo users into 3 categories: observers, active participants, and propagators.Reference Lei and Ji 35 Observers mainly read information in Weibo and are passive information recipients. Active participants usually add comments or add links to their contacts. Weibo posts released by propagators have, by definition, a large number of comments and reposts. Propagators play an important role in the transmission of information that can be used to disseminate public health alerts to a wider population. In this research, we collected the number of propagators in each week to examine the correlation between the number of posts and the number of propagators. This was based on the collected data for examining the relevance between the number of microblog messages and the number of propagators.
Key Word Extraction
The aim of key word extraction was to discover the topics that the public was particularly concerned about at certain points in time and to discover the reasons for changes in public attention. Key words are succinct summary words or phrases that characterize widely shared content, which can provide a way to explore public awareness of specific epidemics so that public health preparedness can support the development and implementation of targeted and timely campaigns during outbreaks. The NLPIR system processed key word extraction and calculated weight values after conducting word segmentation. Word segmentation is the process of cutting Chinese character sequences into single words. Unknown words and word ambiguity are the 2 major problems that can affect the accuracy of segmentation.Reference Haizhou and Baosheng 36 The NLPIR system has strong performance on Chinese word segmentation,Reference Zhou and Zhang 34 and the key word Ebola was used for Weibo messages to extract relevant data, which was fundamental to our analysis of public awareness of Ebola outbreaks for improving public health preparedness. The posts generated by propagators are widespread and influential. According to the statistical distribution of the postings, we defined a propagator as someone whose posts have more than 100 comments and reposts. For “peak traffic events,” we analyzed the hot topics based on the posts of propagators. By analyzing the messages in this way at specific time points, we were able to uncover trends in the topics that the public considered to be important about Ebola.
Social Network Analysis
Social network analysis has been found useful in describing, exploring, and understanding structural and relational aspects of health in a number of studies, in which the ecological questions in public health can be investigated by using the theoretical and methodological principles of social network analysis.Reference Luke and Harris 37 Besides the content, the link structure in the social network can also be analyzed to provide important additional information about how information is being shared about Ebola outbreaks. Social network analysis can be used to observe the dynamic relationships among active participants during the transmission of key events on Weibo, which we believe can be used to develop effective and timely dissemination plans for targeted populations who could be at risk. As a partial network to analyze the characteristics and evolution of network structure, we chose the network associated with the “People’s Daily,” because it is one of the most influential media bloggers in China. We analyzed properties of this network from July to November 2014. This was due to “peak traffic events,” in which we selected 5 messages posted by the “People’s Daily” from July to November 2014 as partial networks for analyzing dynamic changes on topics and participant interactions. In particular, we quantified network density and network centrality. Network density is important to disaster medicine and public health preparedness because it allows us to measure the connectivity of a network, which can be calculated by dividing the number of actual connections by the number of possible connections:
 $$2L/n\left( {n{\minus}1} \right)$$
where L denotes the number of connections and n denotes the number of nodes for an undirected graph. For a directed graph (connections operate only in a specified direction of attachment from one node to another), the corresponding formula is
 $$L/n\left( {n{\minus}1} \right)$$
A higher density implies a higher degree of interaction among individuals, which can serve as a scaffold on which to develop target interventions and create an information dissemination plan for improving public health preparedness. Network centrality identifies the number of connections a node has and can help to identify the most influential node in a social network,Reference Scott 38 which can help public health planners find the most effective and optimal pathways by which to disseminate information to a wider population about specific outbreaks. FreemanReference Freeman 39 proposed 3 centrality measures: (1) the degree centrality of a node, which is calculated as the number of links that the node has; (2) the betweenness centrality, which quantifies the number of times a node is included in the shortest path between all other pairs of nodes in the network and which is a measure of the potential of an individual to play a brokerage role in the network; and (3) closeness, which is the reciprocal of farness, where farness is defined as the sum of the shortest distances of the node from all other nodes in the network (ie, the larger the closeness centrality of a node, the lower its distance to all other nodes). By analyzing the network density and network centrality, we can quantify important aspects of the nature of interaction of participants as well as the number of influential actors and the changes thereof over time.
RESULTS
Observation of Public Attention
Figure 1 lists the number of Weibo messages about Ebola for the weeks from March 2014 to March 2015 and the corresponding number of propagators in each period. The total volume of posts was 5,120,376 and the total number of propagators was 518 including duplicates. As previously discussed, because of the length limitations in downloading reports from Weibo, the number of propagators could only be calculated from a maximum of 1000 posts; therefore, these numbers are a measure of the change in the proportion of propagators in Weibo, rather than the absolute numbers.
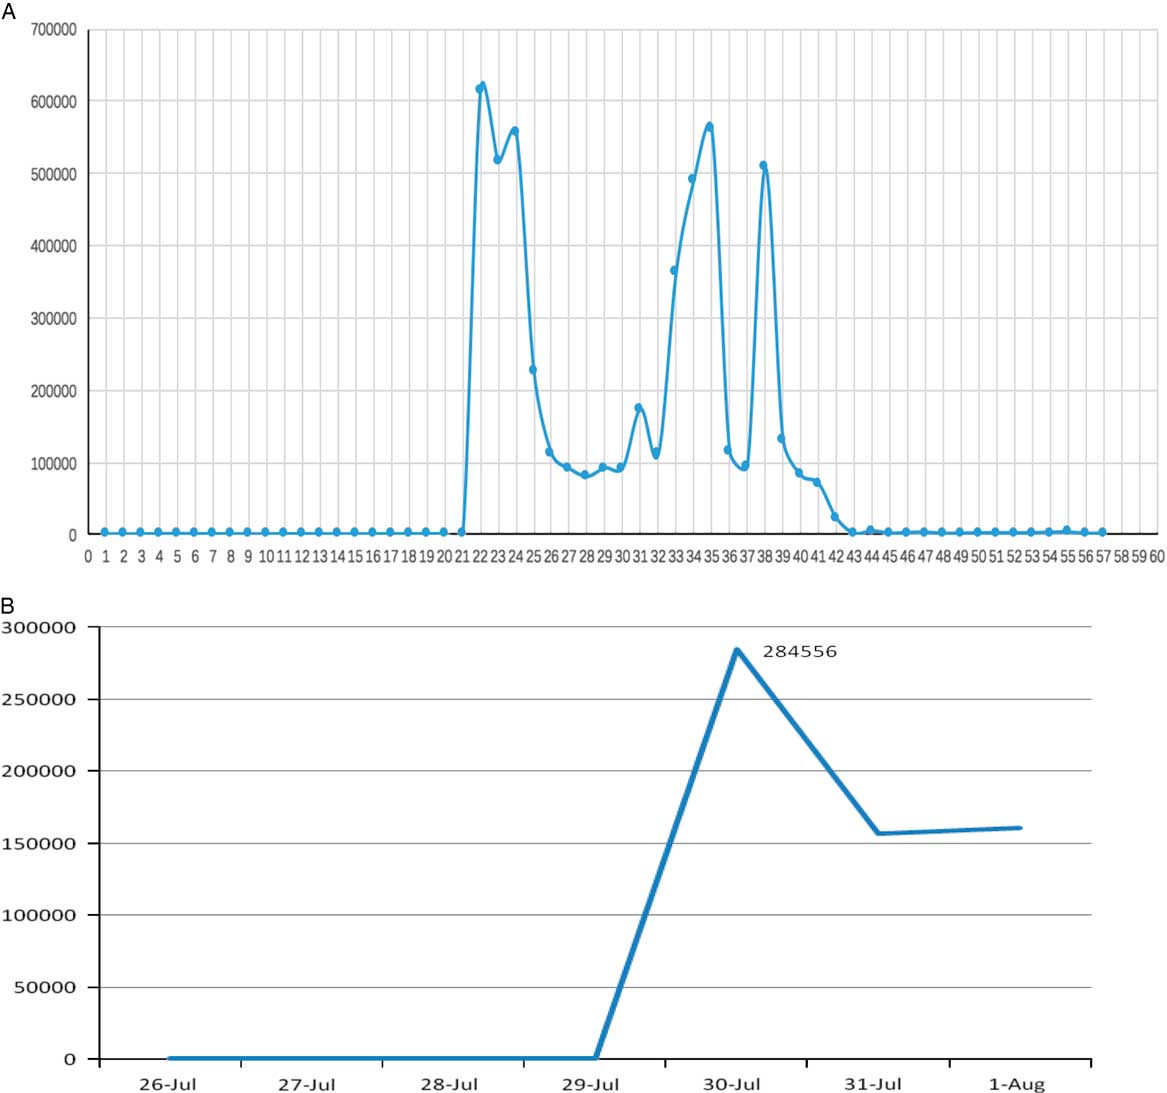
Figure 1 (A) Weekly Number of Weibo Posts About Ebola From March 2014 to March 2015. (B) Daily Number of Weibo Posts About Ebola During the Week of July 26 to August 1.
The whole change tendency of public attention to Ebola on Weibo from March 2014 to March 2015 is shown in Figure 1A. On March 24, the WHO first reported an outbreak of EVD in Guinea, but we can see from the Weibo traffic that few people in China were sharing information about Ebola at that time. In fact, it was not until July 26, 21 weeks later, that traffic started to increase significantly. At that point, we have the first peak, which rose sharply during the week from July 25 to July 30. The number of posts that mention Ebola during that week was 614,476, the largest volume in the whole study period. It was during this week that a Hong Kong woman returning from Kenya was reported to be showing symptoms similar to EVD. The news was released on July 30. To see the detailed public reaction in this week, Figure 1B shows the daily number of posts from July 26 to August 1. We can see that the number of references to the disease peaked immediately on the day that the news was released. The data indicate that from July 30 onward, there was an increase in awareness among the Chinese public about the seriousness of Ebola. This period of raised awareness lasted from July 26 to December 19. There were 4 exploration weeks, respectively, July 26 to August 1, October 9 to October 15, October 25 to October 31, and November 15 to November 21. After December 20, the data indicated that public attention to the EVD event in the Weibo community gradually came to an end.
In addition to observing the change tendency in the number of posts, we also analyzed the correlation between the volume of posts and the number of propagators. In Figure 2, we plot the number of propagators against the volume of posts. The Spearman correlation coefficient was 0.899, which means that the number of propagators was significantly correlated with the volume of Weibo posts in the study period. After we removed duplicates in different weeks, the number of propagators was reduced from 518 to 252. The difference between the total number of propagators and the number of distinct actors showed that many propagators sent posts about Ebola repeatedly in different weeks. To some extent, the duration of their posts about one topic can influence the length of the topic transmission period. We observed that the number of posts decreased rapidly when influential posters ceased paying attention to the topic. We defined 3 types of propagators: ordinary users, journalists/media bloggers, and certified celebrities. Among the 252 total propagators, ordinary users made up 20% and the percentage of certified celebrities was 28%. At 52%, journalists or media bloggers made up the majority of propagators. Thus, journalists or media bloggers were the major information posters and transmission nodes in the Ebola event. They tended to have a large number of followers and to post the newest information in a timely fashion. Many users commented on or reposted these propagators’ microblogs. Compared to the certified celebrities and journalists or media bloggers, ordinary users may be less reliable sources of information, and therefore the widespread original content generated by common users could be monitored as a source of spreading rumors.
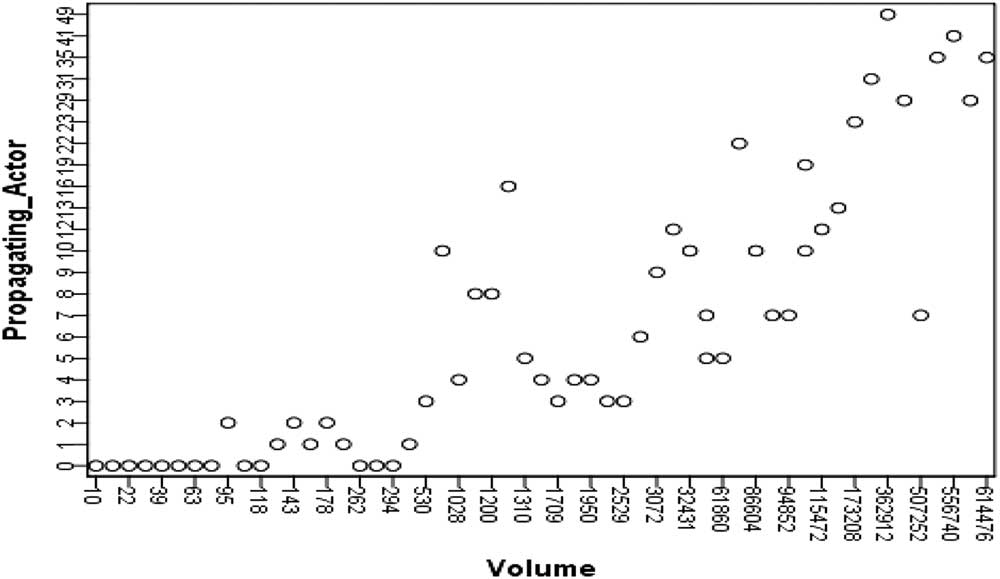
Figure 2 Distribution According to Volume of Posts and Number of Propagators.
Analysis of Peak Traffic Events
We can see that there were 4 peaks, respectively, on July 26 to August 1, October 9 to October 15, October 25 to October 31, and November 15 to November 21. For each event, we filtered the messages above the threshold of 100 comments and reposts and extracted key words from the content. We postulated that the most frequently shared terms about Ebola may give insight into the reasons for the peak in traffic (see Table 2 for details). The posts generated by propagators were widespread and influential. The qualified dataset can minimize the spam information and improve the accuracy and confidence of the results. We extracted 45 threshold posts during the week of July 26 to August 1 and the key words therein. Combining the original messages, we could explain the key words. In this week, a Hong Kong woman was reported to be displaying symptoms similar to Ebola. The most widely shared blogs in this week mainly introduced basic knowledge about Ebola, such as “route of transmission,” “fatality rate,” and “therapy.” The information from the WHO, reporting on the number of deaths in Africa, especially Sierra Leone, also attracted a lot attention.
Table 2 Key Words in the 4 Peak PeriodsFootnote a

a Abbreviations: CDC, Centers for Disease Control and Prevention; WHO, World Health Organization.
The second peak appeared during the week of April 9 to April 15 and there were 45 posts above the threshold, with 2 popular topics. CCTV bloggers reported that China had the antibody gene of Ebola and would appoint 9 experts to aid Africa, that Canada would provide experimental vaccines, and the United States would treat Ebola with the vaccines in clinic trials in September. Additionally, the bloggers of the Foreign Office told Chinese citizens not to travel to the infected areas, such as Guinea and Liberia. After the second exploration point, the attention to Ebola declined but then peaked again during the week of October 25 to October 31. In October, the Annual Canton Fair, an international import and export fair, was held in Guangzhou and was attended by more than 10,000 delegates from Africa. The risk of introduction of Ebola into China was perceived to be high, and this was reflected in the disease-related traffic on Weibo. The news highlighting a large increase in Africans arriving in Guangzhou made up a fierce online discussion. Besides news about Guangzhou, there were popular news items about CCTV reporters wearing protective clothing to visit the observation center in Sierra Leone and an unusual behavior of a sign language interpreter in the press conference. These were all reflected in the key word search terms presented in Table 2. The last peak occurred during the week of November 15 to November 21, in which the following 4 topics were instrumental in stimulating this peak: Ebola influenced cocoa production in West Africa, and so the supply of chocolate may be at risk in 2020; China appointed 4 medical teams to provide aid in Africa; medical staff said farewell to their relatives in the Beijing Capital International Airport; and India found the first confirmed case of EVD, which was the first infection case in Asia.
Results of the Analysis of Network Evolution
The network of information transmission is dynamic, and changes in interaction among actors can reflect the evolution of topic development. Here, we selected 5 messages posted by “People’s Daily” from July to November in 2014 as partial networks to analyze the dynamic changes in the participant interaction network. “People’s Daily” has 394,300,000 followers and is regarded as an authoritative official media blogger. It posted 28 microblogs about Ebola, mainly during the period of July 30 to November 28 in 2014. We chose 5 messages out of the 28 posts in each month from July to November. Each message had the largest number of comments and reposts compared to other posts on Ebola in that month. The messages were chosen in each month for all influential posts, which were released as timely news about Ebola and are listed in Table 3.
Table 3 Five Messages Posted by People’s Daily

Users can make a comment and reply to each other under the message. Weibo lists the hot comments that acquire many “likes” from other users and we identified the users who wrote the hot comments as the active participants. We constructed 5 undirected networks for the active participants of the 5 messages where each message had the largest number of comments and reposts compared to other posts on Ebola in that month. We constructed the network for the active participants under the 5 messages and developed a matrix of active participants and uploaded in Ucinet to get the network. Active participants were regarded as nodes and links between nodes represented that they had interacted with each other including conversation or mention. For each of these networks, we calculated the number of nodes, the number of edges, the average density, the average distance, the distance based on cohesion, and the 3 measures of centrality as defined above: degree represented overall activity, betweenness showed the level of control, and closeness highlighted the level of independence. Table 4 shows the results of the analyses. The total number of active participants, indicated by the number of nodes, showed a declining trend during the period along with the number of interactions among them, as reflected by the reduction in the number of edges. On July 30, there were the highest number of participants and links for the whole period, but the network centralization was lowest. This suggests that there were many isolated actors who were not interacting with others. It can be seen that with fewer participants, the relationship among actors is closer. The biggest mean of node degree occurred in the network for the post on August 11 (see Table 4 for measures of network from July to November 2014).
Table 4 Measures of the Network From July to November 2014

Figure 3 shows the relative frequency of the degree of nodes in the network. The lines indicate a best-fit curve of the form P(k)=ck -α , where P(k) is the probability of the nodes having k degree and c and α are constants. The correlation values are suggestive of the power-law characteristics of scale-free networks,Reference Jordan, Mariño-Ramírez and Wolf 40 ie, most nodes have few connections, but a few nodes have a very large number of connections. Thus, a few actors with a large number of degrees have significant influence on information flow across the network, which can play an important role on diffusing information about Ebola safety for public health preparedness. Combining the relative distribution of node degree, it can be seen that there was a bigger probability of actors who own higher node degrees, which means that there were some close interactive groups in this network.
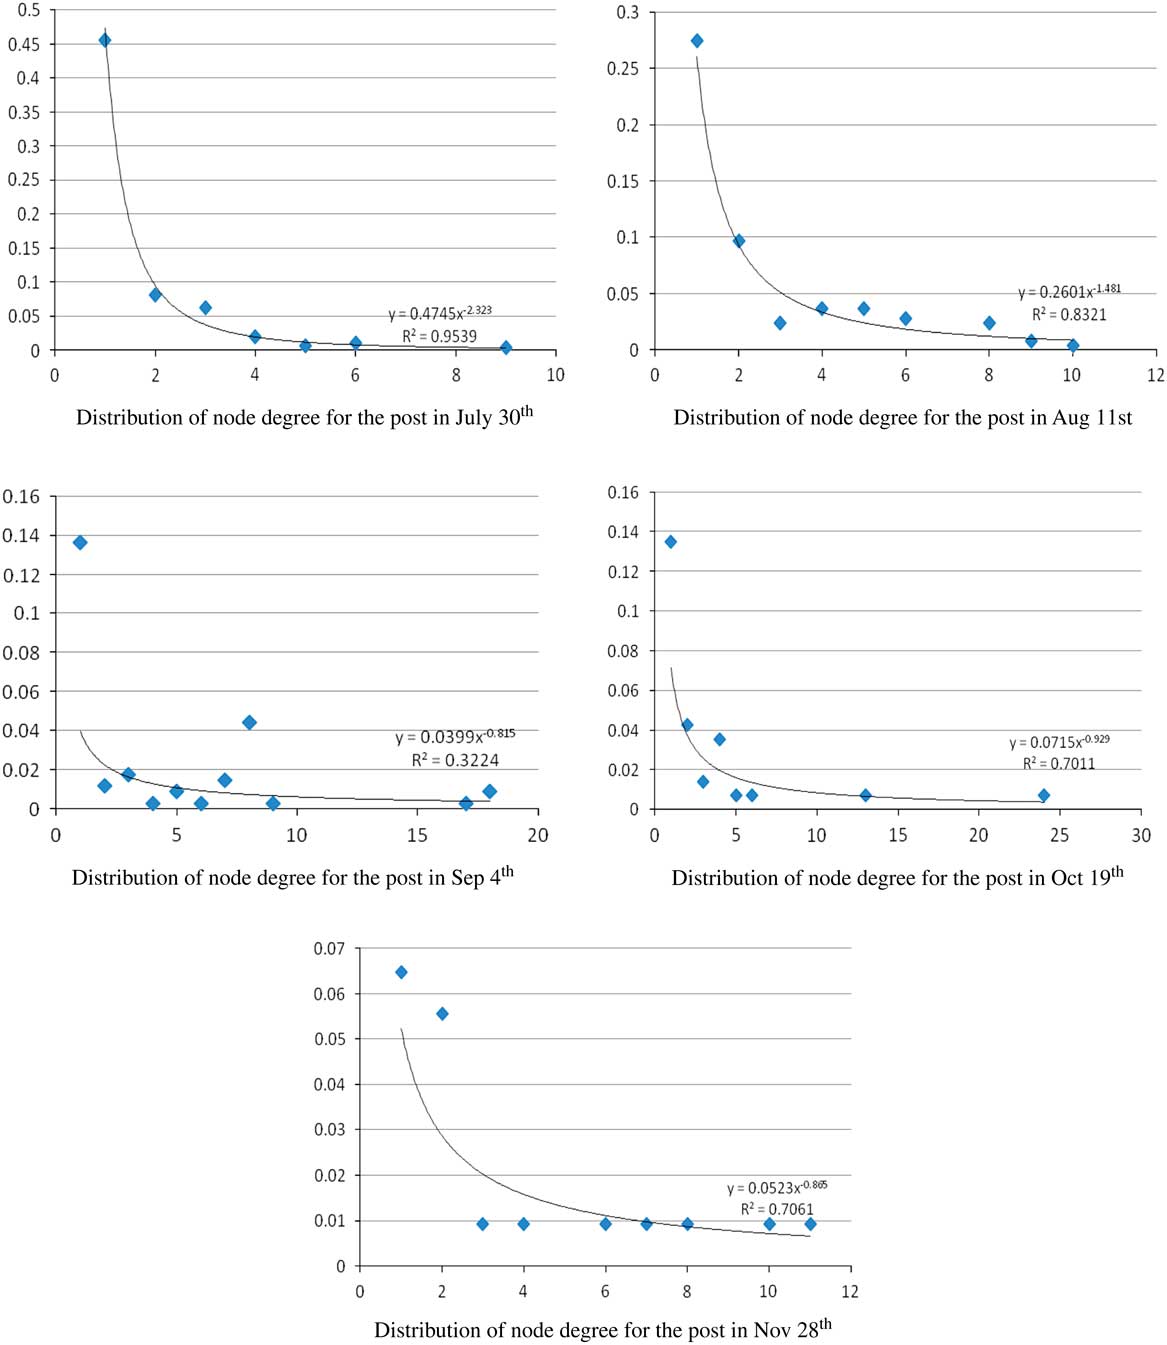
Figure 3 Distribution of Node Degrees in the 5 Networks.
Figure 4 shows graphically the evolution of the network during the period. As indicated by Table 4, it can be seen that the number of nodes and links was decreasing through the whole period. In each map, there are many isolated nodes that represent the actors who had no interaction with others. We can also see that the network for the post on September 4 is most centralized, consistent with the value of network centralization presented in Table 4. To conclude, the evolution of the network from July to November gradually showed a decreasing trend in the number of participants, but the increasing closeness showed that the level of relationship among the participants became closer with the reduction of network scale.

Figure 4 Visualization Maps of the 5 Networks From July to November.
DISCUSSION
Social media as a real-time and widespread online platform provides a major information source and an information diffusion channel that can be used to observe social support networks for diseases.Reference Greene, Choudhry and Kilabuk 41 Social media further promotes healthy behaviors and discourages unhealthy practices,Reference Randolph and Viswanath 42 addresses public concern, and promotes early detection, allowing us to take corrective action.Reference Larson, Cooper and Eskola 43 Social media has been seen as playing a significant role in public health emergency in recent years and can allow regulators and citizens to promote and gain access to timely, accessible, and credible health information during an outbreak or public health emergency for preparedness and response.Reference Glik 44 - Reference McNab 46 From a theoretical and methodological perspective, researchers have been using a combination of theory and methods drawn from communication, sociology, and social anthropology as well as social psychology to understand the communication process and its impact in changing human behavior, which has a significant impact in a public health emergency.Reference Rimal and Lapinski 47 , Reference Wakefield, Loken and Hornik 48
In this research, we analyzed the change tendency in public attention to Ebola, the hot topics which with the public was mainly concerned during peak time points, and the evolution of the participant network. We discovered that the Chinese public began to pay attention to Ebola on July 30, with quick and fierce reaction to the news about a potential suspected case in China, which was mainly concentrated during the period of July 30 to December 19, with 4 peaks, respectively, during the weeks of July 26 to August 1, April 9 to April 15, October 25 to October 31, and November 15 to November 21. After December 20, public attention to this event gradually ended. The hot topics that the Chinese public were mainly concerned with fell into 4 categories: epidemic situation (“Ebola outbreak,” “affecting Ebola,” “Ebola epidemic area,” “West Africa region”); treatment against Ebola (“against Ebola,” “Ebola medicine,” “recover,” “clinical trials”); China medical aid (“aid Africa,” “medical staff,” “Medical team aiding Liberia”); and Ebola prevention (“Ebola vaccine,” “epidemic prevention”).
The dynamic evolution of the participant network under the posts of the “People’s Daily” reflected the decreasing active actors and links during the period of Ebola topic development. We observed that participants gradually decreased but the network centralization became closer with the distribution of the node degree of the 5 networks agreeing with the law power distribution of a scale-free network. We also observed that the number of propagators was positively correlated with the volume of posts in a period. More attention should be paid to the propagators who are ordinary users to prevent them from spreading rumors, especially for epidemics. Small-scale networks may have greater centralization than large-scale networks and there may be more isolated nodes in larger networks. The scale of the networks may influence the interaction level.
Compared with previous research in detecting the Chinese public’s reaction to H7N9, we further analyzed hot topics, the performance of participants, and the relationship of propagators and the volume of posts instead of only discovering the change tendency of the public’s reaction in presenting the first analysis of the Chinese public’s reaction to Ebola by monitoring Sina Weibo. The methodology of this investigation could be used to judge and evaluate the public reaction to epidemics. Our results can provide some reference for governments and related authorities to take measures at the appropriate time. Data in social websites are a valuable resource that can reflect public opinions and moods quickly and truly and that can serve as effective references for the government to release announcements to the public by monitoring public reaction and taking appropriate measures essential for preventing and controlling epidemics.


