1. Introduction
As the most widely used fossil energy in the world, oil is mainly transported by sea, but it is also prone to oil spill pollution (Wan and Chen, Reference Wan and Chen2018; Chen et al., Reference Chen, Zhang, Wan, Li, Huang and Fei2019). In contrast, liquefied natural gas (LNG) transport is more environmentally friendly. Besides, LNG transport will also promote the environmental development of ports (Hua et al., Reference Hua, Chen, Wan, Xu, Bai, Zheng and Fei2020). According to the 2019 annual report of the International Group of Liquefied Natural Gas Importers (GIIGNL), China's apparent consumption of natural gas in 2018 was 280⋅3 billion m3, surpassing South Korea and becoming the second largest importer of LNG. Among the imported resources, overseas LNG was as high as 74⋅3 billion m3 and pipeline gas was 50⋅5 billion m3. The first LNG terminal in China, CNOOC Dapeng LNG Terminal, started operations in 2006, and 22 LNG terminals had been built in China by September 2019. With the completion of more LNG terminals, the frequency of LNG ships arriving at each port will increase dramatically.
In this context, from the perspective of ship traffic flow, it is necessary to study the efficiency and traffic organisation scheme of LNG ships entering and departing port. There are many studies in which the results of various maritime traffic flow models have been reported (Bush et al., Reference Bush, Biles and DePuy2003; Merrick et al., Reference Merrick, van Dorp, Blackford, Shaw, Harrald and Mazzuchi2003; Cortés et al., Reference Cortés, Muñuzuri, Ibáñez and Guadix2007; Özbaş and Or, Reference Özbaş and Or2007; Mavrakis and Kontinakis, Reference Mavrakis and Kontinakis2008; Na and Shinozuka, Reference Na and Shinozuka2009).
At present, many scholars study traffic flow by means of traffic flow simulation based on cellular automaton (CA). The CA traffic flow model was first applied to road traffic. Nagel and Schreckenberg (Reference Nagel and Schreckenberg1992) began utilising CA for traffic simulation in 1992, and it is now one of the main models used in current research on road traffic conditions (Eldemir et al., Reference Eldemir, Camci and Uysal2013). From the perspective of the research object, the CA traffic flow model is mainly divided into a single-lane CA traffic flow model, a unidirectional multi-lane CA traffic flow model, a two-way dual-lane CA traffic flow model, CA traffic model based on road network (Wagner et al., Reference Wagner, Nagel and Wolf1997; Guo et al., Reference Guo, Wan, Zhao, Wang and Li2013; Dong et al., Reference Dong, Pei, Liu, Jin and Chen2014; Fang et al., Reference Fang, Li, Li, Zhou, Liu, Wen and Zheng2014; Ma et al., Reference Ma, Yan and Luo2014; Zhu et al., Reference Zhu, Wang and Zhou2014). Currently, CA is widely used in the simulation of marine traffic flow because of its simple and practical rules and high-speed computing power (Wolfram, Reference Wooldridge, Weiß and Paolo Ciancarini1986). However, because research on ship traffic flow based on CA started later than the research on road traffic, there is a paucity of studies that report the results (Zhuo et al., Reference Zhuo, Zhonglong, Hongtao and Zheng2015). In the past decade, scholars from various countries have conducted research on the simulation of ship traffic flow using CA. Qu and Meng (Reference Qu and Meng2012) used 10 ship following rules and five ship crossing rules to simulate seafarers’ responses to various sailing scenarios. Furthermore, they used CA to simulate the ship traffic flow in the Singapore Strait. Sun et al. (Reference Sun, Chen, Hu and Zheng2015) proposed a two-lane CA model to study traffic flow patterns in narrow waterways and examined the impact of frequent lane changes of high-speed vessels on traffic. Hashemi and Karimi (Reference Hashemi and Karimi2016) subdivided road segments into multi-state variable-length cells for traffic flow simulation. Qi et al. (Reference Qi, Zheng and Gang2017a, Reference Qi, Zheng and Gang2017b), based on CA, proposed a spatial-logical mapping model for ship traffic flow, which can solve the ship pseudo lane-change problem efficiently. Linying Chen et al. (Reference Chen, Zhang, Wan, Li, Huang and Fei2018) studied the feasibility of distributed simulation models for autonomous and coordinated multi-ship traffic simulation. Xin et al. (Reference Xin, Liu, Yang, Yuan and Zhang2019) proposed a CA model for the Xiazhimen waterway. In that model, the ship domain and ship's acceleration and deceleration were considered.
Additionally, with the development of multi-agent technology, some scholars have started using multi-agent systems for simulation modelling. Huang et al. (2016) established a complex network model of network public opinion that considers the relationship between individuals’ cognitive bias and their corresponding choice behaviours based on multi-agent. This model can be used for empirical research involving sudden changes in public and personal opinions on the internet. Zhang et al. (Reference Zhang, Li and Zhao2005) proposed a multi-level, multi-agent system (MAS) framework and established a one-way highway micro–macro traffic simulation model. Vaněk et al. (Reference Vaněk, Jakob, Hrstka and Pěchouček2011, Reference Vaněk, Jakob, Hrstka and Pěchouček2013) designed a data-driven MAS maritime traffic model to evaluate the effectiveness of anti-piracy measures and schemes.
The flexibility and openness of the CA model enables the study of traffic systems with different conditions and the combination of other intelligent methods. Given the superiority of artificial intelligence technology in traffic simulation, some scholars started both applying CA and multi-agent to ship traffic simulation. Numano et al. (Reference Numano, Itoh and Niwa2001) and Inaishi (Reference Inaishi2004) comprehensively considered the behaviour characteristics and sailing environment factors of ships, used the agent to describe the characteristics and autonomous behaviours of each ship, and simulated the ship's sailing state in a local area. Jiang et al. (Reference Jiang, Huang, Huang and Wang2019) built a CA and multi-agent combined simulation model based on ship behaviour to verify the impact of ship behaviour on port operation.
The special traffic rules of LNG shipping put forward higher requirements for the simulation method. To simulate the special traffic rules of LNG ships and study the traffic capacity in ports, a simulation model based on the combination of CA and multi-agent was constructed in this study. Considering the CNOOC Tianjin LNG Terminal as the object, the traffic flow entering and departing the port was simulated. Based on the simulation results, the LNG ship traffic capacity and its impact on the whole traffic flow under different special traffic rules are obtained.
The rest of this paper is organised as follows. In Section 2, the navigation of the LNG ship based on the combination of CA and multi-agent and the simulation of regional ship traffic are completed. In Section 3, the introduction of the target area is presented and different simulation conditions are set. Furthermore, the simulation results of different working conditions are compared and analysed and corresponding conclusions are presented. In Section 4, the research conclusions of the paper are summarised. Furthermore, future research directions are presented.
2. Modelling
Due to the homogeneity of the CA model, a traffic simulation model that is only based on CA cannot reflect the differences between LNG ships and other ships during navigation. Therefore, multi-agent is required in the model to embody special behaviours and special management regulations for LNG ships. The model based on multi-agent exhibits many properties, such as autonomy, responsiveness, flexibility and scalability (Wooldridge, Reference Wooldridge2000; Wooldridge et al. (Reference Wooldridge, Weiß and Paolo Ciancarini2002)). By adding multi-agent into the CA model, the differences between LNG ships and other ships can be reflected, and the special traffic rules and traffic organisation schemes for LNG ships can also be tested. The structure of the model is shown in Figure 1, the running process of the simulation is shown in Figure 2.

Figure 1. Framework of ship traffic modelling in port based on CA and multi-agent

Figure 2. Simulation model running process
2.1. CA modelling
2.1.1. Time and space discretisation
CA is a system that changes dynamically with time, and the corresponding time is discrete. This implies that time t has an integer value, and it is continuously evenly spaced. In road transport, the simulation time step is generally set to 1 s (Wagner et al., Reference Wagner, Nagel and Wolf1997). When compared with road transport, the average speed of a ship is slower, and the time it takes for the ship to pass through a channel is longer. Hence, the time step of the ship traffic flow simulation can be set to 1 min. Thus, it is assumed that the time interval  ${d_t} = 1$. If
  $t = 0$ is the initial time, then
  $t = 1$ is the next time, i.e.,
  $t + 1 = 1 \;\textrm{min}$. In the above conversion function, although the state of the cell at time
  $t - 1$ and its neighbouring cells indirectly affect the state of the cell at time
  $t + 1$, in practice, a cell only determines the state of the cell and its neighbours at time t.
2.1.2. Channel discretisation model
The research object was selected, and the ordinary ship traffic flow was used as the background traffic. A simplified rectangular area was used instead of the oval ship area to facilitate calculation and simulation. The size represented by each cell was set according to the type of ship and the dimensions of the channel.
Spatial discretisation requires the size of the space cells to be determined. The size of the space cell is related to the speed of the ship. It is reasonable to consider the distance travelled by a ship within a step as the size of the cell at a unit speed. The unit of speed for ships is knots ( $\textrm{knot} = \textrm{n\; mile}/\textrm{h}$), and the step size of time discretisation is 1 min. Thus, the distance of 1 min in terms of the unit speed of the ship can be used as the size of the cell. The cell size is
  $1\;\textrm{knot} \times (1/60)\,\textrm{h}$. Additionally, in practical applications, the cell size and time step can be changed to satisfy the requirements for simulation accuracy and computing resource consumption.
Based on the structure of the CA, the channel is considered as a rectangular area and divided into several cell matrices according to the specified cell size. Specifically, the cell size is a two-dimensional matrix represented by  $[{i,j} ]$, where i denotes the cell number in the cross-section direction of the channel and j denotes the cell number in the length direction of the channel. Furthermore, more information about the cell, such as the number of the ship, and speed of the cell, are stored in other dimensions of the matrix. After discretisation, each square represents a cell. Subsequently, based on the information, such as the speed and safety distance of the ship, the ship's motion rules are formulated to build a ship traffic model based on CA.
2.1.3. Rules of ship motion based on CA
In the CA model, the rule of motion of a ship is realised through evolution rules. Specifically, evolution rules are also termed as update rules. They determine the dynamic function of the state of the cell at the next moment based on the current state of the cell and its neighbours. In simple terms, it is a local state transfer function.
Based on the sailing process of LNG ships entering and departing the port, and by combining the process with the features of CA and multi-agent, the two-part update rules for the simulation model were established as: entering and departing the port, and loading and unloading operations.
Ship location update rules are as follows. Based on changes in the ship's speed, the position of the ship and state of the cells occupied by the ship are updated as follows:
 \begin{equation}X_{({i,j} )}^{\textrm{t + }1} = X_{({i,j} )}^t+{\textrm{V}_{\textrm{ship}}}({t + 1} )\end{equation}
 $X_{({i,j} )}^t$ denotes the position of the ship at time t.
Set speed range:
 \begin{equation}{V_{\textrm{ship}}}(t )\in \{{0,1, \ldots \ldots .{V_{\textrm{max}}}} \}\end{equation}
Acceleration rules:
 \begin{equation}{V_{\textrm{ship}}}({t\textrm{ + 1}} )= {V_{\textrm{ship}}}(t )+ a + {a_1}\;D \gt {D_{\textrm{safe}}}\end{equation}
where D denotes the distance between two adjacent ships;  ${D_{\textrm{safe}}}$ denotes the safe distance that should be kept between two adjacent ships; a denotes the acceleration that is set according to the ship's main engine power; and
  ${a_1}$ denotes the acceleration that is set according to the data of constant wind direction, strong wind direction, and tidal current of the target channel.
Deceleration rules are:
 \begin{equation}{V_{\textrm{ship}}}({t\textrm{ + 1}} )= {V_{\textrm{ship}}}(t )- a + {a_1}\;D \lt {D_{\textrm{safe}}}\end{equation}
2.2. Multi-agent
2.2.1. LNG ship agent
Based on the CA, the agent is added into the CA update rule, and the agent is repeatedly updated in parallel according to the set local rules, thereby realising the effect of simulating LNG ships in the channel. A multi-agent model for LNG ships is constructed based on the speed, movement of safety zone and customary routes.
The operation process of the ship agent model involves: the perception exploration of local neighbours, i.e., collecting the state of the surrounding environment and determining the subjects that should interact; and decision-making, i.e., providing instructions for the next actions of the ship. Decision instruction calculations are converted into ship movements. When LNG ships enter and leave the port, special traffic rules, such as clearing the channel, and limiting the time that LNG ships are allowed to enter and depart the port, are added to the channel.
2.2.2. Channel agent
The agent is introduced into the discretised cell space, and the multi-agent model of the channel is constructed according to the types of ships in the channel, the speed of the ships, and the time rules after discretisation. The channel agent is given special rules, and the channel agent is called upon, when the model is running, to realise the effect of simulating the special channel rules.
The operation process of the channel agent includes collecting the state of the surrounding environment, i.e., detecting which ship is sailing in the waterway and checking whether the ship need to exchange information with channel agent. The information exchange between two subjects determines whether the channel should be cleared, including the time and range of clearing the channel.
2.2.3. Berth agent
Based on the geographic location and scale information of the berth, a berth agent is constructed. The berth agent is given special rules, and the berth agent is called upon, when the model is running, to realise the simulation effect of LNG ship berthing and transporting gas. The cell representing the LNG berth in the CA model is individually packaged and expanded into an LNG berth agent with perception and decision-making capabilities.
 \begin{equation}B = \left( {\begin{array}{{ccc}} {{B_{11}}}& \cdots &{{B_{1n}}}\\ \vdots & \ddots & \vdots \\ {{B_{n1}}}& \cdots &{{B_{nn}}} \end{array}} \right)\end{equation}
where B represents berth, and  ${B_{nn}}$represents position of this berth. When the berth is occupied,
 $\; B = 1$; when the berth is free,
  $B = 0$.
The operation process of the berth agent model includes the perception exploration of local neighbours, i.e., collecting the state of the surrounding environment, determining whether LNG ships are docking, and judging the occupancy status; interacting with the LNG ship agent according to the LNG ship size and type; determining the gas transmission operation time and further determining the occupancy time, and sending feedback of the berth status and occupancy time to the main program.
2.3. Hybrid modelling after adding the multi-agent
LNG ship agent, channel agent and berth agent were added to the simulation model based on CA. Hence, an LNG ship traffic simulation model combining CA and multi-agent was constructed. In the model, the starting point and ending point are at the entrance of the channel, and the berth is a service model for unloading operations of the ship. The starting point is to generate ships according to the rules of the arrival of ships and to determine the type, size, and target berth distribution characteristics of the ships. Whether a ship enters the fairway is determined by the fairway determination rules and time determination rules. After loading and unloading operations, the operation time is determined by the size of the ship. After completion of the operation, whether the ship can depart is determined according to the channel conditions. The endpoint is an open boundary, and the ship sails directly out of the target area according to the evolution rules.
2.3.1. Update rules for LNG ship
When an LNG ship arrives at the channel entrance, the first step involves obtaining the status information from the berth multi-agent to determine the availability of a berth. The second step involves obtaining channel information from the channel multi-agent and determining whether the channel is empty, the berth is available, and channel conditions are suitable for the ship to enter the channel. Then the LNG ship is to update its location information, according to its speed and time. To reflect the impact of natural conditions on ship sailing, an additional random acceleration,  ${a_1}$, is added to the speed updating rule. The range of
  ${a_1}$ is set according to the data of constant wind direction, strong wind direction, and tidal current of the target channel.
LNG ship speed change rule:
 \begin{equation}{V_{\textrm{LNG}}}({t + 1} )= {V_{\textrm{LNG}}}(t )+ a + {a_1}\end{equation}
LNG ship location change rule:
 \begin{equation}{X_{\textrm{LNG}}}_{({i,j} )}^{\textrm{t + }1} = {X_{\textrm{LNG}}}_{({i,j} )}^t+{V_{\textrm{LNG}}}({t + 1} )\end{equation}
Cell state update rules:
 \begin{equation}\begin{aligned} \textrm{cel}{\textrm{l}_{s\textrm{tate}}}_{({i,j} )}^t & =\textrm{cel}{\textrm{l}_{s\textrm{tate}}}_{({i + 1,j} )}^t = \textrm{cel}{\textrm{l}_{s\textrm{tate}}}_{({i - 1,j} )}^t\\ & =\textrm{cel}{\textrm{l}_{s\textrm{tate}}}_{({i,j + 1} )}^t = \textrm{cel}{\textrm{l}_{s\textrm{tate}}}_{({i,j - 1} )}^t\\ & =1 \end{aligned}\end{equation}
2.3.2. Loading operation update rules
After the ship arrives at the berth, loading and unloading operations are initiated. At this time, the state of the target berth cell is always occupied, and the loading and unloading time is determined by the tonnage of the LNG ship and the corresponding operating time.
During the loading operation:
 \begin{align}&{V_{\textrm{LNG}}}(t )= {V_{\textrm{LNG}}}({t + 1} )= 0\end{align}
 \begin{align}&X_{\textrm{berth}}^{t + 1} = X_{\textrm{berth}}^t\end{align}
 \begin{align}&\textrm{cel}{\textrm{l}_{s\textrm{tate}}}_{({i,j} )}^t = 1\end{align}
2.3.3. Berthing and departure operations
When the ship arrives in its manoeuvring area, the state of all cells in its manoeuvring area is ‘occupied’, and when the ship's turning around operation is completed, the state of all cells in the manoeuvring area, with the exception of LNG ships, becomes ‘unoccupied’.
When the LNG ship completes the unloading operation and is ready to depart, the following conditions must be satisfied before the berthing operation:
(1) The traffic mode of the channel is a one-way departure, and the status of all channel cells is ‘unoccupied’;
(2) The departure of the ship is within the time frame specified by the maritime supervision department.
3. Simulation and analysis
Voyages under different conditions are simulated based on the established simulation model, CNOOC Tianjin LNG Terminal's different traffic organisation schemes, the number of berths for LNG ships, and the number of LNG ships. The model of the LNG terminal is compared with statistical results from actual operations. The reliability of the model is analysed and the simulation results are used to predict the capacity and channel saturation of the LNG terminal after the terminal initialises operations.
3.1. Profile of target area
In this study, the CNOOC Tianjin LNG Terminal was used as a simulation example. The terminal is located in the southeast of Dagukou Port District of Tianjin Port. Currently, the terminal has two LNG berths, one of which is used as floating storage and re-gasification unit (FSRU). For entry to and exit from the terminal, LNG ships rely on the Dagusha Channel of Tianjin Port which is shared with other ships, such as bulk carriers and container ships. Based on the latitude and longitude coordinates of the Dagusha Channel, a discrete channel model is established, as shown in Figure 3.

Figure 3. Channel discrete range
The Tianjin Maritime Regulatory Authority stipulates that LNG ships can only enter and leave the port from 08:00 to 12:00 h (other ships can enter and departure the port at any time), and other ships are not allowed to enter within 1 n mile and 500 m from the left and right. Furthermore, before the LNG ship enters the channel, the channel is cleared 2 h in advance, and the one-way control of the entry and exit channels is allowed. Furthermore, 0⋅5 h after the LNG ship enters the channel, other ships are allowed to follow the departure.
Adopting the traffic control method of clearing the road and allowing exclusive sailing to LNG ships is beneficial for ensuring the safety of the LNG ships. However, it leads to waste of resources, and affects the production and operation of other terminal berths. For ports with busy shipping lanes, control measures such as clearing roads and closing lanes often cause conflicts in the production schedules of LNG ships and other types of ships. Therefore, the number and times of LNG ships entering and departing the port is limited to a certain extent, and this affects the operation of other terminals in the Tianjin Port. This is mainly reflected in terms of the longer waiting times of the other ships. The operation process of an LNG ship entering and departing port is shown in Figures 4 and 5.

Figure 4. Process of LNG ship entering the port

Figure 5. Process of LNG ship departure
3.2. Analysis of traffic flow in target area
Information on the types of ships that sailed in the Tianjin Dagusha Channel from 1 to 31 December 2017 was collected collected, which is shown in Figure 6. In addition to LNG ships, they mainly included cargo ships, oil tankers, passenger ships, non-transport ships, as well as five other types. The size of the ships in the research area was classified according to the length of the ship, and it was divided into five categories: greater than 300 m, 200 m to 300 m, 150 m to 200 m, 90 m to 150 m, and less than 90 m (Figure 7).

Figure 6. Ship type distribution in December 2017

Figure 7. Ship length distribution in December 2017
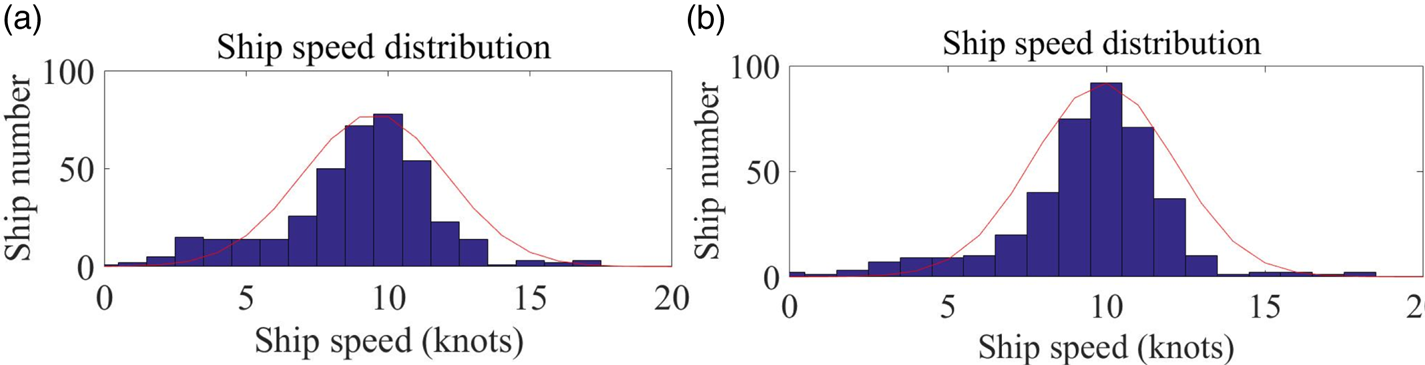
To analyse and study the speed distribution and changes of ships in this area, the speed distribution of the ships when entering and leaving each channel was calculated through the data of the ship's trajectory. The speed distribution of ships entering and leaving the Dagusha Channel is shown in Figure 8. Based on statistical analysis of the data on ships entering and leaving the port, the speed distribution of ships entering and leaving the Dagusha Channel exhibits a normal distribution. The maximum speed of entering ships is approximately 16 knots, the minimum speed is approximately 3 knots, the average speed is approximately 9⋅9 knots, and the R 2 (coefficient of determination) is 0⋅9434. The maximum speed of departing ships is approximately 17 knots, the minimum speed is approximately 2 knots, the average speed is approximately 9⋅51 knots, and the R 2 is 0⋅9829. The maritime authority stipulates that the maximum speed in the Dagusha Channel is 13 knots; a few ships broke the rules with speeds above 13 knots.

Figure 8. Speed distribution: (a) incoming speed; (b) departure speed
The interval distribution of ships in the Dagusha Channel is shown in Figure 9, which is more in line with the negative exponential distribution. Statistical results show that the maximum time difference between the arrival and departure of vessels in the Dagusha Channel is within 2 h. Furthermore, the average time difference between arriving ships is about 0⋅81 h, the R 2 is 0⋅8789, and the average time difference between departing ships is approximately 0⋅97 h, the R 2 is 0⋅9627.

Figure 9. Interval distribution: (a) ship arrival time distribution; (b) ship departure time distribution
3.3. Simulation condition setting
When considering the CNOOC Tianjin LNG Terminal as an example for simulation case analysis, three representative LNG ship types were selected. The specific ship type dimensions are shown in Table 1.
Table 1. LNG ship scale

At present, the terminal only allows LNG ships to enter and depart the port between 08:00 and 12:00 h. Based on the authors’ investigation and understanding of information supplied by maritime authorities and LNG receiving station operators, the following three traffic organisation schemes were simulated.
Plan A: LNG ships can enter and depart from 08:00 to 12:00.
Plan B: The entry time is set between 08:00 and 12:00, and the departure time is set between 08:00 and 15:00 (before 18:00, LNG ships cannot sail out of the fairway and are considered as ‘inaccessible fairway’).
Plan C: Ports of entry and exit 08:00 to 15:00 (if LNG ships cannot sail out of the fairway before 18:00, then they are considered as ‘unmovable fairway’).
Other ships can follow the LNG ship 0⋅5 h after it enters the channel, and the time range is from 00:00 to 24:00.
In terms of terminal operation time, depending on the type of ship, the gas transmission operation time of the LNG ship at the terminal also varies. According to the operating times for LNG ships at the CNOOC Tianjin LNG Terminal, the rules for setting the berth operation time are as follows:
 \[\textrm{Loading}\;\textrm{weight} \div 11,000 + 14\;\textrm{h }({\textrm{auxiliary}\;\textrm{operation}} )+ 4\;\textrm{h }({\textrm{random}\;\textrm{redundant}} ).\]
3.4. Simulation results
The simulation was conducted by setting the LNG berth of the LNG terminal as one and by conducting tests according to the remaining simulation conditions that are set. The simulation results are set out below; five of all the tests, test 1 to test 5 (Figure 12 and Figure 15), are selected to show the change trend of simulation results.
For LNG ships, when plan A is adopted as the traffic organisation scheme, the traffic capacity of LNG ships is 11 ships per month (Figure 10 and Figure 11). The impact of the increase in traffic flow is mainly reflected in the waiting times of other ships and the traffic capacity of LNG ships. The monthly traffic capacity of LNG ships is approximately 11⋅4 ships, and the traffic capacity of LNG ships will not decrease as the traffic flow increases. The impact of other ships is reflected in waiting times. The capacity of LNG ships is improved to approximately 13 ships per month when plan C is adopted, other ships were slightly affected compared with the other two conditions. However, the manifestation is not obvious.

Figure 10. Time and space diagram of all ships:(a) simulation result when plan A is adopted; (b) simulation result when plan B is adopted; (c) simulation result when plan A is adopted

Figure 11. Time and space diagram of LNG ships: (a) simulation result when plan A is adopted; (b) simulation result when plan B is adopted; (c) simulation result when plan A is adopted

Figure 12. Arriving LNG ships and completed entry and departure of LNG ships:(a) simulation result when plan A is adopted; (b) simulation result when plan B is adopted; (c) simulation result when plan C is adopted
After setting the berths of the LNG terminal to two, the simulation was performed again, and the results are shown in Figure 13 and Figure 14. According to the simulation results, in the case of two berths, the maximum traffic capacity of LNG ships is 21⋅5 ships/month when plan A is adopted. However, when plan B is adopted, the traffic capacity of LNG ships is not significantly improved (Figure 16). If a ship's waiting time of more than 1 h is considered as the standard effect created by LNG ships, then if plan C is adopted as the traffic organisation scheme, the arrival and departure of LNG ships will affect more than 15% of other ships.

Figure 13. Time and space diagram of all ships: (a) simulation result when plan A is adopted; (b) simulation result when plan B is adopted; (c) simulation result when plan C is adopted

Figure 14. Time and space diagram of LNG ships: (a) simulation result when plan A is adopted; (b) simulation result when plan B is adopted; (c) simulation result when plan C is adopted

Figure 15. Arriving LNG ships and completed entry and departure LNG ships:(a) result when plan A is adopted; (b) result when plan B is adopted; (c) result when plan C is adopted

Figure 16. Simulation results
3.5. Result analysis
At present, CNOOC Tanjin LNG Terminal adopts the first transportation organisation scheme (plan A). According to data provided by the receiving station staff, the unloading operation of 11 LNG ships can be completed at the maximum time each month. This is almost the same as the simulation results, which verifies the accuracy of the LNG ship traffic simulation model based on CA and multi-agent. According to the simulation results, under the current traffic flow conditions, the realisation of the maximum traffic capacity of LNG ships affects the efficiency of the entry and departure of other ships to a certain extent. This is reflected in the average waiting time for entry and departure.
The simulation results show that when the LNG terminal has one LNG berth, the unloading operation of 11 LNG ships can be completed in a month with plan A and an average of 11⋅4 LNG ships can be unloaded in a month when plan B is adopted. When plan C is adopted, the traffic capacity of LNG ships is the largest, reaching 13 ships. When the LNG receiving terminal has two LNG berths, the simulation results show a similar pattern.
The simulation results of various working conditions all show that the increase in traffic capacity of LNG ships in plan C is the most obvious. From Tables 2–7, it can be found that due to the fact that other ships can enter and depart at night, the waiting time of other ships does not increase significantly when plan C is adopted as the traffic organisation scheme. The overall operating efficiency of the Tianjin Port area is less affected and within the acceptable limits.
Table 2. Ship latency time when plan A is adopted (1 LNG berth)

Note: LN = LNG ship number; TN = total number of ordinary ships.
Table 3. Ship latency time when plan B is adopted (1 LNG berth)

Note: LN = LNG ship number; TN = total number of ordinary ships.
Table 4. Ship latency time when plan C is adopted (1 LNG berth)

Note: LN = LNG ship number; TN = total number of ordinary ships.
Table 5. Ship latency time when plan A is adopted (2 LNG berth)

Note: LN = LNG ship number; TN = total number of ordinary ships.
Table 6. Ship latency time when plan B is adopted (2 LNG berth)

Note: LN = LNG ship number; TN = total number of ordinary ships.
Table 7. Ship latency time when plan C is adopted (2 LNG berth)

Note: LN = LNG ship number; TN = total number of ordinary ships.
4. Conclusions
In this study, a novel traffic simulation model is constructed, which is based on the combination of CA and multi-agent. The model is used to carry out simulation tests under various working conditions, and the traffic capacity of LNG ships in the port area under different traffic organisation schemes is studied. Through the analysis of simulation results, it can be found that the LNG ship hybrid simulation model proposed in this study can reflect the special traffic rules of LNG ships, and reflects the impact of LNG ships on other ships when entering and departing. At the same time, the simulation results can provide an effective reference for the maritime authorities to conduct more efficient traffic organisation.
With the acceleration of the project of changing fuel from coal to natural gas in China, LNG has received widespread attention as one of the more environmentally friendly and clean energy sources. Hence, higher requirements have been put forward for LNG berth construction planning and transportation organisation. With the construction of LNG berths in the future and development of the LNG ship transport industry, the rational organisation of ship traffic in the channel, rational planning and utilisation of LNG berths are expected to face more problems. Therefore, it is necessary to simulate the construction and operation of LNG terminals via simulation methods. Simultaneously, it is necessary to continuously track the construction of LNG terminals, development of LNG ships, development of relevant management specifications, and corresponding traffic organisation and management of the terminals.
Acknowledgements
This study was supported by the National Key R&D Program of China (2018YFC1407404), National Natural Science Foundation of Hubei Province (No. 2019CFB339), Fundamental Research Funds for the Central Universities (WUT: 2018IVA013), Science and Technology Department of Hubei Province (No.: 2019AHB053).