


1. Introduction
Substantial disparities in health status between socioeconomic groups have been reported in all countries with available data [Marmot and Wilkinson (Reference Marmot and Wilkinson2006)]. Their persistence is one of the main challenges for public health policy, as evidenced from the fact that a reduction (by 25%) of these disparities is among the core policy targets proposed by the World Health Organization. It is less clear, however, whether such a reduction can plausibly be achieved. One way to estimate the scope for reducing health disparities is to study cross-country differences in their size.
Cross-country comparisons of within-country disparities in longevity are relatively rare as their analysis requires comprehensive data and complex data treatments. Previous comparative studies comparing the magnitude of disparities in mortality by educational level or occupational class have reported substantial differences in the magnitude of disparities between European countries [Mackenbach et al. (Reference Mackenbach2008), van Raalte et al. (Reference van Raalte2011, Reference van Raalte2012)]. However, comprehensive studies on the longevity gap by socioeconomic characteristics across a large number of high-income countries are rare, especially those including non-European countries [e.g., van Hedel et al. (Reference van Hedel, Avendano, Berkman, Bopp, Deboosere, Lundberg and Mackenbach2015), Tanaka et al. (Reference Tanaka, Nusselder, Bopp, Brønnum-Hansen, Kalediene, Lee, Leinsalu and P.2019)].
This article aims to fill this knowledge gap by reporting uniformly calculated estimates of educational differences in longevity in 18 high-income countries, all members of the Organization for Economic Cooperation and Development (OECD). The OECD has, over the past decade, developed a keen interest in various aspects of inequality, providing overviews of inequalities in income, educational achievement and wealth in its member countries [OECD (2015)]. More recently, it has taken the initiative to collect data on inequalities in longevity by education through a network of national contact points in various countries, which have provided detailed semi-aggregated tables based on common specifications [Murtin et al. (Reference Murtin2017)]. Non-European countries covered by this initiative are Australia, Canada, Chile, Israel, New Zealand, and the United States (US). Inclusion of the US in these comparisons is of particular interest, not only because it provides a useful benchmark for the US itself, but also more generally because it shows whether or not the US—with comparatively large income inequalities and without universal health coverage—has larger health inequalities than those prevailing in European countries featuring more extensive welfare states.
The measurement of health inequalities, and more specifically inequality in mortality and longevity, is linked to very important public policy issues at the crossroad of health, social, and economic policies. First, premature and avoidable mortality implies a significant economic cost to individuals and a loss in social welfare. Premature mortality, as measured by “potential years of life lost” (PYLL), was on average 3,700 years per 100,000 inhabitants aged 0–69 in 2009 (OECD Health Database).Footnote 1 The social cost of premature mortality is large: even a conservative valuation of USD100,000 per life-year would yield an equivalent cost of USD3,700 per person aged 0–69 (Murphy and Topel, Reference Murphy and Topel2005). Likewise, the wide dispersion in ages at death across individuals (including after age 70) generates large differences in welfare within countries. For instance, Mackenbach et al. (Reference Mackenbach, Meerding and Kunst2011) estimated that there are more than 700,000 avoidable deaths and 33 million preventable cases of ill-health in the European Union every year. The estimated economic losses due to these premature deaths may amount to 1.4% of GDP (or EUR141 billion); this is equivalent to 15% of the costs of social security systems and 20% of the costs of health-care systems in these countries [Mackenbach et al. (Reference Mackenbach, Meerding and Kunst2011)].
Second, inequalities in mortality and life expectancy are structured along socio-economic lines, with many behavioral, psycho-social, and material factors at play [see Bartley (Reference Bartley2016), for an extensive comparative analysis with a life-course perspective]. In most OECD countries, there is evidence of large differences in longevity across socio-economic groups, as the less educated people live shorter lives than those having attained higher education. This implies that longevity and income inequalities reinforce each other and potentially yield a very high level of inequality in “full income” across educational groups [Murtin and Diaz (Reference Murtin and Diaz2020)].
While existing data on socio-economic mortality differentials show evidence of significant “social gradients”, these estimates are affected by differences in population coverage (entire populations, regions, or samples), type of underlying data (register-based, census-linked, or cross-sectional unlinked data), socio-economic classifications of the deceased (income, occupation, education), summary indicator of health conditions used, and more. This paper aims to remedy this situation by providing detailed mortality estimates by educational attainment, gender, and cause of death. These estimates are calculated based on the same method and for more countries than those covered by other studies on this topic. The paper also discusses some important data quality issues which affect the comparability of existing measures, and provides suggestions for further improvements in the quality of data on inequalities in longevity. In the process, the paper opens the “black box” of longevity calculations, reviews methodological and data issues, and compares estimates from this data collection to those drawn from Eurostat.
While the main focus of the paper is on differences in longevity by level of education, different proxies of socio-economic status (henceforth SES) have been considered by other epidemiological studies. For instance, Banks et al. (Reference Banks, Marmot, Oldfield and Smith2006) for the United Kingdom and Blanpain (Reference Blanpain2016) for France rely on the measures of life expectancy by occupation; and Chetty et al. (Reference Chetty, Stepner, Abraham, Lin, Scuderi, Turner, Bergeron and Cutler2016) analyze life expectancy by income percentiles of the US. The concept of SES is multi-dimensional and different breakdowns by income, occupation, or education may provide different pictures. One reason for selecting education as the most relevant “conditioning” variable is that the risk of “reverse causality” is weaker when looking at the relationship between adult health and education,Footnote 2 compared to the two-way relationship between health and income for instance.Footnote 3 However, relationships between education and longevity are complex and are also related to the skills gained at early stages of life. These skills not only largely predetermine occupation, income, and other socio-economic characteristics at later stages of life, but also contribute to individual health-related life styles, disease risk profiles, and psychosocial characteristics.
The main results of the paper are as follows. First, on average, across the countries covered in the analysis, the gap in life expectancy at age 25 years between high and low-educational groups is 7.6 years for men and 4.8 years for women. At the age of 65, these gaps are 3.6 years for men and 2.6 years for women, implying that relative inequalities in longevity increase with age. Gaps in life expectancy by education are especially large in Latvia and Poland, while they are comparatively low in Italy.Footnote 4 Second, other measures of inequalities in longevity by education (such as country averages of age-standardized mortality rates and the slope index of inequality) do not significantly change the assessment relative to one based on life expectancy measures. Third, differences in longevity between groups with low and high-educational attainment account, on average, for around 10% of overall inequalities in ages of death; this implies that eliminating average differences in longevity across groups with different education does not imply eliminating all differences in mortality across people. Also, within-group inequality in ages at death is larger among low-education people than among highly educated people, mainly reflecting higher premature mortality. Finally, cardiovascular diseases are the first cause of death for all gender and education groups after age 65 years, and the first cause of mortality inequality between the high and low-education elderly.
The paper is structured as follows. Section 2 describes the data, section 3 presents the estimates of longevity inequalities between educational groups, while section 4 describes inequalities within groups. Section 5 looks at specific causes of death, while section 6 provides some discussion of the results and the last section concludes.
2. The data
This section highlights the data's general characteristics and describes their treatment in detail.
2.1 The sample of countries
Data files on mortality and population by gender, age (25 years old and over), educational attainment (5 levels, based on the ISCED 1997 classification) and causes of death (4 causes, namely circulatory, external, neoplasm, and other diseases) were collected by the OECD Statistics and Data Directorate for 22 countries and several years around 2011, based on a detailed questionnaire sent to national contact-points in the National Statistical Offices and other public agencies that routinely collect these types of data. This involves a very large number of mortality rate observations by population group, namely more than 450,000 data points.
For the purpose of calculating the indicators reported in this article, the education categories “no schooling” and “primary and lower secondary” were merged to form the category “Low level of education”. The “Middle level of education” category is composed of the “upper-secondary” and “post-secondary non-tertiary” education reported by country contact-points, while the “High” level category is composed of people with tertiary education. These three categories refer to the highest attained completed education. The 5th category “Missing education” is treated as explained below.
The data were compiled in different ways by national correspondents, as 14 countries (Australia, Austria, Canada, Denmark, Finland, France, England and Wales, Israel, Italy, Latvia, Norway, New Zealand, Slovenia, Sweden) used a “linked design”, where socio-economic information on the deceased is retrieved by applying the linkages between individual death records and the corresponding records from the most recent population census or administrative registers. Conversely, 8 other countries used a “cross-sectional” (unlinked) design, where information on the socio-economic characteristic of the deceased is drawn directly from death certificates, as reported by relatives or public officials. In the case of census-linked design, the population exposure (i.e., the population at risk of dying in any given year) used to estimate education-specific death rates is derived by counting total person-years lived between the census and date of death (if died) or end of observation (if survived). For cross-sectional unlinked design, population exposure simply refers to the education-specific population counted directly from the most recent census. Only 4 of the 8 countries that provided data based on a cross-sectional design are included in the estimates reported in this article.Footnote 5 Data for Belgium and the Czech Republic were excluded due to the high share of people with missing education in death registers (over 45%); Mexico and Turkey were excluded as the registration systems of these two countries provide only partial coverage of the number of deaths [WHO (2016)]. In total, the final dataset used for analyses covers 18 OECD countries, including 6 non-European countries, and 13 countries with available data on cause of death.
Table 1 describes the meta-characteristics of the data used in this paper. Death and population data are classified by single year of age of the deceased, with the only exceptions of Australia, the United Kingdom, New Zealand, and the US, whose data are classified by 5-year age groups. To increase robustness and comparability with these countries, single-year data have been aggregated into 5-year age groups for all countries (see below). To extend the country coverage of this article, we include estimates based on “cross-sectional” data for 4 countries (the US, Chile, Hungary, and Poland), but only after having undertaken extensive checks on the quality of these estimates (described below). Finally, data on causes of death are available for 13 countries.
Table 1. Countries and data sources included in the analysis

The distribution of the adult population (i.e., those above 25 years of age) by educational attainment (i.e., the highest level of education completed) varies significantly across countries as well as across gender and age groups. Table 2 reports these characteristics for two broad age groups (25–64 years and 65–89 years), separately for men and women, as used in this article.
Table 2. Distribution of adult population by educational attainment, gender, and age

Source: National population registers.
Educational attainment is substantially higher for the younger cohort (25–64 years), especially for women. For instance, the share of women with high education varies from about 13% in the older cohort to 31% in the younger cohort; the corresponding values for men are 19% and 25%. These gender differences reflect the fact that women lead in terms of higher educational attainment among younger generations, while the opposite is true among the older generation. This shift in educational attainment across generations raises comparability issues across time and space that are discussed later in this paper.
2.2 The treatment of missing education
Table 2 also shows that in 6 countries, some fraction of population exposure and of the deceased population are reported as having unknown educational attainment. These people were allocated to other educational groups in proportion to the observed distribution of the deceased by education and gender. A sensitivity analysis shows that the equidistribution of people with “missing education” had a negligible impact on the results compared to another scenario where these people are all allocated to the group with low education. Whether the group with “missing education” is equidistributed across other educational groups or is entirely allocated to “low education”, the average difference in estimated longevity is less than 0.2 years (Figure 1).

Figure 1. Differences in estimated longevity at age 25 between two treatments of data for people whose education is reported as “missing”. Imputation of category “missing” to low education versus equidistribution.
Source: Authors' calculation. The unit of the y-axis is the number of years.
In this article, the “equidistribution assumption” is used as a benchmark, and the group with missing education is distributed across other educational categories for each age and gender group. The same assumption is made by Eurostat, the statistical office of the European Union, in its own data collection in this area.
2.3 The volatility of annual mortality rates and the use of abridged life tables
As the mortality rates by education and by gender referring to a single year are often volatile across age groups due to small numbers of deaths, especially at higher ages, the data of the number of deaths and population exposure were pooled, both across years of observation and across ages of death (into 5-year age groups). This procedure allowed to diminish volatility of education-specific rates in some age groups.
Even in a country with high-quality data such as Sweden, which displays few missing education data and relies on a census-linked methodology, the mortality rates for detailed education/age/gender groups derived from a single year of observation and from annual age frequency are volatile, especially at lower ages (Figure 2A). To remedy this problem, the analysis in this article refers to people grouped into 5-year age bands and pools several years of observation. This procedure yields smoother mortality rates as shown in Figure 2B. For example, in the case of Sweden, this approach allows using 25 times more observations in the pooled data (5-year age band times 5 years of observation) relative to the case of single year of age of the deceased and single year of data. This pooling methodology offers two additional advantages: first, it increases comparability with those countries whose death data were provided as 5-year groups; and, second, it increases the robustness of the estimates, especially when mortality data are broken down by cause of death.

Figure 2. Log mortality rates of Swedish males (A). Age-specific death rates by single year of age for single year of observation (2012) (B). Age-specific death rates classified by five-year age group for multiple years of observation (2010–2014).
Source: Authors' calculation.
2.4 Regularization of mortality rates at older age
The data pooling methodology does not solve all data issues. There are two types of remaining issues: (i) implausible cross-overs in mortality rates: this refers to implausible sudden declines or increases in mortality rates at some (usually) old ages, which produce cross-overs in group-specific mortality rates. For instance, people with medium education above a certain age may suddenly display higher mortality rates than people with low education. In theory, mortality cross-overs between different educational groups are possible, but they usually occur at very high ages after some gradual convergence; (ii) misreporting of mortality rates: this problem reflects the very small number of deceased people especially at older age, when the numbers of deceased and living people shrink to close to zero. This problem takes various forms: abnormally low mortality rates for some groups of prime-age people in Israel (for medium and high education at young age) and Hungary (medium education after age 65), with random fluctuations in a very small number of deaths (i.e., a numerator problem); mortality rates declining with age beyond 90 or 95 years, as observed in Chile, Denmark, Finland, Hungary, Israel, Latvia, Poland, and Slovenia. These suspect patterns indicate some potential problems in the data. Although some research suggests that the growth of mortality rates with respect to age decelerates after the age of 90–100 years, there is no evidence about sudden drops in mortality rates.
The small number of observations at older age has led Eurostat to restrict the calculation of longevity across educational groups to the 25–74 years age group. While this procedure avoids the problem of small number of deaths at higher ages, it also neglects differential mortality after age 75. While this problem is perhaps less important for the calculation of longevity at age 25 (the measure preferred by Eurostat), as this measure is less sensitive to mortality differentials at very old age, it becomes a critical issue for the calculation of longevity at age 65 and for the accurate evaluation of differences across educational groups, which have implications for the design and fairness of pension systems for instance.
This article departs from the “censoring practice” used by Eurostat to take into account mortality differences after age 75 years. The key reason to do so is that the data appear to be of good quality until age 90 or 94 years in most countries. In practice, the age profile of mortality after age 94 is fitted with the help of a classical Gompertz model where, for each gender i and education groups j, the following relation is estimated:

where m i,j,tis the mortality rate of group (i,j) at age t (taken as equal to the middle of the 5-year age group). This regression is run between age 70 and 94 years in order to focus on the mortality age profile at older ages. Then, the predicted mortality rates are selected after age 95 and combined with the observed mortality rates between 25 and 94 years. As shown in Murtin et al. (Reference Murtin2017), the Gompertz model fits the pooled data well, overall and especially over the 70–94 years age band, over which the mortality age profile is almost linear.
Addressing the problem of mortality cross-over is more difficult, as this problem stems from the low quality of the raw data due to misreporting of education observed especially, but not always, at older ages. In this case, observations that were deemed to be “dubious” were replaced after some age threshold by log-linear extrapolations of mortality rates. In some cases, the censoring was done at relatively low ages; this implies that, in these cases, the estimates reflect a significant degree of imputations and should be taken with caution. Countries whose data have been censored are: Chile (after 65 years for high education, and between 65 and 75 years for women with medium education); Hungary (between 65 and 80 years for men with low and medium education); Norway (before age 34 years for medium and high education); and Israel (before age 34 years for medium and high education). For all countries, annual mortality rates were censored upward at a maximum rate of 50% per year.
More specifically, US death data, which is based on a different educational classification than ISCED, has received a specific treatment identical to that proposed by Rostron et al. (Reference Rostron, Boies and Arias2010), which is carefully described in Annex A.
Finally, life expectancy at age 25 and 65 is calculated for each gender and education group using the abridged life tables formula proposed by Chiang (Reference Chiang1984). When calculating life expectancy with the Chiang formula, the fraction of time lived in the last age interval of life is assumed to be 0.5, except for the age group 115–119 years where it is assumed to be equal to the inverse of the mortality rate.
3. Inequalities in life expectancy and mortality risk by education and gender
The gap in life expectancy between education groups is the main measure of inequality in longevity used in this article. As complementary measures of inequalities in longevity, we consider (absolute and relative) measures of inequality in age-standardized mortality rates, i.e., the absolute difference in, and the ratio of, age-standardized mortality rates by education, averaged over the population aged 25–89.
Also, to obtain the measures of mortality inequality in longevity that are not affected by the shape of the distribution of the population by education, we further use the “Slope Index of Inequality” (labeled as SII) and its relative version, the Relative Index of Inequality (denoted as RII), as described by Mackenbach and Kunst (Reference Mackenbach and Kunst1997). The SII consists of the absolute difference in age-standardized mortality rates between the best and worst ranked individuals in the education distribution, while the RII is equal to the SII divided by the average age-standardized death rate for the entire (total) population.
While the previous indices capture inequality in longevity between population groups, we also report on total inequality in ages-at-death via the Theil index [van Raalte et al. (Reference van Raalte2011, Reference van Raalte2012)], which allows breaking down educational inequality in longevity into between and within-group contributions.
At age 25, life expectancy is always higher among the high than among the mid educated, and among the mid than among the low educated (Table 3). Differences between countries are large. For example, the lowest life expectancy among high-educated men is observed in Latvia (52.5 years); this level, although substantially higher than that of low-educated men in the same country (41.0 years), is lower than the life expectancy of low-educated men in Australia (52.6 years), Canada (54.4 years), England and Wales (53.8 years), Israel (53.5 years), Italy (54.2 years), and Sweden (52.7 years). In the US, the life expectancy of high-educated men and women (56.2 and 58.4 years, respectively) is somewhat lower than the average observed across all countries for the same educational category (57.1 and 60.5); the US disadvantage is much greater for low-educated men and women (46.2 and 51.5 years) as compared to the corresponding average across all countries (49.5 and 55.7 years).
Table 3. Life expectancy at age 25 by education around 2011, by gender

Source: Authors' calculation based on OECD data.
On average, across all countries covered by the analysis, the gap in life expectancy at age 25 years between high and low-educated people is 7.6 years for men and 4.8 years for women (Figure 3). The size of this gap varies between 4.1 years in Canada and 13.9 years in Hungary for men, and between 2.5 years in Italy and 8.3 years in Latvia for women. Among men, the gap is large in Hungary, Poland, Latvia, Chile, and the US, and small in Canada, Italy, Great Britain, and New Zealand. Among women, patterns are partly different, with larger disparities in Latvia, Chile, and the US (but not in Hungary and Poland), and smaller disparities in Canada, Italy, Austria, and France (but not in Great Britain and New Zealand). In the US, the gap is considerably larger than the average for other countries for both men (10.0 years) and women (7.0).

Figure 3. Life expectancy gap between the highest and lowest educational groups at the age of 25.
Source: Authors' calculation based on OECD data. The unit of the y-axis is the number of years.
Estimates for life expectancy at the age of 65 can be found in Annex B. At this higher age, the gap between high and low educated is still substantial: the average gap in life expectancy at the age of 65 years for all countries is 3.6 years for men and 2.6 years for women. Relative to average life expectancy, health inequalities are relatively larger at age 65 than at age 25, for both males and females. For instance, on average across countries, the gap among males represents 20.7% of life expectancy at age 65, vs. 14.3% of life expectancy at age 25. Importantly, the gap in life expectancy at age 65 has been underestimated by previous Eurostat estimates (see Annex C).
These disparities in life expectancy are the result of higher mortality rates among the low educated in all age groups. As shown in Figure 4, when we look at the underlying disparities in mortality rates, we find a very similar ranking of countries, regardless of whether we measure absolute disparities (as in the SII) or relative disparities (as in the Relative Index of Dissimilarity). This is because average mortality rates tend to be higher in countries that have larger relative disparities in mortality, such as Hungary, Poland, Latvia, and Chile. Both absolute and relative disparities in mortality rates are smaller among women than among men, but the differences between men and women are less striking in New Zealand, England, and Wales as well as Sweden where relative disparities are almost as large among women as they are among men.

Figure 4. Slope index and relative index of inequality.
Source: Authors' calculation based on OECD data. The SII consists of the absolute difference in age-standardized mortality rates between the best and worst ranked individuals in the education distribution. The unit of the y-axis for SII is the number of deaths for 100,000 person-years. The RII is equal to the SII divided by the average age-standardized death rate for the entire (total) population.
4. Total inequality in ages-at-death
Although differences in life expectancy, and thus in average age-at-death, between education groups are substantial, they only account for a small part of the total variation in age-at-death between all individuals in the population. We have quantified the total variation in ages-at-death using the Theil index, which can be interpreted as measuring how far off the population is from the state when everyone dies at the same age. The higher the Theil index, the further away the population is from this situation. When we compare countries based on their Theil index, as in Table 4, the largest variations in ages-at-death are found again in Hungary, Poland, Latvia, and the US. When the Theil index is decomposed into its two components of “within-group inequality” (i.e., the variation in ages-at-death between individuals within the same education group) and “between-group inequality” (i.e., the variation in ages-at-death between different education groups), we find the first to be much larger than the second. Between-group inequality accounts, on average, for 7.6% of total variation in ages-at-death. Countries where this proportion is larger than average include Hungary, Poland, Latvia, and Chile, but not the US.
Table 4. Theil's index of lifespan inequality (×100) by country

Source: Authors' calculation based on OECD data.
The relatively lower life expectancy of the low educated is the consequence of a larger variation in ages-at-death among this group as compared to the high educated. Higher mortality before the modal age-at-death, i.e., premature mortality, mainly explains the lower life expectancy of the less educated. This can be seen in Figure 5, which shows the distribution of ages-at-death among the low, the mid, and the high educated in a few selected countries. In Hungary and the US, dispersion of the age-at-death is larger than in Canada and Australia, particularly among the low educated, among whom a much larger fraction of deaths occurs at younger ages.

Figure 5. Lifespan distributions by education for males in selected countries around 2011.
Source: Authors' calculation based on OECD data.
5. Mortality disparities by cause of death
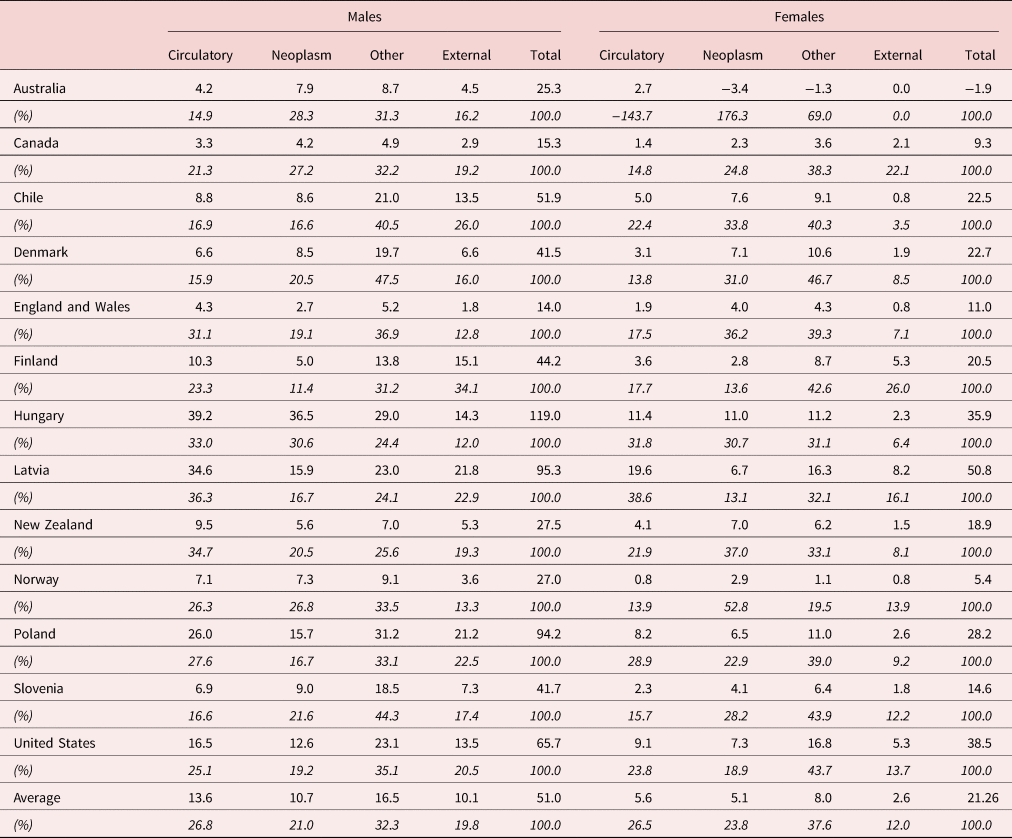
For 13 out of 18 countries, we also obtained data on mortality by cause of death. Cardiovascular diseases are the most important cause of death of both men and women in all countries. However, cardiovascular diseases do not explain the bulk of mortality disparities among the population aged 25–64 years (Table 5). In most countries, “other diseases” account for most of these mortality differences (32% for men and 38% for women), followed by cardiovascular diseases and neoplasms (which contribute around 27% each to the rates' difference for both men and women). Larger-than-average disparities in total mortality in the US arise from larger-than-average disparities for all major cause-of-death groups, but the difference is particularly striking for “other diseases”. For the population aged 65 years and more, cardiovascular diseases are the main factor explaining the mortality gap between educational groups, as they contribute 41% of the difference in mortality for men, and 47% for women (see Annex B Table B.2); the second main contribution is that of “Other causes” (25% for men and 17% for women), followed by neoplasms.
Table 5. Difference in mortality rate by causes of death between high and low-educated prime-age adults aged 25–64 years
Source: Authors' calculation based on OECD data.
6. Discussion
This paper is based on the collection of new data on mortality and population by age, gender, education, and causes of death for 18 OECD countries. It is the first time that data on inequalities in mortality (and life expectancy) by education have been brought together for such a wide range of countries, encompassing not only Western and Eastern Europe, but also high-income countries in North and South America, as well as Israel, Australia, and New Zealand. Relative to other institutional data sources, the OECD database has several important advantages. For example, a similar Eurostat database [Eurostat (2015)] provides mortality estimates by education derived from labor force surveys covering the population up to the age 75 only. Above this age, a very restrictive assumption is used assuming the same mortality rates for all educational groups (also see Annex C). An important advantage of the OECD database is to include thorough data quality checks and treatment of people with missing education.
Patterns of mortality inequality by education within Europe have been reported before, but they are mostly available for European OECD countries [Mackenbach et al. (Reference Mackenbach, Valverde, Artnik, Bopp, Brønnum-Hansen and Deboosere2018)]. These analyses highlighted large and increasing inequalities in some Eastern European countries during the 1990s [Mackenbach (Reference Mackenbach2016)].
The major contribution of this study concerns the comprehensive and systematic international comparison of mortality disparities by education between the European and larger set of non-European countries. We found that Australia and New Zealand show similar or even smaller mortality disparities than the European average, whereas the disparities are much higher in the US and Chile. The unfavorable situation in the US confirms the results of previous studies which were based on a smaller selection of countries [van Hedel et al. (Reference van Hedel, Avendano, Berkman, Bopp, Deboosere, Lundberg and Mackenbach2015)]. The US case is particularly interesting because of high mortality disparities that occur in the context of overall worsening life expectancy and midlife mortality [Case and Deaton (Reference Case and Deaton2015), Ho and Hendi (Reference Ho and Hendi2018)]. Furthermore, this mortality crisis seems to be disproportionally affecting low-educated people [see Olshansky et al. (Reference Olshansky2012), Hummer and Hernandez (Reference Hummer and Hernandez2013), Hendi (Reference Hendi2015), Sasson (Reference Sasson2016), Hendi (Reference Hendi2017)]. This worrying trend can be largely explained by rising midlife mortality due to the so-called “deaths of despair”, which include substance use, cirrhosis, and suicide [Case and Deaton (Reference Case and Deaton2017), Murthy (Reference Murthy2017), Murray et al. (Reference Murray2018)]. A more recent study suggests that all racial groups are affected, which signals a fundamental problem affecting population health in the US [Woolf et al. (Reference Woolf, Chapman, Buchanich, Bobby, Zimmerman and Blackburn2018)].
Disparities in ages-at-death between education groups account for only a relatively small fraction of the total variation in lifespan within countries [Van Raalte et al. (Reference van Raalte2012)]. We confirm that this pattern is also applicable to other non-European countries besides the US. This result suggests that there are plenty of factors other than education that contribute to the dispersion of lifespan within populations, such as genetics, exposure to various risk factors (health-related behaviors, air pollution, occupational risks), or simply bad luck. These results do not imply that disparities in life span by level of education are irrelevant for public health policy.
We found that mortality from “other diseases” (than cardiovascular disease and cancer) accounted for most of the disparities in mortality between education groups before age 65, while circulatory problems account for a large share of mortality inequalities after age 65. The heterogeneous category of “other diseases” includes diabetes; chronic obstructive pulmonary disease; infectious diseases such as pneumonia, tuberculosis, and HIV/AIDS; alcohol-related health problems; and opioid-involved poisoning. Some of these diseases may reflect disparities in access or quality of medical care, whereas others may reflect the effect of disparities in smoking, excessive alcohol consumption, obesity, or mental health.
Although we believe the results as reported in this paper are robust, future work should seek to further harmonize data collection, with a gradual move toward “linked design” [Sorlie and Johnson (Reference Sorlie and Johnson1996), Jasilionis et al. (Reference Jasilionis2012), Rey et al. (Reference Rey2013)], and a larger country coverage. Besides, the classification of educational attainment could be refined to include more categories and similarly for causes of deaths. The next OECD data collection that should take place in the future may provide these additional details while preserving comparability with these results. Although we took several steps in harmonizing the data (including redistribution of missing education cases), the results for the countries using “cross-sectional unlinked” data should be treated with caution.
Finally, this analysis has several limitations. First, socio-economic inequalities in health are limited to one socio-economic status, namely educational attainment, which may reflect several compounding factors [Bartley (Reference Bartley2016)] such as behavioral and cultural causes as well as personal characteristics (self-control, risk behaviors linked to smoking, alcohol consumption, poor eating habits); psychosocial factors such as stress, social situation, and “job strain” (related to not having autonomy at work); income and living conditions. Second, the data were not fully homogeneous across countries in terms of sampling methodology, time coverage, and data quality (e.g., missing education, volatility of mortality age profiles).
7. Conclusion
This study presents new harmonized data on mortality and population by age, gender, education, and causes of death for 18 high-income OECD countries. This is one of the largest international comparisons of socio-economic mortality inequalities in developed countries covering the most recent period. The findings highlight large variations in mortality inequalities across the countries. The study points to an unfavorable position of the US, where disproportionally high excess mortality of lower educated people coincides with stalling or even declining life expectancy. However, the three countries in the Central and Eastern European region (Latvia, Hungary, and Poland) and Chile show the worst positions in both the magnitude of inequalities and overall life expectancy levels.
The main findings based on life expectancy are further confirmed when using other inequality measures including slope indexes that account for sizes of educational groups and measures of lifespan disparity. Using more advanced measures of inequality did not make any substantial changes in the country rankings according to the level of inequality. Interestingly, we observed that with the exception of the three former Central and Eastern European countries and Chile, educational inequality in lifespan explains relatively little part of overall inequality in age at death. As expected, cardiovascular diseases are the largest contributors to the mortality inequalities at old ages, whereas other diseases (including external and alcohol-related causes of death) are the biggest contributors to the mortality inequalities below the age 65. Despite some commonalities in age- and cause-specific patterns, large variations in the magnitude of mortality inequalities are still poorly understood and call for more in-depth research.
Acknowledgements
This paper draws on the following OECD Working Paper: Murtin et al. (Reference Murtin2017), “Inequalities in longevity by education in OECD countries: Insights from new OECD estimates”, OECD Statistics Working Papers, 2017/02, OECD Publishing, Paris. http://dx.doi.org/10.1787/6b64d9cf-en. Since the release of this working paper, the authors have revised the estimates for some countries (including the United States) in order to take into account new insights in the classification of the mortality data by national statistical offices. The data files available on the OECD website reflect these later revisions. The authors wish to thank Angus Deaton (Princeton University), Martine Durand (OECD Statistics and Data Directorate), and Gaetan Lafortune (OECD Directorate for Employment, Labour and Social Affairs) for their comments. A previous version of this paper was presented and discussed by Delegates at the OECD Committee on Statistics and Statistical Policy on 25–26 April 2016. The report has been made possible by the invaluable contribution from country correspondents. The detailed data used to generate the estimates of inequality in longevity by education were kindly provided by: Paull Hoffmann for Australia; Johannes Klotz for Austria; Michel Willems for Belgium; Michael Tjepkema for Canada; Jaime Espina Ampuero for Chile; Roman Kurkin for Czech Republic; Kamilla Heurlen and Susanne Mainz Soerensen for Denmark; Veronica Corsini for Eurostat; Pekka Martikainen for Finland; Nathalie Blanpain for France; András Wéber for Hungary; Naama Rotem and Ari M. Paltiel for Israel; Luisa Frova, Gianfranco Alicandro and Gabriella Sebastiani for Italy; Ieva Zemeskalna and Sigita Sulca for Latvia; Rafael Lozano Ascencio for Mexico; Joel Watkins for New Zealand; Emil Lahlum for Norway; Małgorzata Gniewaszewska for Poland; Neonila Foltanova for Slovak Republic; Sonja Tomsic for Slovenia; Örjan Hemström for Sweden; Mehmet Günal for Turkey; Chris White for the United Kingdom; Robert Anderson and Arialdi M. Minino for the United States. The permission of the Office for National Statistics to use the Longitudinal Study is gratefully acknowledged, as is the help provided by the staff of the Centre for Longitudinal Study Information & User Support (CeLSIUS). This article contains statistical data from ONS which is Crown Copyright. The use of the ONS statistical data in this work does not imply the endorsement of the ONS in relation to the interpretation or analysis of the statistical data. The authors alone are responsible for the interpretation of the data.
Conflict of interest
None.
Annex A
Treatment of US data
US death registers use two types of education classification, either grade-based or degree-based. After discussion with OECD experts on the US education system, grades and degrees were allocated to low, medium, or high educational attainment categories according to the mapping described in Table A1. In addition, Rostron et al. (Reference Rostron, Boies and Arias2010) propose a correction factor of the number of deaths by educational level recorded in death registers, which is used in this paper and reported in Table A1.
Table A1. Used correction factors (ratios of CPS deaths to death certificates deaths)

The above correction factors have a sizeable effect on the estimates of longevity by education at age 25, as shown in Table A2. The life expectancy of men with less than high school falls from 49 to 47.1 years after adjustment (from 54.3 to 52.1 years for women). Table A2 also compares our estimates with those found in four other studies [Rostron et al. (Reference Rostron, Boies and Arias2010), Sasson (Reference Sasson2016), Hendi (Reference Hendi2015, Reference Hendi2017)], based on the national (US) educational classification. While these other estimates are not fully comparable to our own (as the reference population or base year of estimation differs relative to our study), the gaps in longevity between college graduates and those with less than high school derived from these studies are broadly similar to those computated based on our data (11.4 years for men and 8.9 years for women).
Table A2. Comparison of adjusted OECD estimates with other US estimates

Annex B
Additional results
Table B1. Life expectancy by education and gender at age 65, around 2011

Table B2. Difference in mortality rate by causes of death between high and low-educated people aged 65–89 years, around 2011

Annex C
Comparison with Eurostat data
Due to the censoring of mortality differentials after age 75, Eurostat estimates of the longevity gap between high and low-educated people at age 65 are often much smaller than our estimates (on average by 1.5 years for men and 1.3 years for women).

Figure C1. Comparison of the longevity gap at age 65 between OECD and Eurostat estimates.
Source: Authors' calculation. The unit of the y-axis is the number of years of life expectancy.


