


Introduction
Attention deficits have been frequently reported in schizophrenia (Mirsky et al. Reference Mirsky, Anthony, Duncan, Ahearn and Kellam1991; Kalkstein et al. Reference Kalkstein, Hurford and Gur2010). These attention deficits are related to electrophysiological measures, such as mismatch negativity (MMN) processing negativity (PN), and waveforms such as the N100, P200 and P300 amplitudes. All these measures are thought to represent different stages of basic human information processing (Näätänen, Reference Näätänen1990), and are the main focus of the present study.
P300 amplitude, more specifically the P3B amplitude, is a positive event-related potential (ERP) which usually reaches maximum amplitude at parietal sites. The P3B amplitude is typically assessed in a so-called ‘oddball’ paradigm, where infrequent stimuli (deviants) are presented in a sequence of frequent stimuli (standards). Its amplitude is generally maximal when a subject is asked to respond to the deviant (target) stimuli, and is among others associated with working memory (Polich & Criado, Reference Polich and Criado2006). There is abundant evidence for reduced P3B amplitude in schizophrenia (Jeon & Polich, Reference Jeon and Polich2003; Bramon et al. Reference Bramon, Rabe-Hesketh, Sham, Murray and Frangou2004), and it has been suggested as a promising endophenotypic marker for the disease (Bramon et al. Reference Bramon, McDonald, Croft, Landau, Filbey, Gruzelier, Sham, Frangou and Murray2005). In addition, there is evidence for attention effects in the N100 and P200 amplitudes, while these have frequently been found to be reduced in schizophrenia (Rosburg et al. Reference Rosburg, Boutros and Ford2008; Ferreira-Santos et al. Reference Ferreira-Santos, Silveira, Almeida, Palha, Barbosa and Marques-Teixeira2012); these ERPs can be assessed simultaneously with P3B amplitude in auditory oddball paradigms.
Similar to the P3B amplitude, also MMN is elicited whenever the brain detects a deviant stimulus in a sequence of repetitive standard stimuli. MMN is believed to reflect an automatic orienting reflex based on memory and comparison processes (Näätänen, Reference Näätänen1995). Reduced MMN appears to be rather specific for schizophrenia (Umbricht et al. Reference Umbricht, Koller, Schmid, Skrabo, Grubel, Huber and Stassen2003), and is therefore considered to be a candidate endophenotypic marker for schizophrenia, although its heritability is rather low (Hall & Rijsdijk, Reference Hall and Rijsdijk2008).
PN is elicited whenever individuals are asked to selectively attend to a certain stream of information, while ignoring other(s) (Näätänen & Michie, Reference Näätänen and Michie1979). Although literature on PN is scarce, there is some evidence that its amplitude is reduced in patients with schizophrenia (Michie et al. Reference Michie, Fox, Ward, Catts and McConaghy1990; Iwanami et al. Reference Iwanami, Isono, Okajima, Noda and Kamijima1998).
Literature on the effects of antipsychotic treatment on the above-mentioned electrophysiological measures is sparse and results are inconsistent (Umbricht et al. Reference Umbricht, Javitt, Novak, Bates, Pollack, Lieberman and Kane1998; Bramon et al. Reference Bramon, Rabe-Hesketh, Sham, Murray and Frangou2004; Molina et al. Reference Molina, Munoz, Martin-Loeches, Casado, Hinojosa and Iglesias2004; Korostenskaja et al. Reference Korostenskaja, Dapsys, Siurkute, Maciulis, Ruksenas and Kähkönen2005). These inconsistencies are probably related to differences in receptor profiles of the antipsychotics that were used or, more specifically, related to differences in their affinities for the dopamine D2 and serotonin 5-HT2A receptors. Besides the D2 receptors, also the 5-HT2A receptors are believed to be of importance in the treatment of schizophrenia (e.g. Lieberman et al. Reference Lieberman, Mailman, Duncan, Sikich, Chakos, Nichols and Kraus1998; Meltzer et al. Reference Meltzer, Li, Kaneda and Ichikawa2003). This has recently been further established by data from our own laboratory (Rasmussen et al. Reference Rasmussen, Erritzoe, Andersen, Ebdrup, Aggernaes, Oranje, Kalbitzer, Madsen, Pinborg, Baaré, Svarer, Lublin, Knudsen and Glenthoj2010, Reference Rasmussen, Ebdrup, Erritzoe, Aggernaes, Oranje, Kalbitzer, Pinborg, Baaré, Svarer, Lublin, Knudsen and Glenthoj2011) based on findings in partly the same population of subjects as that of the current study. In the present study, we chose quetiapine as the tool compound since this drug, in contrast to other currently available first-line antipsychotics, has a low and short-lived affinity for D2 receptors while having a relatively pronounced effect on 5-HT2A receptors (higher and longer-lasting affinity) in its clinically effective dosage range (Kapur et al. Reference Kapur, Zipursky, Jones, Shammi, Remington and Seeman2000).
We recently showed improved sensory and sensorimotor gating in previously antipsychotic-naïve, first-episode patients with schizophrenia following a 6-month treatment with quetiapine (Aggernaes et al. Reference Aggernaes, Glenthoj, Ebdrup, Rasmussen, Lublin and Oranje2010; Oranje et al. Reference Oranje, Aggernaes, Rasmussen, Ebdrup and Glenthoj2013). In the current paper, we report on the effects of this treatment on MMN, PN, P3B, N100 and P200 amplitudes in the same population of subjects. Based on the literature cited above, we predicted to find these measures reduced in the antipsychotic-naïve, first-episode state of the patients. Furthermore, given quetiapine's specific neurochemical characteristics in combination with our previous findings on sensory and sensorimotor gating, we expected to find an increase in these measures in our patients following the treatment period.
Method
Trial registration
This trial was registered at ClinicalTrials.gov (NCT00207064) (http://clinicaltrials.gov/ct/show/NCT00207064).
Subjects
The study was approved by the Ethics Committee of the Capital Region (H-KF-01-78/97), Copenhagen, with regards to the ethical principles for medical research involving human subjects as stated in the declaration of Helsinki (amendment of Washington, 2002). Written and oral information was given, after which written informed consent was obtained from all subjects.
The procedure has been described before (Aggernaes et al. Reference Aggernaes, Glenthoj, Ebdrup, Rasmussen, Lublin and Oranje2010; Oranje et al. Reference Oranje, Aggernaes, Rasmussen, Ebdrup and Glenthoj2013): Antipsychotic-naïve, first-episode schizophrenia patients between 18 and 45 years of age were recruited from psychiatric hospitals and related out-patient clinics in the Copenhagen municipality and county. Diagnoses (Diagnostic and Statistical Manual of Mental Disorders, 4th edition; DSM-IV) were confirmed with the Schedule for Clinical Assessment in Neuropsychiatry, version 2.1 (SCAN). Each patient was matched on age, gender and parental socio-economic status to a healthy control recruited from the community, with no personal or (first-degree) family history of psychiatric illness. The patients’ symptomatology was rated with the Positive and Negative Syndrome Scale (PANSS) (Kay et al. Reference Kay, Fiszbein and Opler1987). Exclusion criteria were coercive measures, a history of mental retardation, organic brain damage or organic psychosis. Although alcohol and drugs of abuse were no exclusion criteria, substance dependence was an exclusion criterion. Among the included subjects, 11 patients fulfilled DSM-IV criteria for former or ongoing substance abuse. In total, 34 patients and 34 healthy controls completed the psychophysiological test battery at baseline (see Table 1 for demographics). Due to a combination of technical difficulties and an inability of subjects to endure some of the tests, baseline assessment of four selective attention (SA) and three MMN paradigms of patients, as well as two MMN paradigms of controls, was missing.
Table 1. Demographic characteristics of patients and their matched healthy controls at baseline and follow-up

s.d., Standard deviation; PANSS, Positive and Negative Syndrome Scale; s.e., standard error of the mean.
* Significantly reduced compared with baseline (p = 0.002).
† Significantly lower than patients who completed the study (p = 0.015).
After 6 months all assessments were repeated. During these 6 months, the patients were treated with quetiapine in flexible doses according to their clinical needs. Concomitant treatment with benzodiazepines was allowed on an ‘if needed basis’, and five patients were in either episodic or regular treatment with benzodiazepines at the time of the investigations (only ‘if needed’ evening doses of benzodiazepines with short half-lives were allowed). Two patients were treated with antidepressants at the time of the baseline assessments.
During the 6-month period between baseline and follow-up, three patients were excluded due to non-compliance, a further three patients were excluded because they never started treatment and three patients discontinued the treatment, either because of intolerable side effects or due to lack of efficacy. Finally, six patients refused to be retested or dropped out for unknown reasons, resulting in a total of 18 patients who completed the psychophysiological test battery at follow-up. Furthermore, three healthy controls declined retesting, resulting in 31 controls at follow-up, of whom a further three refused MMN testing. Controls received no treatment between baseline and follow-up.
Experimental design
All participants were tested in the Copenhagen Psychophysiological Test Battery (CPTB) (Jensen et al. Reference Jensen, Oranje, Wienberg and Glenthoj2007, Reference Jensen, Oranje, Wienberg and Glenthoj2008; Oranje et al. Reference Oranje, Jensen, Wienberg and Glenthoj2008) on two occasions, separated by a period as close to 6 months as possible. The CPTB includes paradigms assessing pre-pulse inhibition of the startle reflex, P50 suppression, MMN and SA (always assessed in this fixed order). To keep it focused, only the results on SA and MMN are reported in the present paper; the other data have already been published elsewhere (Aggernaes et al. Reference Aggernaes, Glenthoj, Ebdrup, Rasmussen, Lublin and Oranje2010; Oranje et al. Reference Oranje, Aggernaes, Rasmussen, Ebdrup and Glenthoj2013). To avoid acute and/or withdrawal effects of nicotine, smoking was not allowed from 1 h onwards prior to testing.
Paradigms
Stimulus presentation
All auditory stimuli were presented by a computer running Presentation® (Neurobehavioral Systems Inc., USA) software and presented binaurally through stereo insert earphones (Eartone ABR© 1996–2008 Interacoustics A/S, USA).
SA
The SA paradigm has been described previously (Oranje et al. Reference Oranje, Jensen, Wienberg and Glenthoj2008; Wienberg et al. Reference Wienberg, Glenthoj, Jensen and Oranje2010), and consisted of 400 stimuli that were presented in a semi-random fashion (equally distributed) to the subjects’ right and left ear. Two types of stimuli were presented with a randomized interstimulus interval (ISI) between 700 and 900 ms: standard tones (1000 Hz, 75 dB, 50 ms), with a probability of 80% of the cases, and deviant tones (1200 Hz, 75 dB, 50 ms), with a probability of 20% (deviants were never presented in direct succession). Subjects were required to push a button as quickly as possible if the deviant tone was perceived in the previously designated ear. Following this initial task, the subjects were presented an identical task, in which they had to monitor the other ear for deviant stimuli. Task performance was assessed by scoring the numbers of hits and false alarms, as well as the mean reaction time to hits.
MMN
The typical MMN paradigm has been described previously (Oranje et al. Reference Oranje, Jensen, Wienberg and Glenthoj2008; Wienberg et al. Reference Wienberg, Glenthoj, Jensen and Oranje2010): stimuli were presented binaurally, and consisted of two types: 1000 Hz standard stimuli, presented with a probability of 90% and 1200 Hz deviants stimuli, presented with a probability of 10%. Intensity of all stimuli was 75 dB and they were 50 ms in length. A total of 1750 stimuli were presented, with an ISI randomized between 300 and 500 ms. Subjects were requested to ignore all stimuli, and were therefore presented a (muted) nature documentary.
Signal recording
Electroencephalogram (EEG) recordings were made with BioSemi® hardware (BioSemi, Netherlands) using a cap containing 64 Active Two electrodes (Metting van Rijn et al. Reference Metting van Rijn, Kuiper, Dankers and Grimbergen1996), arranged according to the 10–20 system. However, only data from the electrodes relevant for the present study were analysed (i.e. where the maximum activity for the currently investigated ERPs was found): the midline electrodes Fz (MMN and PN), Cz (N100 and P200) and Pz (P3B amplitude). Linked mastoids were used as reference. Sampling started from the beginning of an experimental block and lasted until the end of it (continuous recording). All signals were digitized online by a computer, at a rate of 4 kHz.
Signal analysis
EEG data from both the SA paradigm and MMN paradigm were analysed using BESA software (MEGIS Software GmbH, Germany). First, the data were downsampled from the original 4 kHz to 250 Hz, to allow easier file handling. Second, the data were corrected for eye artifacts by using the adaptive method of BESA, as described by Ille et al. (Reference Ille, Berg and Scherg2002). Third, the data were epoched (from 100 ms pre-stimulus to 900 ms post-stimulus) and corrected for movement or other paradigm unrelated artifacts, by removing those epochs from the database that contained amplitude differences between maximum and minimum in the epoch that exceeded 100 µV, within relevant time windows for the different components (see scoring intervals below). Last, the data of the paradigms were filtered (low-pass: 40 Hz, high-pass: 0.5 Hz). Following these procedures, data of the SA paradigm were collapsed on attentional focus (left and right ear), and averaged in the case of P3B amplitude data. PN was expressed as a subject's average ERP to attended standard stimuli, subtracted with his/her average ERP to unattended standard stimuli. In the MMN paradigm, MMN was expressed as a subject's average ERP to deviant stimuli, subtracted with his/her average ERP to standard stimuli. Similarly, MMN was derived from the non-attended stimuli in the SA paradigm (see also Oranje et al. Reference Oranje, van Berckel, Kemner, van Ree, Kahn and Verbaten2000). Finally, in the SA paradigm and based on the grand averages, P3B amplitude was scored between 300 and 700 ms post-stimulus, MMN and PN were scored between 50 and 300 ms and between 125 and 375 ms, respectively, while N100 and P200 amplitudes were scored between 35 and 140 ms and 135 and 250 ms, respectively, for each of the four different stimuli. Last, MMN in the MMN paradigm was scored in a window between 50 and 200 ms.
Statistical analysis
All statistical analyses were performed with SPSS (version 20.0, IBM Corp., USA). Baseline data of the MMN, PN, P3B amplitude (for targets only) and task performance (hits, false alarms and reaction time) were analysed by means of univariate analysis of variance (ANOVA), with the between factor ‘group’ (patients or controls). Similarly, baseline to follow-up data of these dependent variables were analysed by means of repeated-measures ANOVA, with the between factor ‘group’ (patients or controls) and within factor ‘time’ (baseline or follow-up, equivalent with ‘treatment’ for patients). Amplitudes of N100 and P200 were analysed similarly, except that the factors ‘attention’ (stimuli presented in monitored ear or not) and ‘stimulus type’ (standard or deviant stimuli) were added. Finally, use of benzodiazepines, antidepressants, smoking and substance abuse were included as covariates, but since they never reached statistical significance, they were removed from the final statistical analyses. To avoid α-inflation, Student's t tests were only performed whenever the ANOVAs revealed significant results. Effect sizes are either expressed as Cohen's d (t tests) or η 2 (ANOVAs).
Ethical standards
All procedures contributing to this work comply with the ethical standards of the relevant national and institutional committees on human experimentation and with the Helsinki Declaration of 1975, as revised in 2008.
Results
Drop-out
There were no significant differences in age, MMN, PN, N100, P200 or P3B amplitudes at baseline between those patients and controls who completed the study and those who dropped out. However, the patients who dropped out had significantly lower PANSS positive scores at baseline than those who completed the study [t = 2.39, degrees of freedom (df) = 29, p = 0.015, d = 0.89; see Table 1].
Behavioural data (Table 2)
Patients responded significantly slower (F 1,61 = 12.14; p < 0.001, η 2 = 0.17), scored significantly fewer hits (z = 3.74, p < 0.001, d = 0.86), yet scored similar numbers of false alarms (z = 1.63, n.s., d = 0.42) compared with healthy controls at baseline. The analyses from baseline to follow-up showed significant main effects of time (F 1,42 = 7.18; p = 0.01, η 2 = 0.15), group (F 1,42 = 7.49; p = 0.009, η 2 = 0.15) and a time × group interaction (F 1,42 = 4.62; p = 0.037, η 2 = 0.10), indicating that patients, but not controls, responded significantly faster at follow-up compared with baseline, although they were still significantly slower than the controls. Neither the number of hits, nor the number of false alarms changed significantly between baseline and follow-up, regardless of group (z < 0.63, n.s., d < 0.45), with patients still scoring significantly fewer hits at follow-up than the controls (z = 2.48, p = 0.01, d = 0.79).
Table 2. Behavioural dataa
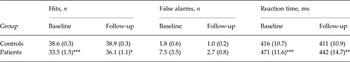
Data are given as mean (standard error of the mean).
a The data show significantly fewer hits and significantly longer reaction time in patients compared with controls, both at baseline and follow-up. The reaction time of patients decreased significantly between baseline and follow-up.
* p < 0.05, ** p < 0.01, *** p < 0.001 (patients compared with controls).
Psychophysiological data
MMN
Typical MMN paradigm (online Supplementary Fig. S1, Table 3)
Patients showed similar MMN amplitude at baseline (F 1,61 = 1.02; p = 0.39, η 2 = 0.17) as well as from baseline to follow-up (F 1,40 = 0.52; p = 0.48, η 2 = 0.01) as the healthy controls. Furthermore, neither a main effect of time (F 1,40 = 0.97; p = 0.33, η 2 = 0.02) nor a time × group interaction effect (F 1,40 = 1.55; p = 0.22, η 2 = 0.04) was found, indicating that neither significant change of MMN occurred in patients nor in controls between baseline and follow-up.
Table 3. MMN and PN amplitude data at baseline and follow-upa
Data are given as mean (standard error of the mean).
MMN, Mismatch negativity; PN, processing negativity; SA, selective attention.
a MMN and PN at lead Fz in μV. Patients showed significantly lower MMN amplitude compared with controls in the SA paradigm.
* p < 0.05 (patients compared with controls).
SA paradigm (online Supplementary Fig. S2, Table 3)
At baseline patients showed significantly lower MMN amplitude in the SA paradigm than healthy controls (F 1,62 = 4.94; p = 0.03, η 2 = 0.07). The ANOVA from baseline to follow-up showed neither main effects of group (F 1,44 = 2.67; p = 0.11, η 2 = 0.06), nor of time (F 1,44 = 0.66; p = 0.42, η 2 = 0.02), while the interaction between time and group reached trend level of significance (F 1,44 = 3.09; p = 0.088, η 2 = 0.07). Further analyses showed that MMN amplitude in the group of patients as a whole did not change significantly between baseline and follow-up (t = 1.69, df = 15, p = 0.113, d = 0.27). However, and much similar to observations in our previously reported data on P50 suppression (Oranje et al. Reference Oranje, Aggernaes, Rasmussen, Ebdrup and Glenthoj2013), MMN of the patients on the highest doses of quetiapine (split on the median: 500 mg, range 100–1200 mg) increased significantly within that period (t = 3.21, df = 6, p = 0.018, d = 0.39), while MMN of patients on the lower dosages showed no significant change at all (t = 0.008, df = 7, p = 0.994, d = 0.28).
Other EEG measures
P3B amplitude (online Supplementary Fig. S3, Table 4)
At baseline, patients showed significantly lower P3B amplitude to targets than healthy controls (F 1,62 = 14.38, p < 0.001, η 2 = 0.19). The ANOVA from baseline to follow-up showed a main effect of group (F 1,44 = 8.68, p = 0.005, η 2 = 0.17) but neither a main effect of time (F 1,44 = 0.41, p = 0.53, η 2 = 0.09) nor a time × group interaction (F 1,44 = 1.31; p = 0.26, η 2 = 0.03), indicating that at follow-up the average P3B amplitude of patients was still significantly lower compared with controls. Furthermore, it indicates that this amplitude neither changed significantly in patients nor in controls in the period between baseline and follow-up. Post-hoc analysis showed that the ratio: (amplitude to non-attended deviants)/(amplitude to attended deviants (=targets)) did neither differ significantly between patients and controls at baseline (F 1,62 = 0.54, p = 0.82, η 2 = 0.001), nor at follow-up (F 1,52 = 1.11, p = 0.30, η 2 = 0.04), indicating that patients were not more distracted by the deviants in the non-attended ear than the controls.
Table 4. N100, P200 and P3B amplitude data at baseline and follow-upa

Data are given as mean (standard error of the mean).
a N100 and P200 amplitudes for lead Cz as well as P3B amplitudes for lead Pz in μV and presented by stimulus type.
* p < 0.05, ** p < 0.01, *** p < 0.001 (patients compared with controls).
N100 and P200 amplitudes (Table 4)
Analyses on N100 amplitude showed a stimulus-type main effect both in the baseline ANOVA and in the ANOVA from baseline to follow-up (p < 0.001, η 2 > 0.20), indicating larger amplitudes for deviant stimuli than for standards. No effects of attention were found on this amplitude. Similarly, no group effects on N100 amplitude were found: patients differed neither significantly at baseline (p > 0.28, η 2 < 0.02) nor at follow-up (p > 0.097, η 2 < 0.06) from the healthy controls, regardless of whether stimuli were deviants or standard or were attended or not. Furthermore, neither the main effect of time (F 1,44 = 0.21, p = 0.34, η 2 = 0.02) nor the time × group interaction effects with stimulus type or attention (p > 0.23, η 2 < 0.03) were significant, indicating that neither the N100 amplitudes of patients nor that of controls changed significantly between baseline and follow-up.
Analyses of the P200 amplitude data showed a main effect of attention both in the baseline and the baseline to follow-up (p < 0.049, η 2 > 0.07) ANOVA, as well as an attention × stimulus type interaction effect (p < 0.03, η 2 > 0.11). In addition, a main effect of group (F 1,62 = 8.67, p = 0.005, η 2 = 0.12) as well as an attention × group interaction effect (F 1,62 = 6.27, p = 0.015, η 2 = 0.09) was found in the ANOVA at baseline. These results indicate larger amplitudes to non-attended stimuli than to attended stimuli regardless of group. Furthermore, patients had lower P200 amplitudes than controls regardless of stimulus type or attention, while in addition the controls had higher P200 amplitude to attended than to non-attended stimuli, where patients showed no such difference. However, no significant group effects were found in the baseline to follow-up ANOVA (F 1,44 = 3.00, p = 0.09, η 2 = 0.06), and no significant time effects were found (p > 0.23, η 2 < 0.01).
PN (online Supplementary Fig. S4, Table 3)
PN of patients differed neither significantly at baseline (F 1,62 = 2.02, p = 0.16, η 2 = 0.032) nor from baseline to follow-up (F 1,44 = 0.46, p = 0.50, η 2 = 0.01) from that of the healthy controls. Furthermore, neither a main effect of time (F 1,44 = 0.46; p = 0.50, η 2 = 0.01) nor a time × group interaction effect (F 1,44 = 0.44, p = 0.51, η 2 = 0.01) was found, indicating that neither PN amplitude of patients nor that of controls changed significantly between baseline and follow-up.
Correlations (online Supplementary Table S1)
Due to the relatively low number of participants at follow-up, we only explored correlations in the baseline data. In patients, a significant positive correlation was found between PN and the severity of negative symptoms (r P = 0.41, p = 0.028); no other significant correlations were found between the electrophysiological measures and symptom severity in patients. For the interested reader: see online Supplementary Table S1 for correlations between electrophysiological measures.
Discussion
The focus of the present study was to examine the effects of 6 months treatment with an antipsychotic compound with a relatively high affinity for serotonin 5-HT2A receptors and low affinity for dopamine D2 receptors on MMN and PN as well as on amplitudes of P3B, N100 and P200 of patients with schizophrenia. As such, we assessed these measures in a large group of antipsychotic-naïve, first-episode patients with schizophrenia before and after monotherapy with quetiapine for 6 months. The results were compared with those of a healthy control population in the same experimental design; however, without medical treatment. We found significantly lower MMN in one of our two MMN measures, as well as lower P3B and P200 amplitude in patients at baseline, but similar PN and N100 amplitude compared with the healthy controls. At follow-up the patients’ P200 amplitude and MMN was not significantly different from the controls anymore, but their significantly reduced P3B amplitude persisted.
Deficient MMN has been frequently reported in patients with schizophrenia (Javitt et al. Reference Javitt, Doneshka, Grochowski and Ritter1995; Solís-Vivanco et al. Reference Solís-Vivanco, Mondragón-Maya, León-Ortiz, Rodríguez-Agudelo, Cadenhead and de la Fuente-Sandoval2014). Recently, however, there are some studies reporting that MMN is less affected in early phases of schizophrenia (e.g. Devrim-Ucok et al. Reference Devrim-Ucok, Keskin-Ergen and Ucok2008; Magno et al. Reference Magno, Yeap, Thakore, Garavan, De Sanctis and Foxe2008), especially with paradigms using frequency deviants (Michie et al. Reference Michie, Budd, Todd, Rock, Wichmann, Box and Jablensky2000; Todd et al. Reference Todd, Michie, Schall, Karayanidis, Yabe and Näätänen2008), although this is still under debate (Hay et al. Reference Hay, Roach, Srihari, Woods, Ford and Mathalon2015). We found significantly lower MMN in our antipsychotic-naïve, first-episode patients with schizophrenia compared with healthy controls, however only in our SA paradigm, whereas patients showed normal MMN in our more typical MMN paradigm, despite the fact that both MMN measures were significantly correlated. This discrepancy is probably related to the differences between our paradigms, e.g. the patients could have been more distracted than the healthy controls by the identical sounds presented to the other ear than the one they were required to be monitoring. Nevertheless, our data showed that this was not the case for the P3B amplitude: the amplitude ratios to non-attended deviants and attended deviants were very similar between the patients and controls, both at baseline and at follow-up, indicating that our patients were not more distracted by the deviants in the non-attended ear than the controls. Treatment with quetiapine for 6 months significantly increased the patients’ deficient MMN, however, only in those patients that were treated with above average dosages of quetiapine. Since there is some evidence that MMN is associated with functional outcome scores (Light & Braff, Reference Light and Braff2005), this result may indicate that the patients on the higher dosages of quetiapine may have improved on a functional level, despite not having improved more in severity of clinical (PANSS) symptoms than the patients on the lower dosages. As quetiapine is currently the antipsychotic with the highest serotonergic to dopaminergic ratio (Kapur et al. Reference Kapur, Zipursky, Jones, Shammi, Remington and Seeman2000), our data may indicate that MMN is sensitive to serotonergic modulation. Indeed in two previous studies from our laboratory, we found evidence for such a modulatory role of serotonin on MMN of healthy volunteers (Oranje et al. Reference Oranje, Jensen, Wienberg and Glenthoj2008; Wienberg et al. Reference Wienberg, Glenthoj, Jensen and Oranje2010), similar to reports of other research groups (Ahveninen et al. Reference Ahveninen, Kähkönen, Pennanen, Liesivuori, Ilmoniemi and Jääskeläinen2002; Kähkönen et al. Reference Kähkönen, Makinen, Jaaskelainen, Pennanen, Liesivuori and Ahveninen2005). How this relates to studies showing glutamatergic involvement in MMN in humans (Gunduz-Bruce et al. Reference Gunduz-Bruce, Reinhart, Roach, Gueorguieva, Oliver, D'Souza, Ford, Krystal and Mathalon2012) or other primates (Javitt et al. Reference Javitt, Steinschneider, Schroeder and Arezzo1996) has yet to be determined.
We found no group effects in the N100 data, but found lower P200 amplitude regardless of stimulus type as well as lower P3B amplitude to target stimuli in our patients. Interestingly, the P200 amplitude was larger to attended than to non-attended stimuli (regardless of deviance type), but only in controls, not in patients. However, the group effects on P200 amplitude were lost in the baseline to follow-up analyses, which neither indicated effects of time (which equals treatment for patients). It is likely that this discrepancy between the baseline and follow-up analyses is due to power issues, since the baseline to follow-up analyses are based on smaller sample sizes. Interestingly, the reduced P3B amplitude in patients persisted after the 6-month treatment with quetiapine. This indicates that the P3B amplitude is relatively insensitive to compounds with higher affinity to serotonergic than to dopamine receptors, which is consistent with two previous studies from our laboratory, in which we found no effects of escitalopram (a specific selective serotonin reuptake inhibitor) on the P3B amplitude of healthy volunteers (Oranje et al. Reference Oranje, Jensen, Wienberg and Glenthoj2008; Wienberg et al. Reference Wienberg, Glenthoj, Jensen and Oranje2010). The literature does suggest predominantly glutamatergic modulation of this amplitude (e.g. Oranje et al. Reference Oranje, van Berckel, Kemner, van Ree, Kahn and Verbaten2000; Watson et al. Reference Watson, Petrakis, Edgecombe, Perrino, Krystal and Mathalon2008; Gunduz-Bruce et al. Reference Gunduz-Bruce, Reinhart, Roach, Gueorguieva, Oliver, D'Souza, Ford, Krystal and Mathalon2012), possibly in combination with γ-amino butyric acid (GABA), acetylcholine and norepinephrine (Frodl Bauch et al. Reference Frodl Bauch, Bottlender and Hegerl1999; Huang et al. Reference Huang, Chen and Zhang2015; for a review, see Polich & Criado, Reference Polich and Criado2006). Our results are in contrast with a pilot study reporting increased (auditory and visual) P3B amplitude in patients with schizophrenia, following 3 months of treatment with quetiapine (Park et al. Reference Park, Han and Jeon2010). However, there was no control group in that study, making it difficult to infer whether these patients had P3B deficits in the first place. In addition, they were not first-episode patients and most were medicated before they were tapered off and switched to quetiapine; these issues make it difficult to deduce how much of the results can be explained through altered receptor systems due to previous antipsychotic treatment, or how much the brain was affected by the progress of the disease.
On average, our patients showed reduced PN compared with the controls, but this did not reach statistical significance. To our knowledge, there are no previous reports on PN in first-episode, antipsychotic-naïve schizophrenia patients. However, in contrast to our negative finding, an earlier study did show reduced PN in medication-free patients with schizophrenia (Michie et al. Reference Michie, Fox, Ward, Catts and McConaghy1990). The discrepancy between the two studies is probably related to the advanced progress of the disease in the latter study, or due to the smaller sample size of the other study.
The fact that our patients reacted slower to target stimuli most probably reflects deficient speed of processing, a phenomenon that has frequently been reported in patients with schizophrenia (Goldberg et al. Reference Goldberg, Goldman, Burdick, Malhotra, Lencz, Patel, Woerner, Schooler, Kane and Robinson2007; Kalkstein et al. Reference Kalkstein, Hurford and Gur2010; Keefe & Harvey, Reference Keefe and Harvey2012). Despite our patients reacting significantly faster after quetiapine treatment, the patients were still slower than the controls whose reaction time remained unaltered at follow-up.
An obvious strength of the current study is that only antipsychotic-naïve, first-episode patients were included, which allowed studying the effects of quetiapine treatment without the confounding effects of either disease progress or altered receptor profiles in the brains of our patients at baseline due to previous antipsychotic treatment. Other strengths include the relatively long period of mono-therapeutic treatment and the relatively large number of subjects, given that these particular patients are very difficult to recruit. A limitation was that adjunctive antidepressants, anxiolytic medication and substance abuse were no exclusion criteria. However, these potential confounders did not covary significantly with our dependent variables, so it is unlikely that they have affected our results.
In conclusion, we found reduced P200 and P3B amplitudes, yet normal PN and N100 amplitude in our antipsychotic-naïve, first-episode patients with schizophrenia compared with healthy age- and gender-matched controls. In addition, we found reduced MMN in these patients, albeit in a somewhat atypical paradigm only. Furthermore, we found increased reaction time and less task-related accuracy in our patients compared with the controls. Treatment with quetiapine for 6 months significantly ameliorated the MMN deficits in those patients treated with above-median dosages only, to levels not differing from the controls anymore. However, the deficient P3B amplitude persisted. In addition, we found improved reaction times in our patients following this treatment, although they were still significantly slower than the controls. Given that quetiapine has a higher affinity for serotonin 5-HT2A receptors than for dopamine D2 receptors, our data may indicate that reduction of 5-HT2A activity improves MMN and reaction time in patients with schizophrenia.
Supplementary material
The supplementary material for this article can be found at https://doi.org/10.1017/S0033291717000599
Acknowledgements
The study was sponsored by grants from: the Danish Medical Research Council; the Copenhagen Hospital Cooperation Research Council; Copenhagen University Hospital Bispebjerg; the Faculty of Health Sciences of the University of Copenhagen; the Copenhagen Council Research Foundation (grant number: 1123); and the Lundbeck Foundation (grant numbers: 192/05; 192/04; R25-A2701).
Declaration of Interest
B.H.E. has received lecture fees from Bristol-Myers Squibb, Otsuka Pharma Scandinavia AB, and Eli Lilly and Company and is part of the advisory board of Eli Lilly Danmark A/S and Takeda Pharmaceutical Company Ltd. All other authors have no conflicts of interests.


