Introduction
Aphids are among the most damaging insects to plants in temperate countries. This is due to their exceptionally high population growth rate and their phenotypic plasticity, which confer a wide range of strategies to cope with fluctuating environments (Blackman, Reference Blackman1974). Aphid phenotypic plasticity results from some particular life-history traits, in particular their reproductive mode, alternating clonal (parthenogenetic) and sexual reproduction, and their dispersal ability, through the production of winged or wingless forms.
Aphids generally produce parthenogenetic forms during the ‘good season’ and sexual forms in autumn that mate and lay diapausing eggs, resistant to winter frost (Simon et al., Reference Simon, Rispe and Sunnucks2002). This life cycle is called cyclical parthenogenesis. The annual phase of sexual recombination generates a new array of genotypes each year that are sorted by selective factors. This leads to clonal population structure, which is expected to culminate at the end of the parthenogenetic phase (Gomez & Carvalho, Reference Gomez and Carvalho2000). Nonetheless, some lineages reproduce clonally all year round and over-winter where temperature is sufficiently mild, or otherwise die (Dedryver et al., Reference Dedryver, Hullé, Le Gallic, Caillaud and Simon2001). The persistence for years of obligatory parthenogenetic lineages leads to increased frequency of old, particularly fit clones. In some aphid species, reproductive mode polymorphism is maintained through a winter-climate dependent balance favouring either cyclically or obligatory parthenogenetic lineages (Rispe and Pierre, Reference Rispe and Pierre1998; Rispe et al., Reference Rispe, Pierre, Simon and Gouyon1998). The co-existence of the two reproductive modes occurs frequently under oceanic climates (Blackman, Reference Blackman1971; Dedryver et al., Reference Dedryver, Le Gallic, Gauthier and Simon1998) and influences the structure of aphid populations, which could thus include clones of various ages (Wilson et al., Reference Wilson, Sunnucks and Hales2003).
Aphids can produce massive numbers of winged forms in response to crowding, presence of natural enemies and decrease in host plant quality (Dixon, Reference Dixon1998; Kunert et al., Reference Kunert, Otto, Röse, Gershenzon and Weisser2005). The distances over which winged aphids could fly remain largely unknown (Loxdale et al., Reference Loxdale, Hardie, Halbert, Foottit, Kidd and Carter1993). However, according to several genetic studies, dispersal events seem to be strong enough to homogenize aphid populations over a relatively large geographical scale, especially in species with a more or less continuous habitat like those associated with crops (Loxdale et al., Reference Loxdale, Hardie, Halbert, Foottit, Kidd and Carter1993). In addition, aphid populations are subjected to sudden crashes caused by adverse factors, such as climate, natural enemies and ephemeral resources (Dixon, Reference Dixon1998), followed by periods of build up. These large fluctuations in population dynamics are expected to induce strong genetic bottlenecks, drift and founder effects in aphid populations. Consequently, the genetic structure of aphid populations is likely to experience frequent and deep changes in time and space, the assessment of which could, in turn, give useful information on the nature and extent of the underlying biological processes.
Among previous studies on the genetic differentiation of aphid populations, few took into account time and space simultaneously; some considered one set of samples collected or not at the same period (De Barro et al., Reference De Barro, Sherratt, Carvalho, Nicol, Iyengar and Maclean1995b; Vanlerberghe-Masutti and Chavigny, Reference Vanlerberghe-Masutti and Chavigny1998; Simon et al., Reference Simon, Baumann, Sunnucks, Hebert, Pierre, Le Gallic and Dedryver1999; Delmotte et al., Reference Delmotte, Leterme, Gauthier, Rispe and Simon2002; Papura et al., Reference Papura, Simon, Halkett, Delmotte, Le Gallic and Dedryver2003; Llewellyn et al., Reference Llewellyn, Loxdale, Harrington, Clark and Sunnucks2004), while others compared two sets of samples collected during successive years (Loxdale et al., Reference Loxdale, Tarr, Weber, Brookes, Digby and Castañera1985; Llewellyn et al., Reference Llewellyn, Loxdale, Harrington, Brookes, Clark and Sunnucks2003) or in successive seasons (Sunnucks et al., Reference Sunnucks, De Barro, Lushai, Maclean and Hales1997; Guillemaud et al., Reference Guillemaud, Mieuzet and Simon2003). Only a few studies included populations collected sequentially during one season or over a single year (Fenton et al., Reference Fenton, Woodford and Malloch1998; Fuller et al., Reference Fuller, Chavigny, Lapchin and Vanlerberghe-Masutti1999; Haack et al., Reference Haack, Simon, Gauthier, Plantegenest and Dedryver2000; Vorburger, Reference Vorburger2006). A study of the genetic structure of an aphid species that considers population dynamics over the long term and over a large scale has not been conducted.
The monoecious (non host-alternating) aphid, Sitobion avenae F. (Aphididae, Sternorrhyncha), is an important pest of cereals world wide because of sap feeding and Barley Yellow Dwarf Virus transmission (Vereijken, Reference Vereijken1979; Plumb, Reference Plumb, Plumb and Thresh1983). This species exhibits high levels of phenotypic diversity, including colour variation (Weber, Reference Weber1985; Jenkins et al., Reference Jenkins, Loxdale, Brookes and Dixon1999; Dedryver et al., Reference Dedryver, Hullé, Le Gallic, Caillaud and Simon2001), host-plant preferences (Caillaud et al., Reference Caillaud, Dedryver, Di Pietro, Simon, Fima and Chaubet1995; De Barro et al., Reference De Barro, Sherratt, Brookes, David and Maclean1995a,b; Sunnucks et al., Reference Sunnucks, De Barro, Lushai, Maclean and Hales1997; Haack et al., Reference Haack, Simon, Gauthier, Plantegenest and Dedryver2000; Vialatte et al., Reference Vialatte, Dedryver, Simon, Galman and Plantegenest2005) and reproductive mode. In S. avenae, four life cycle variants (i.e. holocyclics, intermediates, androcyclics and anholocyclics) are selected by winter climate, resulting in geographical clines (Dedryver et al., Reference Dedryver, Le Gallic, Gauthier and Simon1998, Reference Dedryver, Hullé, Le Gallic, Caillaud and Simon2001; Papura et al., Reference Papura, Simon, Halkett, Delmotte, Le Gallic and Dedryver2003). S. avenae populations build up frequently on wheat, generally over a large geographic area (from region to continent) in a short period of time (June–July in Europe). However, it is not known whether large-scale migration or simultaneous increase of local populations, favoured by extensive cereal crop production over millions of hectares in Europe, contributes the most to this large-scale process of population dynamics. A previous study using microsatellite markers showed a substantial genetic differentiation between northern and southern populations of S. avenae in France, likely resulting from geographic partitioning of breeding system variation (Simon et al., Reference Simon, Baumann, Sunnucks, Hebert, Pierre, Le Gallic and Dedryver1999). However, of the 38 multilocus genotypes sampled more than once in this study, ten were found throughout the country, indicating substantial ability for migration throughout France. In Britain, Llewellyn et al. (Reference Llewellyn, Loxdale, Harrington, Brookes, Clark and Sunnucks2003) also found widespread common genotypes of S. avenae caught by suction traps, as well as a north-south clinal trend in genotypic diversity, probably related to differences between regions in the dominant mode of reproduction. On a larger geographic scale, it was shown that French and Romanian populations of S. avenae did not have genotypes in common and were significantly isolated by distance (Papura et al., Reference Papura, Simon, Halkett, Delmotte, Le Gallic and Dedryver2003).
The aim of this paper was two fold. The first objective was to assess the extent of migration vs. local persistence of S. avenae populations. In particular, we wanted to define at which geographic scale S. avenae populations tend to be spatially differentiated, and to evaluate the persistence of spatial structures across seasons and years. The second objective was to determine how variation in reproductive mode, which is shaped by winter climate in aphids, affects genotypic diversity and clonal turnover of S. avenae populations spread along a climatic gradient.
For that, we conducted a population genetic analysis on S. avenae individuals sampled during several consecutive years from cereal fields in three regions of northern France. Aphid samples were examined for allelic variation at five microsatellite loci in order to determine how their genetic structure and genotypic composition were affected in time and space.
Materials and methods
Aphid collections
A total of 808 aphids was collected from 1990 to 1997. Parthenogenetic females of S. avenae were collected in April 1993, 1994 and 1995 and in July and October 1994 from two areas of northern France, near Lille (French Région Nord-Pas de Calais, referred to as ‘Nord’ in this paper) and Rennes (French Région Bretagne, referred to as ‘Bretagne’). Additional aphid collections were made around Rennes in April 1990, June and October 1997, and around Caen (French Région Basse-Normandie, referred to as ‘Normandie’) in April and October 1994 (table 1, fig. 1). Data from April 1990 and April 1994 corresponded to those published by Simon et al. (Reference Simon, Baumann, Sunnucks, Hebert, Pierre, Le Gallic and Dedryver1999), while those from 1997 were taken from Haack et al. (Reference Haack, Simon, Gauthier, Plantegenest and Dedryver2000).
Table 1. Number of S. avenae collected (N) and number of fields (n) for each region. Comparison of genetic parameters calculated across the different S. avenae region units for five microsatellite loci and one copy per genotype.

Hexp, expected heterozygozity; Hobs, mean observed heterozygosity; SE, standard error; Het. Deficit, probability that Ho<He; LD, pairs of loci in significant linkage disequilibrium (P<0.05); k=G N −1, genotypic diversity.
1data from Simon et al. (Reference Simon, Baumann, Sunnucks, Hebert, Pierre, Le Gallic and Dedryver1999) ; 2data from Haack et al. (Reference Haack, Simon, Gauthier, Plantegenest and Dedryver2000).

Fig. 1. Map of northwestern France with the three areas of S. avenae collection (dotted circles). Distances between Rennes and Lille, Rennes and Caen, and Caen and Lille are 370 km, 170 km and 240 km, respectively.
In all sampled regions, Poaceae crops (cereals, maize and temporary grass pastures) represented a large fraction of the arable land (85.5% in Bretagne, 81.4% in Normandie, 64.5% in Nord-Pas de Calais). For each region, season and year (except October 1997 in Bretagne), aphids were collected at two to six different sites (fields), from various cereal species, depending on their availability in each region at collection time (crops and volunteers of barley, oat and wheat in April; wheat crops in June and July; maize crops, wheat and barley volunteers in October). In this study, host plant origin of aphids was not taken into consideration, first because of unbalanced samples in the various plant/region/season combinations and second because several previous reports indicated very little or no genetic differentiation between S. avenae populations associated with different cereal species (Haack et al., Reference Haack, Simon, Gauthier, Plantegenest and Dedryver2000; Lushai et al., Reference Lushai, Markovitch and Loxdale2002; Vialatte et al., Reference Vialatte, Dedryver, Simon, Galman and Plantegenest2005). In order to reduce the probability of collecting multiple individuals of the same clone, a minimum of half a metre separated each individual collected. From 1990 to 1995, each parthenogenetic female collected was allowed to reproduce on a wheat seedling, following standard methods (Caillaud et al., Reference Caillaud, Dedryver, Di Pietro, Simon, Fima and Chaubet1995) in order to establish a parthenogenetic line. Each line was, thereafter, phenotypically characterized for reproductive mode (data published in Dedryver et al. (Reference Dedryver, Hullé, Le Gallic, Caillaud and Simon2001)) then frozen at –80°C. Samples collected in 1997 were frozen immediately after collection.
Microsatellite genotyping
Total DNA was extracted from individual aphids using a salting-out protocol (Sunnucks and Hales, Reference Sunnucks and Hales1996). Each aphid was genotyped using five microsatellite loci; four of these (Sm10, Sm11, Sm12, Sm17) were isolated from Sitobion miscanthi (Sunnucks et al., Reference Sunnucks, England, Taylor and Hales1996), and one (S4Σ) was isolated from S. avenae (Simon et al., Reference Simon, Baumann, Sunnucks, Hebert, Pierre, Le Gallic and Dedryver1999). Microsatellite amplifications were carried out in a 15 μl reaction, containing 0.1 unit of Taq polymerase (Promega), 1×MgCl2, 200 μM dNTP, 0.2 mM of each primer and 1 μl of 1/3 diluted aphid DNA. PCR reactions were performed in a PCR Express machine (Hybaid, Inc.) with a regime of initial denaturation at 94°C for 2 min followed by 35 cycles of denaturation at 94°C, annealing temperature depending on locus, and elongation at 72°C, each for 40 s. PCR products were run on 1.4% agarose gels to check for amplification. Microsatellite products were then loaded onto a denaturing polyacrylamide gel and visualized by silver staining as described in Haack et al. (Reference Haack, Simon, Gauthier, Plantegenest and Dedryver2000). Allele sizes were estimated using a sequencing size ladder (sequence of pGEM–3Zf(+) vector PROMEGA).
Genetic data analysis
Genetic partitioning was assessed at two sampling levels: ‘region’, corresponding to the total number of aphids collected per region and per date (15 samples); and, ‘field’, which was the number of aphids collected in a given field at a given date (46 samples).
Genotypic diversity within regions and within fields was estimated using the k=G N −1 index, where G is the number of different multilocus genotypes, and N is the number of individuals in the sample. For region samples collected in spring (June for Bretagne in 1997, April for other regions and years), correlations between k and 32 climatic data from preceding summer, autumn and winter were calculated and stepwise multiple regression between k and these data was calculated using S-PLUS 6.2 (2002) in order to select the best predictors of k. To estimate the evenness of genotypic diversity, we calculated the complement of Simpson's index, D (Piélou, Reference Piélou1969) for each sample as D=1−∑ [Ni (Ni−1)/N(N−1)], where Ni is the number of aphids of genotype i, and N is the number of aphids sampled. From D, we calculated E, a second estimate of evenness (Fager, 1972 in Ivey & Richards, Reference Ivey and Richards2001) that is not influenced by sample size, as E=(D−D min)/D max−D min), where D min=[(h−1)(2N−h)]/[N(N−1)], D max=[(h−1)N]/[h(N−1)], and h is the number of multilocus genotypes in the sample. Diversity E was partitioned into components at different spatial scales (field, region, total sample) following Shufran et al. (Reference Shufran, Black and Margolies1991).
Because clonal amplification of genotypes can influence data interpretation (see Sunnucks et al. (Reference Sunnucks, De Barro, Lushai, Maclean and Hales1997) for rationale), the following analyses were performed on microsatellite data with and without repeated genotypes (i.e. clonal copies). Allelic frequencies were calculated using POPULATION software version 1.2.01 (available at http://bioinformatics.org/project/?group_id=84). Departures from Hardy–Weinberg Equilibrium (HWE, to test for random mating among populations), linkage disequilibrium (LD, to test for random association between alleles of different loci), and genetic differentiation among the entire set or pair-wise region samples were analysed using exact tests available in the GENEPOP package v. 3.2a (Raymond and Rousset, Reference Raymond and Rousset1995). Significance of multiple pair-wise comparisons was tested using Fisher's method (GENEPOP package). F-statistics (Wright, Reference Wright1969) that measure coefficient of inbreeding within (F IS) and between (F ST) populations were computed according to Weir and Cockerham (Reference Weir and Cockerham1984) using the same software, with bootstrapping according to Weir (Reference Weir1990). Two hierarchical analyses of molecular variance (AMOVA: Excoffier et al., Reference Excoffier, Smouse and Quattro1992) were performed using ARLEQUIN software (Schneider et al., Reference Schneider, Klueffer, Roessli and Excoffier2000): the first evaluated the population structure between years, and between and within regions; and the second evaluated the population structure between seasons, and between and within regions. A two-way ANOVA followed by a pair-wise comparison of means was made using S-PLUS 6.2 (2002) on the F IS values calculated for each field in order to test the effect of region and year.
Results
Genetic structure within regions and within fields
At regional level
Most samples at regional level showed significant heterozygote deficits: 13 out of 15 when only one copy per genotype was considered (table 1), and 11 out of 15 with the full data set (data not shown). Samples without heterozygote deficits were all from Bretagne and were in Hardy–Weinberg equilibrium. As expected, samples with large heterozygote deficits also exhibited positive and significant values of the multilocus F IS estimate. However, F IS values were higher in samples from Nord and Normandie than in those from Bretagne, except in spring 1995, when F IS were lower in Nord than in Bretagne. Significant linkage disequilibria were also frequent in all samples (0–80% of the ten pairs of loci when one copy per genotype was considered, 10–100% for the full sample), but there were no obvious differences between regions or between years.
At the field level
Most samples at the field level (data not shown) were also positive for F IS (37 out of 46); and most of the samples, which were negative for F IS, were found in fields from Bretagne (6 out of 9). When samples from all fields were compared in a two-way ANOVA, there was no effect of either region (F=1.111, P=0.3412) or year (F=0.9529, P=0.3361) on F IS. However, when 1995 data were excluded (six fields), there was a significant effect of region (F=5.6148, P=0.009682) on F IS, with no effect of year and no interaction between region and year. F IS from Nord were significantly higher than F IS from Bretagne, with F IS from Normandie intermediate and not significantly different from the others.
Genetic differentiation between regions
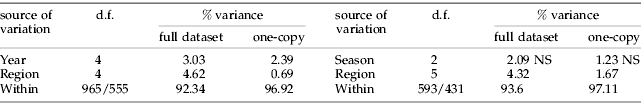
Most pair-wise F ST values were below 0.1 (table 2), indicating an overall low level of differentiation between S. avenae populations on cereals in northern France. Consequently, few pairs of region samples were significantly differentiated, except Nord-Apr.95, which differed from nine samples out of 14, and two samples from Bretagne (Jul.94 and Oct.97), which differed from six others (table 2). All F ST values greater than or equal to 0.1 included samples that were not connected in time, or in time and space (e.g. Nord in spring 1993 and Bretagne in summer 1994, Bretagne in spring 1995 and Bretagne in autumn 1997). In a given region, samples collected in successive seasons were genetically similar, especially in Nord (e.g. between samples from 1993 to 1995, F ST varied between −0.01 and 0.04; and, in 1994, there was no difference in F ST between spring and autumn, and between summer and autumn samples). For a given season, samples collected in different regions were also very close in all cases (0.001<F ST<0.02). As a result, no significant isolation by time was found between region samples (fig. 2), also no isolation by distance was observed between region samples from spring 1994 and between those from autumn 1994 (data not shown). The hierarchical AMOVA showed that more than 90% of the variance was contained within regions or fields. Between region and between year differences, albeit significant, each explained less than 5% of the variance, and the seasonal effect on population sub-division was not significant (table 3).

Fig. 2. Isolation by time between field samples of S. avenae collected in Bretagne from April 1990 to October 1997, for one copy per genotype (Mantel test with 1000 permutations, P=0.1300).
Table 2. Analysis of genetic population differentiation in S. avenae based on the microsatellite analysis. Fst estimates for each pair of samples considered are given above the diagonal.

Type I error probabilities of absence of genic differentiation between samples are given below the diagonal. Probabilities in bold characters correspond to significant tests after the Bonferroni correction. Br, Bretagne; Nd, Nord; Nm, Normandie; A, April; J, July; O, October.
Table 3. Subdivision of variance in populations of S. avenae based on F-statistics estimated from microsatellite data.

NS, not significant at P=0.05; d.f. degree of freedom.
Genotypic composition in time and space
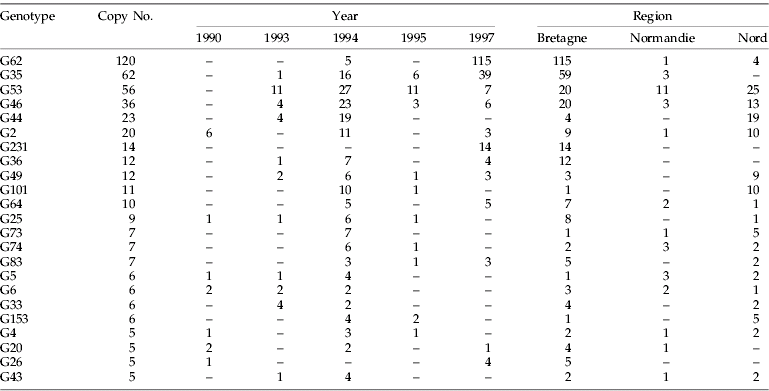
A total of 473 five-loci genotypes were detected among the 808 genotyped individuals. There were 241 unique genotypes. Among the remaining aphids, 69 genotypes were collected more than once (55 from different fields); but only 23 had copy numbers ≥5 (table 4), and these latter contributed to 56% of the sample. One genotype was collected in 120 copies (G62) and five others in 20 copies or more.
Table 4. Occurrence of multilocus genotypes (copy number>4) of Sitobion avenae across years (1990–1997) and regions.

Persistence of multi-copy genotypes in time
Of the 23 genotypes detected in five copies or more, none were detected every year during the whole sampling period (1990–1997) and only three (G2, G20, G26) that were detected in 1990 were still present in 1997. Interestingly, of these three genotypes, two were rather infrequent (table 4). Only four genotypes (G35, G53, G46, G49) were detected each year of sampling from 1993 to 1997. The local turnover of genotypes was very fast; comparisons of samples between regions collected in Bretagne in spring 1993 and spring 1994 showed that they shared only 7% of their genotypes and 8% between spring 1994 and spring 1995. Samples from regions in Nord, collected in spring, shared 6% of their genotypes between 1993 and 1994 and only 2% between 1994 and 1995.
Spatial distribution of multi-copy genotypes from 1993 to 1995
Among the 23 genotypes collected in five copies or more (table 4), 11 were common to the three regions: e.g. genotype G46 was present each year in all sampled regions at least in one season, and genotypes G53 and G62 were present in all regions, but not synchronously. Nine genotypes were collected in two regions only, e.g. genotype G35 was never recorded in Nord but was observed several times in Bretagne and Normandie. Finally, three genotypes were restricted to Bretagne: G36 in spring 1993, spring and summer 1994 and spring 1997; G231 in spring 1997; G26 in spring 1990 and 1997. No genotype collected more than five times was specific to Nord or Normandie. When all genotypes were considered for a given year or season, Nord and Bretagne shared less than 5% of their genotypes, Bretagne and Normandie 5–6%, and Nord and Normandie 6–15%.
Fluctuation in time of genotypic diversity
Except for 1997 (table 1), the diversity index k=G N −1 was rather stable in Bretagne. In Normandie, k was also stable between spring and autumn 1994 (0.7<k<0.8). In Nord, k was lower than in Bretagne and Normandie in 1993 and 1994 (0.46<k<0.6) and highest (0.85) in 1995. More generally, there was no decline in genotypic diversity following summer 1994 and winter 1994–1995 in Bretagne and Nord. By contrast, k decreased in Bretagne from 0.7 to 0.3 between 1995 and 1997 due to an abrupt increase in the frequency of genotype G62. Among the 32 climatic variables tested, the genotypic diversity in spring had the highest correlation: (i) to temperature, which indicated the severity of the previous winter, such as minimum absolute temperatures (r=0.748), accumulated negative temperatures (r=−0.787) (fig. 3a), and the number of frost days from November to March (r=−0.636); and (ii) to minimum temperatures of the previous October (r=−0.560) (fig. 3b). Multiple stepwise regression (table 5) added the accumulated negative temperatures of the preceding winter sequentially (with a positive coefficient) and the minimum temperature of the previous October (with a negative coefficient) as better predictors of k in spring (multiple R2=0.9204).

Fig. 3. Diversity index in spring regional populations of S. avenae (k=G N −1) as a function of (a) cumulated negative daily temperatures from November to March (C°) and (b) of minimum daily temperature of previous October.
Table 5. Intercept and climatic variables contributing significantly to genetic diversity (k=G N −1) with their coefficient in the multiple regression (R2=0.9204).
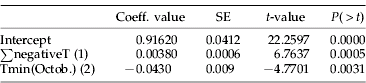
SE, standard error; ∑negativeT, sum of the negative daily minimum temperatures from November to March; Tmin(Octob.), minimum daily temperature from October, (1) and (2), rank of introduction in the multiple regression.
Partitioning of the mean genotypic evenness (E) showed that, with the exception of spring 1995, most of the genotypic diversity was found within fields (57–69%), whereas up to 21% of the diversity was found between fields of the same region, and 18–32% between regions. However, in spring 1995, most of the diversity (47%) was found between fields of the same region, although variation at field level (37%) was still high.
Discussion
Reproductive mode of S. avenae in northern France inferred from genetic data
Whether a given population reproduces primarily by clonal or sexual reproduction could be inferred from examination of several criteria deduced from the analysis of genetic and genotypic structure (Halkett et al., Reference Halkett, Simon and Balloux2005). In particular, it has been shown that high heterozygosities and F IS estimates close to zero were typical of S. avenae populations reproducing mainly or exclusively by parthenogenesis, while lower heterozygosities and higher and positive F IS values were typical of populations with an obligate sexual phase once a year (Simon et al., Reference Simon, Baumann, Sunnucks, Hebert, Pierre, Le Gallic and Dedryver1999; Papura et al., Reference Papura, Simon, Halkett, Delmotte, Le Gallic and Dedryver2003). Positive F IS (heterozygote deficit) can result, a least partially, from selfing due to reproduction between clone mates, as S. avenae reproduces on the same host plant where parthenogenetic multiplication had occurred during the good season. This contrasts with sexually reproducing populations of host alternating aphids (e.g. Rhopalosiphum padi) for which F IS value is close to 0, reflecting random mating (Halkett et al., Reference Halkett, Simon and Balloux2005).
Here, the majority of S. avenae populations showed heterozygosities and F IS values intermediate between the two extreme reproductive modes. This pattern confirms and extends reports on the variation of reproductive modes in S. avenae populations from southern England (Sunnucks et al., Reference Sunnucks, De Barro, Lushai, Maclean and Hales1997) and northern France (Simon et al., Reference Simon, Baumann, Sunnucks, Hebert, Pierre, Le Gallic and Dedryver1999). This variation was supported by the fact that all reproductive variants described in S. avenae were found in our samples whatever the region, season and year of collection (Dedryver et al., Reference Dedryver, Le Gallic, Gauthier and Simon1998, Reference Dedryver, Hullé, Le Gallic, Caillaud and Simon2001). However, we also noticed that heterozygosities were generally higher and F IS estimates lower in Bretagne than in Nord and in Normandie, suggesting a trend toward increasing sexuality northward. This is in agreement with Dedryver et al. (Reference Dedryver, Hullé, Le Gallic, Caillaud and Simon2001) who found that significantly more sexual females were produced in the laboratory by S. avenae clones from the two latter regions than by clones from Bretagne.
This general pattern of reproductive mode variation, along with a trend of increasing sexuality northward observed for S. avenae populations of northern France, fits the predictions of theoretical models of selection of aphid reproductive modes by climatic factors (Rispe et al., Reference Rispe, Pierre, Simon and Gouyon1998; Rispe & Pierre, Reference Rispe and Pierre1998; Simon et al., Reference Simon, Rispe and Sunnucks2002). These models predict that mixed reproductive strategies should prevail in areas with an unpredictable winter climate, such as in northern France. In addition, the west-east gradient in winter severity that occurs across northern France (Dedryver et al., Reference Dedryver, Hullé, Le Gallic, Caillaud and Simon2001) would tend to select for more sexual reproduction in populations from the Nord region, as observed here. Of course, this geographic distribution of reproductive modes in S. avenae populations could be influenced locally by inter-annual variation in winter severity, as well as by habitat characteristics (as shown for the pea aphid, Acyrthosiphon pisum Harris, by Frantz et al. (Reference Frantz, Plantegenest and Simon2006)). This could explain, for example, why F IS estimates were lower in Nord than in Bretagne in April 1995, and why populations from Bretagne in 1997 showed heterozygosities and F IS values similar to those found for asexual (anholocyclic) lineages of S. avenae.
Regional differentiation and dispersal of S. avenae
Two results of the present study support the hypothesis of large migratory tendencies in S. avenae. First, populations of S. avenae collected during the same period in different regions showed no or little genetic differentiation, indicating intense gene flow over a large geographic scale, i.e. northern half of France. Second, among the 69 genotypes found more than once in our sample, 36 were detected in two or three different regions. Since the probability that identical five-locus genotypes derive from independent recombination events is very low (<0.0001 from Papura et al. (Reference Papura, Simon, Halkett, Delmotte, Le Gallic and Dedryver2003)), this also indicates intense movements of S. avenae clones. Homogenization of S. avenae populations resulting from migration was suggested in previous work in England (Loxdale et al., Reference Loxdale, Tarr, Weber, Brookes, Digby and Castañera1985; Llewellyn et al., Reference Llewellyn, Loxdale, Harrington, Clark and Sunnucks2004) and in France (Simon et al., Reference Simon, Baumann, Sunnucks, Hebert, Pierre, Le Gallic and Dedryver1999). In this species, significant geographic differentiation was only noted between remote countries, such as between Britain and Spain, 1700 km apart (Loxdale et al., Reference Loxdale, Tarr, Weber, Brookes, Digby and Castañera1985); or between Romania and France, 2100 km apart (Papura et al., Reference Papura, Simon, Halkett, Delmotte, Le Gallic and Dedryver2003). Similar results were obtained for another cereal aphid, R. padi, whose populations were only fully differentiated when separated by more than 1000 km (Delmotte et al., Reference Delmotte, Leterme, Gauthier, Rispe and Simon2002). By contrast, Guillemaud et al. (Reference Guillemaud, Mieuzet and Simon2003) showed that long distance migration was uncommon in the peach potato aphid, Myzus persicae, suggesting that there are large inter-specific differences in migratory capacities of aphids (Loxdale et al., Reference Loxdale, Hardie, Halbert, Foottit, Kidd and Carter1993).
Interestingly, genetic differentiation between local populations sampled at two successive periods was also very weak. Generally, there was no significant isolation over time of S. avenae populations, contrary to the findings of Guillemaud et al. (Reference Guillemaud, Mieuzet and Simon2003) for M. persicae. This result seems surprising because the main flight activities of S. avenae, which generally occur in June–July (Basky and Harrington, Reference Basky and Harrington2000), are expected to greatly modify the genetic structure of local populations between spring and autumn. However, the genetic homogeneity among S. avenae populations, shown here across large temporal and spatial scales, probably results from the action of two main forces: (i) migration conferred by high dispersal capabilities; and (ii) selection of a pool of genetically close S. avenae clones over millions of hectares of cereals (mostly wheat) that have been bred from a narrow genetic base. That we found a weak temporal differentiation in allelic frequencies but differences in genotypic composition between years is not contradictory. It certainly expresses that, albeit northern France populations of S. avenae on cereals share the same pool of alleles over time, changes in clonal composition occur each year because of recombination and dispersal events.
Persistence of S. avenae genotypes in time and space
On maize, local populations of S. avenae included a small number of common genotypes, which were regularly re-sampled over the growing season, from June to October, and many rare genotypes found only once (Haack et al., Reference Haack, Simon, Gauthier, Plantegenest and Dedryver2000). The present work allows the extrapolation of this result to a larger geographical and temporal scale. Of our 473 genotypes, 255 were found only once (241), or only re-sampled from the same field at the same date (14), and could be considered as rare, in spite of the relatively small size of our samples. The low persistence and occurrence of these genotypes could result from: (i) sexual events that generate a new array of genotypes each year; or (ii) their maladaptation on cereals because they may belong to populations specialized to uncultivated Poaceae (Vialatte et al., Reference Vialatte, Dedryver, Simon, Galman and Plantegenest2005). Conversely, 55 genotypes in multiple copies were collected at different periods and/or in different regions and fields. These genotypes are ‘persistent’ because some of them were sampled several times from 1990 to 1997. As these genotypes could only persist identically through time by clonal reproduction, they should belong to reproductive variants that over-winter parthenogenetically. Indeed, this has been confirmed on a subset of genotypes by biological experiments intended to explore their response to conditions that induce the production of sexual forms in S. avenae (Dedryver et al., Reference Dedryver, Hullé, Le Gallic, Caillaud and Simon2001). Most of them were intermediates (mixed production of sexual and parthenogenetic forms) or anholocyclics (sole production of parthenogenetic forms). Widespread asexual genotypes of aphids have already been reported at different temporal and spatial scales (Fenton et al., Reference Fenton, Woodford and Malloch1998; Delmotte et al., Reference Delmotte, Leterme, Gauthier, Rispe and Simon2002; Wilson et al., Reference Wilson, Sunnucks and Hales2003; Vorburger, Reference Vorburger2006). In S. avenae, Llewellyn et al. (Reference Llewellyn, Loxdale, Harrington, Brookes, Clark and Sunnucks2003, Reference Llewellyn, Loxdale, Harrington, Clark and Sunnucks2004) also described ‘common clones’ from wheat fields and catches from suction traps throughout Britain.
Haack et al. (Reference Haack, Simon, Gauthier, Plantegenest and Dedryver2000) and Vialatte et al. (Reference Vialatte, Dedryver, Simon, Galman and Plantegenest2005) successively proposed that the instability of the cereal cropping system could select for ‘multipurpose’ asexual genotypes, able to develop successfully on different cereal crops and having high dispersal tendencies. Comparing our results with those of Llewellyn et al. (Reference Llewellyn, Loxdale, Harrington, Clark and Sunnucks2004) obtained in the UK over approximately at the same period and on the same crops, indicates that regional differentiation of S. avenae populations from cereals is low and of the same order of magnitude in both countries. Moreover, several genotypes, shared between the two countries and associated mainly with cereals, have been found (Llewellyn et al., Reference Llewellyn, Loxdale, Harrington, Clark and Sunnucks2004). Thus, we hypothesize that most S. avenae clones that are successful on cereals in France and Britain belong to the same genetic pool. Conversely, S. avenae populations from cereal fields and from uncultivated Poaceae of the field margins were highly differentiated both in the UK (Lushai et al., Reference Lushai, Markovitch and Loxdale2002) and France (Vialatte et al., Reference Vialatte, Dedryver, Simon, Galman and Plantegenest2005), suggesting that divergence among local populations of S. avenae is mainly due to the cultivated or uncultivated status of the host plant.
Genotypic diversity and climate
When exploring the relationships between genotypic diversity and climate in S. avenae, we found that clonal richness in spring populations was best explained by two variables: (i) the accumulation of negative temperatures during preceding winter; and (ii) minimum temperatures of the preceding October. The first correlation, which was the strongest, very likely reflects the susceptibility to frost of S. avenae genotypes that over-winter parthenogenetically. Indeed, temperatures below –8°C are known to kill most parthenogenetic forms of S. avenae in the field (Williams, Reference Williams1980; Powell and Bale, Reference Powell and Bale2004). Other research (Simon et al., Reference Simon, Baumann, Sunnucks, Hebert, Pierre, Le Gallic and Dedryver1999; Dedryver et al., Reference Dedryver, Hullé, Le Gallic, Caillaud and Simon2001) has indicated that most populations of S. avenae in northern France are constituted by a mixture of genotypes with different over-wintering strategies (cold-sensitive parthenogenetic forms vs. cold-resistant eggs); a cold winter should immediately translate into a reduction of genotypic diversity the following spring (before migration events), as observed here. This is also what probably occurred in southern Britain, where genotypic diversity of S. avenae populations in 1994 and 1995 was around 0.55 (Sunnucks et al., Reference Sunnucks, De Barro, Lushai, Maclean and Hales1997), while it dropped to 0.33 in spring 1997, following a notoriously harsh winter in western Europe (Llewellyn et al., Reference Llewellyn, Loxdale, Harrington, Clark and Sunnucks2004).
Second, we found a significant negative correlation between genotypic diversity and minimum temperatures of the preceding October. Interpretation of this result is less obvious. One explanation could be that low temperatures reinforce the production of sexual morphs of S. avenae, which is induced by the decrease of day length in most aphids. The modulation of the photoperiodic response by temperature has been shown in several aphid species (Lees, Reference Lees1959; Tagu et al., Reference Tagu, Sabater-Munoz and Simon2005) including S. avenae (Hand and Wratten, Reference Hand and Wratten1985). S. avenae lineages would then invest more or less in the sexual phase depending on temperature conditions in autumn, thus producing a larger or a smaller array of new genotypes the following spring.
In conclusion, S. avenae populations feeding on cereals in northern France are characterized by three main features: (i) a large genetic homogeneity in space and time presumably due to high dispersal capacities and to the homogenising effect of selection exerted by millions of hectares of cereals; (ii) a high genotypic diversity probably maintained by frequent recombination events; (iii) the existence of asexually-reproducing genotypes with a large ecological success attested by their relatively wide range of distribution and long persistence. These characteristics have important consequences for pest management, as they highlight the need to better consider long range dispersal and overwintering strategies (i.e. overwintering as sexual eggs or parthenogenetic forms) in decision-making tools designed for cereal aphids.
Acknowledgements
We thank the many colleagues and students who participated in field collections of S. avenae clones: E. Carrel, F. Fima, M. Hullé, R. Kansy-Astima and D. Martinez-Torrès. We are also grateful to S. Baumann and L. Mieuzet for their help with aphid genotyping and to Randy Kutcher for English improvement of the manuscript. This work was supported by a grant from Région Bretagne (Opération A1C701 Programme 691).