


INTRODUCTION
Bottom trawl fisheries on the Hatton Bank and their impacts
A multispecies deep-sea bottom trawl fishery has been developed in the Hatton Bank (north-east Atlantic) since the late 1990s, to target roundnose grenadier (Coryphaenoides rupestris Gunnerus, 1765) and Baird's smoothhead (Alepocephalus bairdii Goode & Bean, 1879). Deep-water sharks (Carchariniformes and Squaliformes), blue ling (Molva dypterygia Pennant, 1784), chimerids (Chimaeriformes), black scabbardfish (Aphanopus carbo Lowe, 1839) and Greenland halibut (Reinhardtius hippoglossoides Walbaum, 1792) are taken as by-catch. The main fishing grounds are located at depths of between 800 and 1600 m on the western flank of the bank (Bensch et al., Reference Bensch, Gianni, Gréboval, Sanders and Hjort2009).
Grenadiers (Macrouridae) are regarded as a long-living, low fecundity and slow-maturing benthopelagic species, and are therefore considered vulnerable to exploitation (Gordon, Reference Gordon2001; Lorance et al., Reference Lorance, Large, Bergstad, Gordon, Orlov and Iwamoto2008; Shibanov & Vinninchenko, Reference Shibanov, Vinninchenko, Orlov and Iwamoto2008). There is less information available on the life history of smoothheads (Alepocephalidae) but they are also regarded as low-fecundity and slow-maturing species (Allain, Reference Allain1999, Reference Allain2001). Deep-water sharks such as Centroselachus crepidater (Barbosa du Bocage & de Brito Capello, 1864), captured as by-catch in trawl fisheries, have been considered to be ‘of the least concern' (Stevens, Reference Stevens2003) by the International Union for Conservation of Nature (IUCN). However, Centroscymnus coelolepis (Barbosa du Bocage & de Brito Capello, 1864) is included under the ‘near threatened' category (Stevens & Correia, Reference Stevens and Correia2003) and in the list of threatened and/or declining species and habitats of the OSPAR Convention for the protection of the north-east Atlantic marine environment (OSPAR, 2008). The chimerid species Hydrolagus mirabilis (Collett, 1904) is also considered as ‘near threatened' (Dagit et al., Reference Dagit, Compagno and Clarke2007) by the IUCN. Blue ling is a gadoid species which is particularly vulnerable to fishing because spawning aggregations can be targeted (ICES, 2008). In 2003, the European Union (EU) introduced total allowable catches (TACs) for main deep-water species and other regulations for Community vessels fishing in the north-east Atlantic. A ban of fisheries directed towards deep-water sharks has furthermore been implemented (EC, 2010). However, catches of a number of species such as smoothheads still remain unregulated.
Bottom trawling can be one of the reasons for the decline of cold-water corals and other habitat forming taxa (Gage et al., Reference Gage, Roberts, Hartley, Humphery, Barnes and Thomas2005), which are considered by the FAO (2009) as indicators of vulnerable marine ecosystems (VMEs). Coral reefs and gardens, sea pen fields and sponge aggregations are considered as a ‘threatened and/or declining' category by the OSPAR Convention (2008). Distributions of VMEs on the Hatton Bank have been mapped in recent years and extensive seabed areas of the bank (~16,000 km2) have been closed to bottom fishing since 2007, in order to prevent negative impacts on VMEs, particularly cold-water corals (Durán Muñoz & Sayago-Gil, Reference Durán Muñoz and Sayago-Gil2011; Durán Muñoz et al., Reference Durán Muñoz, Sayago-Gil, Murillo, Del Rio, López-Abellán, Sacau and Sarralde2012).
The objective of this survey was to study distributions of deep-sea fish and benthic invertebrates on the trawlable grounds of the Hatton Bank and furthermore to describe any effects of deep-sea bottom trawling in relation to conservation measures (areas closed to fishing). Multispecies deep-sea fisheries are often associated with by-catches and discards because trawling is a low-selective fishing method. Bottom trawling can likewise also produce impacts on VME indicator species. Collaborative research with trawl fishermen was therefore carried out as a cost-effective way of gaining valuable insight into the deep-sea trawling techniques. This survey provided an opportunity to target grenadiers and deep-sea species along smooth terrain and muddy–sandy substrate, as well as to study trawl by-catches and discards.
MATERIALS AND METHODS
Study area
The Hatton Bank study area (Figure 1) lies within the North-East Atlantic Fisheries Commission (NEAFC) Regulatory Area, on the high seas of the north-east Atlantic, at depths greater than 600 m. Hatton Bank is one of the three banks (together with the George Bligh and Rockall Banks) which form the Rockall Plateau. The Hatton Bank structure has been described as a bedrock surface composed of flood basalts (Smith et al., Reference Smith, White, Kusznir, Doré and Vining2005). Its western slope is dominated by a contourite drift (sedimentary deposit created by the action of bottom currents and mainly composed of sand and mud) named Hatton Drift (HD) (Ruddiman, Reference Ruddiman1972). HD overlies the bedrock surface which outcrops at the top of the bank. The study area was divided into four ‘sampling areas' according to their location on the bank and based on existing knowledge of the trawl fishery and seabed information (Durán Muñoz et al., Reference Durán Muñoz, Sayago-Gil, Cristobo, Parra, Serrano, Díaz del Rio, Patrocinio, Sacau, Murillo, Palomino and Fernández-Salas2009): (i) west (W) sampling area (average depth ± SD = 1358.7 ± 137 m), which corresponds to the area where the main trawl fishing grounds for deep-sea species are located (Bensch et al., Reference Bensch, Gianni, Gréboval, Sanders and Hjort2009). This zone is situated along the western slope of the bank, on the HD, where bathymetric and sediment data are available from Spanish multidisciplinary surveys; (ii) east (E) sampling area (average depth ± SD = 1138.0 ± 60 m), which is a medium-depth part located on the eastern slope of the bank, and poorly used by trawlers; (iii) south-east (SE) sampling area (average depth ± SD = 865.9 ± 111 m) located on the upper part of the eastern flank of the bank, and is a fishing ground for blue ling (Large et al., Reference Large, Diez, Drewery, Laurans, Pilling, Reid, Reinert, South and Vinnichenko2010); and (iv) top (T) sampling area (average depth ± SD = 773.1 ± 84 m), located at the top of the Hatton Bank, where trawl fishing effort was historically low.

Fig. 1. Map of the study area showing the start position of the trawl hauls using different symbols depending on the sampling areas (W, western slope; SE, south-eastern slope; E, eastern slope; T, top of the bank). Multibeam bathymetry obtained by the Spanish Institute of Oceanography on the western slope of Hatton Bank is also presented (RP, Rockall Plateau; HD, Hatton Drift; GBB, George Bligh Bank; RB, Rockall Bank).
Survey methodology and data analysis
The experimental survey was developed by the Spanish Institute of Oceanography (IEO) in collaboration with trawl fishermen. The study was undertaken during the second half of 2005, on-board a deep-sea Spanish freezer trawler (1393 gross tonnage capacity; 1420 kw engine power and 61 m length). The objective of the sampling scheme was to study the main trawlable grounds on the Hatton Bank (Figure 1). Trawlable grounds were identified by using: (i) a commercial echo sounder (Simrad ES-500); (ii) any previously available fishery footprint information; and (iii) the skipper's knowledge. A total of 163 valid trawls were analysed. Trawls were carried out using deep-sea bottom trawl gears (Table 1). Two experienced scientific observers travelled on-board the vessel. At each station, they recorded information on: (i) gear characteristics; (ii) location, time and depth at start and end of trawl; (iii) live weight landings and discards; and (iv) by-catch of benthic invertebrates and seabirds. Fish were identified at the lowest possible taxonomic level using available literature. The invertebrates collected were recorded and samples were photographed and taken as ‘voucher' specimens for subsequent final identification in the laboratory. These were preserved in 70% ethanol. Length frequencies (pre-anal length in the case of grenadiers; total length in the case of sharks) of fish species were obtained by taking random samples. Landings were estimated by multiplying processed catches with their corresponding conversion coefficients (Cc) (Cc = weight prior to processing/processed weight). Discards were estimated by weighing samples and extrapolating them. Total catch was calculated as the sum of landings plus discards. Discard rates in weight were estimated as a percentage of total catch (discards in kg × 100/total catch in kg). Catch per unit effort (CPUE) was calculated as a relative index of abundance (CPUE = total catch in kg/trawl time in hours). The CPUE dataset was integrated within a GIS and maps were projected in the UTM coordinate system (Zone-27N). Symbols on such maps were marked at the start position of each trawl for better clarification of images (this needs to be taken into account when analysing the actual geographical location of VMEs, since trawls can cover very long distances). Regional bathymetric contours were obtained from the General Bathymetric Chart of the Oceans (GEBCO) database. Species presence was obtained as a percentage of total trawls (number of trawls where the species was encountered × 100/total number of hauls). Average depth of each haul was considered as the arithmetic mean depth at their start and end positions. The Spanish multidisciplinary surveys carried out between 2005 and 2007 on the western slope of Hatton Bank provided the geophysical data used in this study (Durán Muñoz et al., Reference Durán Muñoz, Sayago-Gil, Cristobo, Parra, Serrano, Díaz del Rio, Patrocinio, Sacau, Murillo, Palomino and Fernández-Salas2009).
Table 1. Technical characteristics of the bottom trawl gears used during the survey.

RESULTS
Distribution of trawlable grounds
The main trawlable grounds were located on the western slope of Hatton Bank (W sampling area) and corresponded to the seabed of the HD (Figure 1). This contourite deposit (HD) follows the slope trend where average gradients vary between 0 and 3° (Sayago-Gil et al., Reference Sayago-Gil, Long, Hitchen, Díaz-Del-Río, Fernández-Salas and Durán-Muñoz2010). Box corer data show that the present day seabed sediments are mainly muddy sands (Durán Muñoz et al., Reference Durán Muñoz, Sayago-Gil, Cristobo, Parra, Serrano, Díaz del Rio, Patrocinio, Sacau, Murillo, Palomino and Fernández-Salas2009). The outcrop area is described as a non-depositional area at the top of the bank (T sampling area) or the slope area that lies adjacent to the top. It is characterized by an uneven surface with ridges and escarpments (gradients of up to 40°) that was produced as a result of tectonic activity and erosion. Such grounds are generally difficult or impossible to trawl on. In some places, a muddy–sandy deposit covers the outcrop (mainly bedrock), which enables possible use of trawls. The eastern slopes of the bank (E and SE sampling areas) are composed of a contourite deposit (mainly sand and mud) located in the westernmost part of the Hatton Basin. Both trawlable and non-trawlable grounds are located along the eastern slopes.
Catch composition and discards
An estimated total catch of 737,255 kg was recorded. In terms of weight, catch composition was dominated by teleosts (Table 2) and grenadiers were observed to be the dominant taxa (Figure 2). This was mainly due to the predominance of Coryphaenoides rupestris (64%) and Trachyrincus murrayi (Günther, 1887) (2.4%). Other macrourids including Roughead grenadier (Macrourus berglax (Lacépède, 1801) were less represented (<1%). Smoothheads—mainly Alepocephalus bairdii—were the next most important component of the catches. Catches of deep-water sharks were dominated by two less marketable species: Centroselachus crepidater (3.3%) and Centroscyllium fabricii (Reinhardt, 1825) (1.8%). The commercial species Centroscymnus coelolepis was poor in the catches at only 0.7%. Molva dypterygia was the dominant lotid (Lotidae). Chimerids (Chimaeriformes), morids (Moridae) such as Lepidion eques (Günther, 1887), Aphanopus carbo (Trichiuridae) and Reinhardtius hippoglossoides (Pleuronectidae) were others that were taken as by-catch. Appendix 1 shows a list of the identified deep-sea fish. Echinoderms (Echinodermata) and sponges (Porifera) were the clearly dominant invertebrates in terms of weight. This was due to large by-catches being concentrated in a few trawls. One seabird (Fulmarus glacialis Linneaus, 1761) was captured during hauling operations. It was later freed and survived. No marine mammals were taken as by-catch.

Fig. 2. Pie chart showing the percentage composition of estimated catches by weight (white sectors, fish; black sector, invertebrates). (1) Grenadiers (67%); (2) smoothheads (11.8%); (3) deep-water sharks (7.4%); (4) chimerids (3%); (5) lotids (2.9%); (6) morids (1.8%); (7) black scabbardfish (1.5%); (8) other fish including Greenland halibut (2%); (9) total invertebrates (2.8%).
Table 2. Catch per unit effort (kg/hr) obtained on the Hatton Bank with bottom trawls, by taxa and sampling areas (W, western slope; SE, south-eastern slope; E, eastern slope; T, top of the bank). The percentage contribution to the total catch (TC), the retained (R) and discarded fractions (D) expressed as percentages of the total catch, and the percentage of presence in the trawls (P) are shown for each taxa. Values <0.1 are represented as +. Taxa are listed by weight.

(1), associated with Parapagurus pilosimanus Smith, 1879.
Discards were generally dominated by grenadiers and deep-water sharks (Figure 3). They represented 38% of the total catch in terms of weight (Table 2) and were composed of non-commercial/less marketable species and small or damaged individuals of commercial species. Morids and most catches by weight of elasmobranchs and chimerids were discarded. Discards of Molva dypterygia were negligible. There were no discards of Reinhardtius hippoglossoides or Centroscymnus coelolepis. Most catches of Coryphaenoides rupestris, Alepocephalus bairdii and Aphanopus carbo were landed. The estimated discard rates for these species were 28%, 18% and 4% by weight respectively. All invertebrates were discarded.

Fig. 3. Estimates of discarded (black) and retained (white) fractions for the main species in terms of weight (catch per unit of effort >5 kg/hr). Species are listed by catch per unit effort (kg/hr).
Distribution patterns of deep-sea fish on trawlable grounds
Table 2 presents CPUE values for main deep-sea fish taxa in each sampling area. Figure 4 shows the values by depth strata. Grenadiers and smoothheads were widely distributed: Coryphaenoides rupestris and Trachyrincus murrayi were found in 99% and 86% of the trawls respectively, while Alepocephalus bairdii was found in 94% of the trawls. Both species were quite abundant along the western slope of the Hatton Bank (Figure 5). The abundance of grenadiers increased with depth and apparently with latitude. Centroselachus crepidater and Centroscyllium fabricii were widespread in the study area (73% and 82% of presence respectively). The former was more abundant along the south-eastern slope while the latter was mainly caught on the western and eastern slopes, preferably at a mid-depth range. The commercial species Centroscymnus coelolepis (27% of presence) was more abundant along the western slope, and also at mid-depths. Skates (Rajiidae) were clearly less abundant than sharks. Hydrolagus mirabilis were present in 50% of the trawls. In general, the highest abundances of chimerids were obtained on shallow grounds such as at the top of the bank. The highest abundances of Lepidion eques (56% presence) and Molva dypterygia (74% presence) were found along the shallowest part of the south-eastern flank of the bank. Reinhardtius hippoglossoides (34% of presence) was abundant in the deepest part of the western slope, and was absent in other grounds. Aphanopus carbo was found in 53% of the trawls. It was mainly caught at intermediate depths, on the eastern flanks of the bank. All other species were pooled into a group called ‘others', and were more abundant at the top of the bank. Most of them had no commercial value.

Fig. 4. Catch per unit effort (kg/hr) for the main taxa of deep-sea fish, by depth (black bars, <1000 m; grey bars, 1000–1300 m; white bars, >1300 m, black line, total) and sampling areas (W, western slope; SE, south-eastern slope; E, eastern slope; T, top of the bank).

Fig. 5. Maps of the study area showing the distribution and abundance of main deep-sea fish ((A) grenadiers; (B) smoothheads). The size of the symbols (white dots) represents the catch per unit effort (kg/hr) on a haul by haul basis (symbols are associated with the start position of the trawl hauls). Note that the scale of the symbols is not the same in the maps. Values = 0 are represented as +.
Distribution patterns of benthic invertebrates on trawlable grounds
Table 2 presents CPUE values for main invertebrate taxa in each sampling area. The presence frequency of VMEs indicator species (FAO, 2009) is shown in Table 3. Distribution and abundance maps for each category of VME are shown in Figure 6, and some records of these species are shown in Figure 7. Echinoderms (Echinodermata) were quite common on trawlable grounds (91% presence) especially sea stars (Asteroidea) and sea urchins (Echinoidea). Large by-catches of Spatangus raschi (Lovén, 1869) mixed with species belonging to the family Echinoturidae (e.g. Calveriosoma sp.) were present in two trawls carried out at the top of the bank (>1000 kg per trawl). Cephalopods (Cephalopoda) were present in 94% of the trawls. They were abundant in the shallow parts of the south-eastern slope and at the top of the bank. Deep-sea crabs were present in 86% of the trawls: Geryoniidae (71%) and Lithodidae (45%) were the most common families found, and showed highest abundances on the deep western slope of the bank. Actinians (Hormathiidae and Actinostolidae) and zoanthideans (Epizoanthus paguriphilus Verrill 1883) were found along the study area (83% and 82% respectively).

Fig. 6. Maps of the study area showing the distribution and abundance of vulnerable marine ecosystem indicator taxa ((A) sponges; (B) gorgonians; (C) sea pens; (D) black corals; (E) cup corals; (F) stony corals). The size of the symbols (white dots) represents the catch per unit effort (kg/hr), on a haul by haul basis (symbols are associated with the start position of the trawl hauls). Note that the scale of the symbols is not the same in the maps. Values = 0 are represented as +.

Fig. 7. Photographs showing some examples of vulnerable marine ecosystem indicator species captured with trawls in the study area. ((A) large sponges; (B) gorgonians; (C) sea pens; (D) black corals; (E) stony corals; (F) cup corals). Examples of large by-catches of sea urchins (G) and large by-catches of sponges (H) are also presented.
Table 3. List of vulnerable marine ecosystems indicator taxa (sponges and cold-water corals) captured with trawls on the Hatton Bank. For each sampling area, the presence of each taxon is presented expressed as a percentage of the trawls conducted in the area and the total number of hauls (W, western slope; SE, south-eastern slope; E, eastern slope; T, top of the bank).

Sponges (Porifera) were present in 19% of the trawls and were more abundant on the eastern slope at a mid-depth range (Figure 8). Of the 11 trawls carried out in the E sampling area, 10 trawls (average depth ± SD = 1131.5 ± 59 m) contained by-catches of large sponges: massive by-catches of demosponges—such as Geodia and Isops species (Geodiidae)—were obtained in eight trawls, while the hexactinellid Pheronema carpenteri (Thomson, 1869) was obtained in just one trawl. Their estimated weights ranged from between 100 and 3000 kg per trawl. Pheronema species was also found in a trawl conducted at the top of the bank. Sponges were absent along the south-eastern slope of the bank (<1000 m depth). However, sponges were present on the western slope, in 20 of the 131 trawls carried out and by-catches were lower (ranging from 0.1 to 25.1 kg per trawl).

Fig. 8. Catch per unit effort (kg/hour) for total cold-water corals and total sponges, by depth (black bars, <1000 m; grey bars, 1000–1300 m; white bars, >1300 m, black line, total) and sampling areas (W, western slope; SE, south-eastern slope; E, eastern slope; T, top of the bank).
Cold-water corals (Scleractinea, Pennatulacea, Gorgonacea and Antipatharia) were generally more abundant at the top of the bank (Figure 8). Stony corals (colonial Scleractinea) were present in 11% of the trawls. Solenosmilia variabilis (Duncan, 1873) was more abundant on the eastern slope and at the top of the bank: 27% of the trawls conducted on the eastern slope and at the top of the bank contained by-catches that ranged from 0.1 to 25.7 kg per trawl. However, only 7% of the trawls conducted along the western and the south-eastern slopes revealed by-catches that were generally lower (ranging from 0.1–2.8 kg per haul). Lophelia pertusa (Linnaeus, 1758) was recorded exclusively in two hauls conducted on the shallow top of the bank (1.2 and 7.7 kg respectively). Cup corals (solitary Scleractinea) were present in 22% of the trawls (<1.0 kg per trawl), distributed mainly along the deep western slope. The most common species found was Flabelum alabastrum (Moseley in Thomson, 1873). Sea pens (Pennatulacea) were captured in 29% of the trawls (≤1.2 kg per trawl). The most common species belonged to the family Anthoptilidae. Gorgonians (Gorgonacea) were present in 8% of the trawls (≤2.2 kg per trawl). The main species found was Callogorgia verticillata (Pallas, 1766) which appeared in seven trawls conducted at the top of the bank. Black corals (Antipatharia) were the least represented taxa (2% presence). Appendix 2 shows a list of the VME indicator taxa recorded.
DISCUSSION
Relationship between seabed geomorphology and trawl footprint
Two main geomorphological domains can be differentiated in the Hatton Bank: (i) outcrop area, mainly located at the top of the bank and composed of a bedrock surface (Smith et al., Reference Smith, White, Kusznir, Doré and Vining2005) with certain areas slightly covered by sediments; and (ii) sedimentary seabed (HD areas) that cover the majority of the slopes and are mainly composed of muddy–sandy deposits. The limit between the two domains was located at ~1100 m water depth (Figure 9), except in the ridge areas described by Sayago-Gil et al. (Reference Sayago-Gil, Long, Hitchen, Díaz-Del-Río, Fernández-Salas and Durán-Muñoz2010), where part of the outcrop was found deeper.
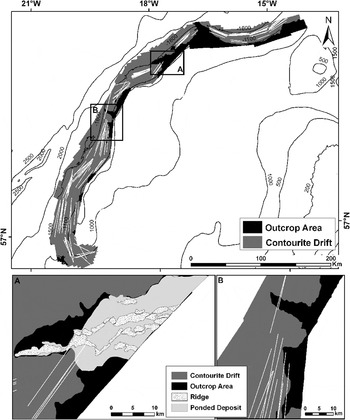
Fig. 9. Sketch showing the two main domains—outcrop area and contourite drift (part of the Hatton Drift)—identified in the main trawl fishing grounds prospected with multibeam echosounder (western slope of the Hatton Bank). The positions of the trawl hauls (based on start and end of trawl operations) are shown superimposed on the surveyed area. Details of the ridge areas (A) and central outcrop areas (B) are presented.
Benn et al. (Reference Benn, Weaver, Billet, van den Hove, Murdock, Doneghan and Le Bas2010) reported that the spatial extent of the trawl footprint is mainly concentrated along the western slope of the Hatton Bank. Seabed geomorphology is an important variable that determines extent of the spatial fisheries footprint wherein fishing gear contacts the seafloor during fishing operations (e.g. towed gears). However, there are several reasons that may explain why trawl footprint is preferably located along the western slope between ~1000 and 1500 m depth, namely: (i) the highest abundance of two main target species (Figure 5); (ii) a gentle seabed that forms an extensive good trawling area (HD) from the boundary between both domains (~1100 m depth) towards deeper waters; and (iii) the common fishing practice of deep-sea trawlers—only a few long tows per fishing day to minimize number of shooting and hauling operations, and also to optimize towing opportunity (Durán Muñoz et al., Reference Durán Muñoz, Sayago-Gil, Cristobo, Parra, Serrano, Díaz del Rio, Patrocinio, Sacau, Murillo, Palomino and Fernández-Salas2009). This suggests that in the Hatton Bank the deep-sea bottom trawl technique is particularly applicable where there are large slopes with smooth sediment covered surface (e.g. HD) (Figure 9). These may be the reasons why trawling preferably occurs on the extensive areas of the HD. But trawling is also feasible in other places of the outcrop area where the rock is covered by a thin sediment veneer or ‘ponded deposits' (Figure 9A) which is a mixture of sediment with coral rubble trapped by the ridges acting as barriers. This suggests that benthic communities on the sedimentary slopes of the HD may have been strongly influenced by trawling, at least when compared with the communities on the rough outcrop and at the top of the bank, where less trawlable grounds are available.
Effects on target and by-catch fish species
In the present case, and just as in previous studies (Connolly & Kelly, Reference Connolly and Kelly1996; Allain & Kergoat, Reference Allain and Kergoat1997; Clarke et al., Reference Clarke, Borges and Officer2005), trawl catch composition was clearly dominated by deep-sea teleosts, particularly grenadiers and smoothheads (Figure 2). Both fisheries resources were more abundant along the deep western slope (Figure 5). This suggests that they have high catchability to bottom trawling, especially in soft sedimentary deep-sea habitats such as the HD. Length distributions of the two main grenadier species, when compared with minimum size at sexual maturity, indicated that bottom trawl appears to be a low-selective gear: both juvenile and adult grenadiers were captured on the same grounds, although mature fish were predominant. The commercial grenadier Coryphaenoides rupestris ranged in length from 5 to 26 cm (mantle length (ML) = 14.3 cm, N= 6021) and 89% of the individuals recorded were larger than 11.5 cm in length—their size at maturation (Allain, Reference Allain2001). The rate of discards and length composition of discarded fish (length range (LR) = 5.5–19.5, ML = 10.4 cm, N = 640) were similar to previous data (Lorance et al., Reference Lorance, Large, Bergstad, Gordon, Orlov and Iwamoto2008). 92% of Trachyrincus murrayi, the most abundant non-commercial grenadier, were larger than 12 cm in length (LR = 8.5–20.5 cm, ML = 15.2 cm, N = 425)—their size at maturation (Lorance et al., Reference Lorance, Large, Bergstad, Gordon, Orlov and Iwamoto2008). Discards rate of Alepocephalus bairdii was lower than that of Coryphaenoides rupestris (Figure 3) indicating that Alepocephalus bairdii is a target species (Bensch et al., Reference Bensch, Gianni, Gréboval, Sanders and Hjort2009) in its own right on the Hatton Bank. It is worth noting that this is infrequent in other deep-water trawl fisheries that operate to the west of the British Isles, where smoothheads are the main non-macrourid discards species (Connolly & Kelly, Reference Connolly and Kelly1996; Allain & Kergoat, Reference Allain and Kergoat1997; Allain et al., Reference Allain, Biseau and Kergoat2003; Lorance et al., Reference Lorance, Large, Bergstad, Gordon, Orlov and Iwamoto2008). With regard to Centroselachus crepidater, 73% of individuals measured (LR = 28–88 cm, ML = 74.0 cm, N = 334) were larger than 68 cm in length—their size at female maturation (Clarke et al., Reference Clarke, Connolly and Bracken2001). No dense aggregations of Molva dypterygia or Reinhardtius hippoglossoides were found because the survey was undertaken outside their spawning seasons. Chimerids were clearly more abundant at the top of the bank. A large part of this area (~11,300 km2) is currently closed (EC, 2009; NEAFC, 2011), suggesting that interactions between bottom fishing and chimerids have probably decreased over the past years.
Present results on discards cannot be directly extrapolated for the commercial fleet, because discards depend on several factors (gear used, mesh, market considerations, etc.). The discards ratio observed during this experimental survey was a consequence of trawl catch composition on the sedimentary grounds: catches were largely dominated by grenadiers although Coryphaenoides rupestris is the only currently marketable species. Macrourus berglax has commercial value but catches were negligible. Moreover, the trawl gear used in this survey appeared to be poorly selective: small individuals (that were discarded) and large ones (that were landed) were present in the catches. Most deep-water sharks captured were of low value and therefore just two shark species were landed. Alepochephalus bairdii, Molva dypterygia, Aphanopus carbo and Reinhardtius hippoglossoides were other species landed due to their commercial value. Chimerids were occasionally retained on-board. A group denominated ‘others' was generally discarded (Table 2). It included a wide variety of teleost fish species of minor importance in terms of weight (Appendix 1). The current restrictive quotas for most of the above mentioned deep-sea species and the ban on shark fisheries (EC, 2010) suggest that the viability of the multispecies trawl fishery is now being questioned. Severe current catch restrictions mean that trawl fishing effort on the Hatton Bank will remain at a very low level.
Effects on vulnerable marine ecosystems
The by-catch data did not provide any clear evidence of overlapping between trawling and dense sponge communities on the deep western slope or in the shallow parts of the bank. But the eastern slope of the Hatton Bank (E sampling area, from 57o30′N to 59o00′N) appears to be an important location for aggregations of structure-forming sponges within a narrow depth range (~1060–1250 m depth) similar to that found by other authors in adjacent areas (Rice et al., Reference Rice, Thurston and New1990). Large-sized species characteristic of sponge-dominated biotopes (Barthel et al., Reference Barthel, Tendal and Tiel1996; Klitgaard & Tendal, Reference Klitgaard and Tendal2004) were recorded in most of the trawls conducted there: generally sponges were the dominating taxon, representing at least 60% of the biomass excluding fish (reaching >90% in three cases). The massive by-catches of sponges are called ‘patatada' by Spanish fishers, meaning ‘lots of potatoes' (this refers to the amounts, the shape and colour of such sponges). Sponge by-catches from the same area had also been reported previously (Durán Muñoz et al., Reference Durán Muñoz, Murillo, Sayago-Gil, Serrano, Laporta, Otero and Gómez2011). The area is located outside the current closure boundaries (NEAFC, 2011) suggesting that sponges may be potentially threatened by bottom fisheries. Limited overlapping between trawling and cold-water corals was observed within the main trawler fishing grounds: most records were associated with accidental trawls over outcrop areas (Figure 9B) that were closed to fishing in 2009 (~4600 km2) (NEAFC, 2010). Records of sea pens were observed throughout the study area but it is unclear whether these low by-catches indicate sea pen communities. Reef builders and coral garden components were quite abundant at the top of the Hatton Bank. Some sponges and dense aggregations of sea urchins were likewise recorded there. This confirms that the top of the bank is a key area for VMEs and biodiversity as was reported previously (Roberts et al., Reference Roberts, Henry, Long and Hartley2008; Durán Muñoz et al., Reference Durán Muñoz, Sayago-Gil, Cristobo, Parra, Serrano, Díaz del Rio, Patrocinio, Sacau, Murillo, Palomino and Fernández-Salas2009, 2011; Howell et al., Reference Howell, Davies and Narayanaswamy2010). A large part of this area (~11,300 km2) is currently closed to bottom fishing, suggesting that VMEs in this part of the bank are now adequately protected. Several records indicate that indicator species also present near the eastern closure boundary.
These results should be used with caution because the present study was mainly based on by-catch records and limited sampling effort. The survey suggests a low abundance of cold-water corals and sponge aggregations on the preferred bottom trawling fishing grounds. Such paucity may be a consequence of varying suitability of environmental conditions for such species or historical trawling activity (Murillo et al., Reference Murillo, Durán Muñoz, Altuna and Serrano2011). Environmental variables are factors that influence the distribution of VME indicator species (Barthel et al., Reference Barthel, Tendal and Tiel1996; Mortensen et al., Reference Mortensen, Hovland, Fossa and Furevik2001; Klitgaard & Tendal, Reference Klitgaard and Tendal2004). Some such as seabed morphology (Sayago-Gil et al., Reference Sayago-Gil, Long, Hitchen, Díaz-Del-Río, Fernández-Salas and Durán-Muñoz2010), habitats and fisheries (Durán Muñoz et al., Reference Durán Muñoz, Sayago-Gil, Cristobo, Parra, Serrano, Díaz del Rio, Patrocinio, Sacau, Murillo, Palomino and Fernández-Salas2009, 2011; Benn et al., 2010) have been studied previously. The uneven surface of the outcrop (where trawling effort is low) is a suitable platform for most cold-water corals, and the gentler sedimentary deposits of the western (main trawling grounds) and eastern (less used grounds) slopes of the bank seem to be preferred by large sponges. Seabed characteristics (e.g. topography, substratum, etc.) and obviously fishing impact may have influenced the current distribution of these species. Food availability could probably be a key factor because they are filter feeders (Rice et al., Reference Rice, Thurston and New1990; Barthel et al., Reference Barthel, Tendal and Tiel1996). Dense aggregations of sponges were only found on the eastern flank of the Hatton Bank in a narrow depth range. This may indicate the presence of different water masses (Klitgaard & Tendal, Reference Klitgaard and Tendal2004) along the western and eastern slopes. Further research into oceanographic parameters is needed to clarify the role played by bottom currents in the distribution of the Hatton Bank VME indicator species (e.g. food supply, temperature, salinity, etc.).
Bottom trawling produces impacts on VMEs when their distributions overlap with that of the trawl fishery spatial footprint. Many such impacts can be successfully avoided by closing areas to fishing, just as was done by the NEAFC and the EU. The present study supports the closure of the Hatton Bank (EC, 2009; NEAFC, 2010; EU, 2011) and also suggests some areas of VME indicator species near the eastern closure boundary, thus suggesting revision of closure boundary limits.
ACKNOWLEDGEMENTS
We are grateful to the skipper and crew of the trawler for technical support and cooperation during operations at sea. M. López and E. González were the on-board observers who took photographs, collected data and the samples. Thanks are also due to the IEO (E. Román) and to the University of Vigo (Marine Zoology Group) for assistance with fish and benthos taxonomy respectively. We also thank the anonymous referees for their constructive suggestions on the draft manuscript. The survey was funded by the Spanish General Secretary of the Sea (SGM), the European Union (EFF) and the Spanish Institute of Oceanography (IEO) under the ECOVUL/ARPA project.
Appendix 1. List of deep-sea fish captured with trawls in the Hatton Bank.

Appendix 2. Vulnerable marine ecosystems (VMEs) indicator taxa captured with bottom trawls in the Hatton Bank. Sampling area (SA), start and end positions of the haul (Lat, latitude; Long, longitude), average depth (m) and estimated catch in live weight (kg) are given (SG, sponges; GO, gorgonians; SP, sea pens; BC, black corals; CC, cup corals; SC, stony corals). Values <0.1 are noted as +.


