


Introduction
In a recent paper reviewing the recalculation of atomic cell formulae for nepheline solid solutions (Henderson, Reference Henderson2020), the approach followed by Barth (Reference Barth1963) was adopted to report the molecular proportions of the end-member molecules for nepheline (Ne,Na8Al8Si8O32), kalsilite (Ks,K8Al8Si8O32), Ca-nepheline (CaNe,□Ca4Ca4Al8Si8O32, cf. anorthite) and excess Si (Qxs, □Si8Si16O32). Following Barth, it was emphasised that the entry of Ca into extra-framework cavity sites and excess Si into the three-dimensional framework is accompanied by formation of a fixed numbers of vacant sites in the cavities (denoted □Ca and □Si). Many authors have not reported the presence of Mg (and Mn) in nepheline compositions and some consider these elements might be present as impurity or alteration phases (e.g. Dollase and Thomas, Reference Dollase and Thomas1978). Henderson (Reference Henderson2020) considered that small divalent atoms (e.g. Mg) could substitute for quadrivalent and trivalent tetrahedral cations in the framework to form the nepheline/kalsilite end-member molecule K8T2+4Si12O32. Note that Netotal would include Al and Fe3+ as T3+ components and Kstotal would contain both T3+ and T2+ components. Henderson pointed out that, in examples where MgO had been analysed for specifically by other authors, its concentration level was generally <0.1 wt.%. It was assumed that such small concentrations would have little effect on the calculation of excess Si values which, in any case, would be the main repository for the effects of any analytical error as explained by Henderson (Reference Henderson2020). However, it was recommended that nepheline analyses should also include reliable MgO and MnO contents; and that Na determination should be carried out with low beam currents and an unfocussed electron beam to minimise Na loss (Morgan and London, Reference Morgan and London2005).
Recently, it has been recognised that some strongly Si-undersaturated (i.e. feldspar-free) mafic potassic/ultrapotassic volcanic rocks from central Brazil contain K-rich nepheline and kalsilite with relatively high Mg contents (up to 0.54 wt.% MgO), which show a strong positive correlation with Fe contents. To take account of these data some of the equations from table 2 in Henderson (Reference Henderson2020) need to be modified to include terms for the tetrahedral divalent element content. This stoichiometric approach is also used to assess whether the valence state of Fe could be deduced. In this paper we present revised equations for the calculation of stoichiometric nepheline formulae with revised spreadsheets for both the original ‘total Na’ and ‘corrected Na’ spreadsheets, together with consideration of a new approach for estimating Fe valence; the necessary explanations of the spreadsheet derivation and use are included as well.
Variables and equations in spreadsheets 1 (‘total Na’) and 2 (‘corrected Na’)
Deducing the changes necessary for the recalculations follows the same approach used by Henderson (Reference Henderson2020) where end-member nepheline component compositions and hypothetical nepheline (and kalsilite) solid-solution compositions are used to confirm the validity of the formulae. For spreadsheet 1, these include data for the end-members Ne, Ks, CaNe, excess Si′ (Q′, □Si8Si16O32), K8T2+4Si12O32 (denoted KsT2+ here) and a hypothetical solid solution □Ca0.4□Si0.8Na4K2.4Ca0.4Al6Si9O32. The latter component contains 1.6 atoms of excess Si which accounts for the Si vacancy of 0.8 ‘atoms’, whereas the Ca vacancy value matches the amount of Ca in the cavity site (see Henderson, Reference Henderson2020).
The numbering of equations 1 to 14 is identical in Table 1 to the original formulae given in Henderson (Reference Henderson2020, table 2), however, the new versions of equations 1, 2 and 10, and the formulation of the ΔAlcc and ΔTch stoichiometry parameters, must also include the atomic proportions of the sum of tetrahedral T2+ atoms (normally mainly Mg). These changes can be rationalised as follows:
Table 1. Formulae for calculations based on 32 oxygen nepheline structure unit cell modified for entry of divalent cations (T2+) into tetrahedral sites.*
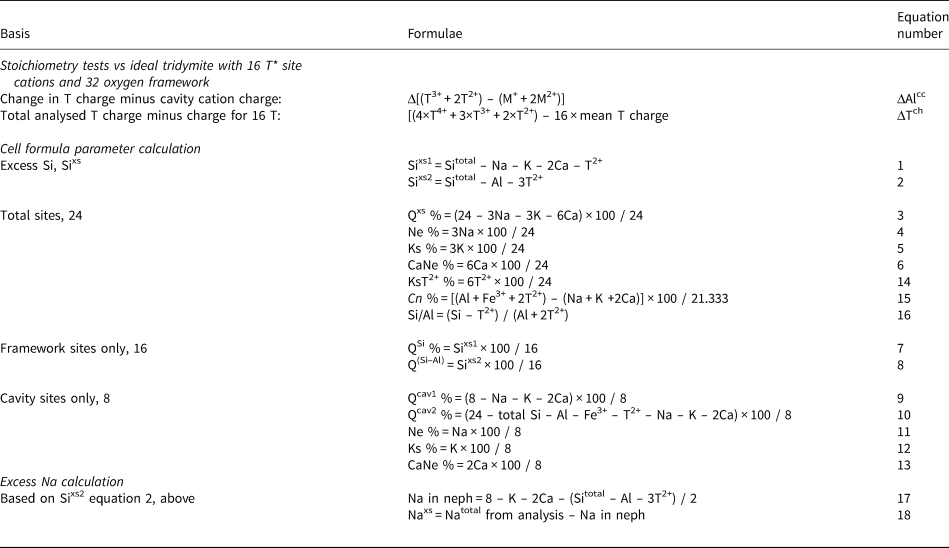
*Footnotes: T = tetrahedral cations in framework; M = cavity atoms in interframework cation sites.
Possible T site occupants: T4+ = Si, Ti and Ge; T3+ = Al, Fe3+ and Cr3+; T2+ = Mg and Fe2+, Mn, Ni, Co and Zn; M+ = Na, K and Rb; M2+ = Ca, Sr and Ba.
Table 2. End-member nepheline group compositions and atomic and molecular formulae data calculated in Spreadsheet 1.

$ PRS refers to Petrogeny's Residua System Ne–Ks–Quartz; & Note that no cavity cations are present in the ‘tridymite’ end-member. Neph. = nepheline; Kals = kalsilite.
Analyses: [1] NaAlSiO4, Ne; [2] Na3KAl4Si4O16, ‘ideal’ nepheline; [3] KAlSiO4, Ks; [4] CaAl2Si2O8, Ca–Ne; [5] Si2O4 Q; [6] K2MgSi3O8, KsT2+–Ne; [7] Na50Ks15CaNe10KsM15Q10; [8] Dawson et al. (Reference Dawson, Smith and Steele1995); [9] Trupia and Nicholls (1996); [10] Berkesi et al. (Reference Berkesi, Bali, Bodnar, Szabo and Guzmics2020); [11] Paslick et al. (Reference Paslick, Halliday, Lange, James and Dawson1996); [12] Sgarbi and Valença (Reference Sgarbi and Valença1995); [13] Edgar (Reference Edgar1979); [14] Allan and Carmichael (Reference Allan and Carmichael1984); [15] Sahama (Reference Sahama1954); [16] and [17] ideal hydroxycancrinite – Na8Al6Si6O24(OH)2.2H2O.
ΔAlcc – replacement of one Si by one Al in the framework is accompanied by the entry of one univalent alkali element cation into a cavity within the ‘stuffed-tridymite’ framework (Buerger, Reference Buerger1954). The substitution of one divalent T2+ (e.g. Mg) for one Si in the framework therefore allows the entry of two univalent cavity cations; thus, double the atomic proportion of the T2+ species is equivalent to one T3+ (Al) species. The redefinition shown in Table 1 (top row) is required to quantify how the positive charges on the framework cations match those for the contents of the interframework cavities.
ΔTch – the change here is straightforward so that the correct average T site valency is calculated (Table 1, second row).
Sixs1 – the original formulation (Henderson Reference Henderson2020) is correct as long as tetrahedral T3+ cations (Al and Fe3+) are the only framework cations to be associated with the cavity cations. However, we have shown that entry of a framework divalent cation is associated with the entry of one extra univalent cavity cation which explains the necessity of adding the associated extra T2+ term to match the amount of extra M+ (equation 1). The same explanation accounts for the addition of the T2+ term to the Qcav2 calculation (equation 10, Table 1).
Sixs2 – the ideal end-member for the KsT2+ phase has a Si/Mg ratio of 3 (K2MgSi3O8) so that this requires the additional amount of 3T2+ to be subtracted from the total Si amount to give an estimate of the excess Si in equation 2.
Equation 15 – the modification to the calculation of the peraluminous parameter Cn % follows the change to the ΔAlcc term (see above).
Equation 16 – we consider that it makes sense to calculate a value for the Si/Al ratio that has a value of 1 for the component of a solid solution that only has a value for the T3+ end-members. Thus, the calculation shown here subtracts the atomic proportion T2+ from the total Si; that value represents the Si associated with the extra univalent cavity cation amount. The T3+ term is increased by the amount of framework T2+ that is equivalent to the total T3+. However, note that analyses with high T2+ contents will be displaced from those with low T2+ in plots of Si/Al vs ΔAlcc/ΔTch as defined by Henderson (Reference Henderson2020).
The equations in Table 1 are used here to update the two spreadsheets that were attached to the Henderson (Reference Henderson2020) paper on nepheline. These revised spreadsheets are attached to the present paper as Supplementary files 1 (total Na file) and 2 (corrected Na file). We have rerun the original Henderson (Reference Henderson2020) dataset with the revised spreadsheet and have confirmed the original delta values except some with significant MgO contents (see below). Table 2 shows the key data for model end-member compositions and for representative published analyses of nephelines and kalsilites. The Henderson (Reference Henderson2020) paper concentrated on sodic nephelines which constituted the database compiled for that work, many being from syenitic rocks where feldspathoids coexist with essential alkali feldspars. The present data set now includes analyses for potassic nephelines and kalsilites, some of which are from more basic rock types, including foidites, where nepheline might not coexist with alkali feldspar. We have also updated the equations in Supplementary file 2 (corrected Na file) to match those in Table 1; however, we have chosen to define equation 17 using the Q(Si–Al) proportion to estimate the vacancies associated with the excess Si content (i.e. Q(Si–Al)/2; see Henderson, Reference Henderson2020). In Spreadsheet 2 and in Table 2 (columns 16 and 17) we also clarify how the possible presence of a cancrinite component in a Na-rich nepheline solid solution can be estimated.
We have adopted the composition of an ideal water-free, basic hydroxycancrinite as a possible cancrinite end-member (e.g. Hassan and Grundy, Reference Hassan and Grundy1991; Deer et al., Reference Deer, Howie and Zussman2004). This phase has the ideal composition SiO2 38.668, Al2O3 32.809, Na2O 26.592 wt.% and the formula can be written as Na8Al6Si6O24(OH)2; the atomic formula can thus be calculated on an anhydrous basis as Na8Al6Si6O25 + H2O. The aluminosilicate framework has a stuffed tridymite structure based on linked six rings of tetrahedra similar to those in nepheline. This framework has 6Na as network modifying cavity cations with the other two Na complexed with the hydroxyls occupying the large cancrinite ‘cages’. However, the atomic formulae for cancrinite compounds is usually calculated on the basis of 12 tetrahedral Si + Al + Fe3+ cations (e.g. Deer et al., Reference Deer, Howie and Zussman1966, Reference Deer, Howie and Zussman2004; Hassan and Grundy, Reference Hassan and Grundy1991), and the same cation and anion numbers would be obtained on the basis of a 25 oxygen anhydrous phase calculation (see Spreadsheet 1, bottom rows). Henderson (Reference Henderson2020) recalculated cancrinite phase compositions on a 32 oxygen basis for direct comparison with the data for nephelines from different rock types but incorrectly defined this phase as having the formula Na8[Al8Si8O32]⋅(NaOH)2⋅nH2O. In Table 2 of this paper and in Spreadsheet 2 we show that to report the nepheline-like framework for cancrinite on an 8 cation basis it is necessary to multiply the tetrahedral cation numbers by the factor 1⅓ to convert from 12 to 16; in that case a 25 oxygen cancrinite cell should be recalculated on a 25 × 1⅓ oxygen (33⅓ O) basis (see last two columns in Table 2). In Spreadsheet 2 we show how the amount of excess Na in a cancrinite-like component can be calculated as the amount of Na in the nepheline solid solution that can be correlated with that cancrinite-like phase. However, we continue to calculate these phases on a 32 oxygen, nepheline-cell basis, which would have the anhydrous end-member cancrinite-like formula of Na10.24[Al7.68Si7.68O32] and the proportion of Na present as a hydroxycancrinite phase could be estimated as Naxs × 100/10.240 mol.% (Supplementary spreadsheet 2).
Explanation of changes
The first 3 columns in Table 2 show end-member compositions for end-members Ne and Ks together with the intermediate Na3K-nepheline ‘compound’. Also shown are data for the ‘tridymite end-member’ (Q), the Ca-nepheline composition (CaNe), and the hypothetical, stuffed tridymite KsT2+-end-member. On the basis of the 32 oxygen nepheline unit cells, the first three compositions show the stoichiometric number of tetrahedral framework sites (T = 16) and cavity cation sites (M = 8) making totals of 24 sites per unit cell. No cation site vacancies are present. The CaNe data show the presence of 16 T sites and 4 Ca atoms in the M sites (20 cations); thus 4 of the cavity sites are vacant (denoted □Ca here). The tridymite end-member has only Si in the T sites (16) and all the potential cavity cation sites are empty showing the presence of 8 vacant sites (denoted □Si here). The KsT2+-end-member also has filled T sites (12Si plus 4Mg) and all cations sites are filled with K. None of these examples has excess Si. The 7th column shows the composition of a hypothetical sample that is a solid solution containing Ne (50 mol.%), Ks (15%), CaNe (10%), KMg-nepheline (15%) and an excess silica component (Qxs) of 10%. The 16 tetrahedral framework sites contain 9.4 Si, 6 Al and 0.6 Mg atoms (T = 16). The cavity cations are 4 Na, 2.4 K and 0.4 Ca (total 6.8 atoms) leading to 0.4 vacancies associated with the entry of Ca, and 0.8 vacancies associated with 1.6 atoms of excess Si in the framework; thus, the species for all the 8 cavity cation sites are accounted for. The cell formulae given in Table 2 for these compositions were calculated using spreadsheet 1 together with the data for the delta parameters and the nepheline end-member mol.% values. The equations defined in Table 1 are shown to be correct when applied to the wt.% oxide analytical data that are input to the spreadsheet (column 8 forwards).
The ΔAlcc and ΔTch stoichiometry parameter values (Table 1) are effectively zero for the end-member compositions shown here, though the wt.% values given for the solid solution in column 7 have finite, very small values with a ΔAlcc/ΔTch ratio of 1.130 which is the expected ratio for a Si-rich nepheline solid solution (Henderson, Reference Henderson2020). In Table 2 columns 8 and 9 give data for two natural nepheline analyses referred to in Henderson (Reference Henderson2020), columns 10 and 11 have analysed data also considered by Henderson (Reference Henderson2021), column 12 is the average of 5 analyses for kalsilite from Brazilian kamafugitic rocks (Sgarbi and Valença, Reference Sgarbi and Valença1995) and columns 13 to 15 are for naturally occurring kalsilite analyses from Deer et al. (Reference Deer, Howie and Zussman2004; analyses 7, 8 and 13); Columns 16 and 17 give the data for the hydroxycancrinite referred to above.
Henderson (Reference Henderson2020) stressed the importance of the analysis of the nepheline in Table 2 column 8 (Dawson et al., Reference Dawson, Smith and Steele1995) in that it contained a much higher MgO content (0.33 wt.%) than any of the other samples from the syenite database that have reliable electron microprobe analyses. This sample has 2.45 mol.% of the chosen KsT2+ end-member and Henderson commented that the relatively high Mg content would not affect the calculated excess silica value for Qxs which was his chosen Q′ parameter. The other equations for calculating Q′ (Table 2) confirm that QSi, Qcav2 and Q(Si–Al) are all dependent on the T2+ content; note that Henderson stressed the importance of obtaining reliable microprobe data for Mg and Mn in this mineral. However, the ΔAlcc and ΔTch stoichiometry parameters used in that paper did not contain terms for T2+ atoms (cf. Dollase and Thomas, Reference Dollase and Thomas1978) and show a higher value for ΔTch, and thus a lower ΔAlcc/ΔTch ratio than expected for a reliable nepheline analysis. Note that the original delta data are also given in Table 2. The newly defined delta values take account of the T2+ content (Table 1) and the ‘new’ values are lower with a delta ratio of 1.132 confirming that it is a reliable nepheline analysis. The ‘old’ delta parameters for the analyses given in columns 9 to 11 in Table 2 also show ΔAlcc/ΔTch ratios that depart from the values expected for good analyses whereas the newly defined ratios are all entirely consistent with them being reliable analyses with the lower ΔAlcc/ΔTch reflecting their Si-rich character. It is clear that MgO plus MnO contents of as low as 0.12 wt.% show the importance of using the newly defined delta parameters, which in turn points to the importance of obtaining reliable analyses for these elements in nepheline. Each of these four nephelines shows a range of estimates for the different Q′ values reflecting their different levels of non-stoichiometry.
Compositions shown in columns 12–14 are microprobe analyses for groundmass kalsilite in K-rich alkaline volcanic rocks; based on the newly defined delta parameters all are reliable analyses with the first two showing significant MgO contents of ~0.5 wt.% MgO. The analysis given in column 15 is from an ultrabasic mafurite from Uganda and is based on ‘classical’ wet chemical analyses (Potts, Reference Potts1987; ch. 2) of a separated mineral with ~1–2% of impurity phases. Sahama (Reference Sahama1954) commented that some of the Fe, Mg and Ca might come from the impurities, though they suggest that kalsilite itself contains significant amounts of these elements. The ‘new’ ΔAlcc and ΔTch parameters and ratios are all consistent with the kalsilite analysis being reliable, although the wide range of the differently defined Q′ values must reflect the contributions from impurity phases. However, the chemically analysed separate values for Fe3+ and Fe2+ in this sample, and for others in Smith and Sahama (Reference Sahama1954), all look plausible (average Fe3+/Fe2+ for 14 samples 3.9 ± 1.3), confirming that the main valence state for Fe in magmatic rocks is Fe3+ (see below).
Finally, the last two columns give the calculated composition for the hypothetical hydroxycancrinite end-member with cell formulae calculated to both 32 and 33⅓ oxygens; note that the correct data for cell formulae have much smaller delta parameters for the 33⅓ O cell than for the incorrect 32 O cell, however both have the same ideal ΔAlcc/ΔTch ratio of 1.143.
We also deal with the revised corrected Na file (Spreadsheet 2). Henderson (Reference Henderson2020, Reference Henderson2021) used the Q(Si–Al)/2 parameter in the estimation of ‘excess’ Na and we have continued with that approach here. The results for representative nephelines and kalsilites are detailed in Spreadsheet 2 and summarised in Table 3. This calculation was developed by Henderson (Reference Henderson2020) to quantify the presence of a possible cancrinite solid-solution component in nephelines from peralkaline, silica-undersaturated magmatic rock series. Inevitably, analyses with deficient alkalis compared with Al and Fe3+ (apparent normative Cn) would show negative Naxs values and vice versa; thus, Henderson advised caution regarding the application of this calculation as a petrogenetic tool. The same advice is relevant here though we provide data for two groups of nephelines. The first four analyses in Table 3 (columns 1 to 4) are all from basic, alkaline hypabyssal sills (Gibb and Henderson, Reference Gibb and Henderson1978; Wilkinson and Hensel, Reference Wilkinson and Hensel1994) or volcanics (Cucciniello et al., Reference Cucciniello, le Roux, Jourdan, Morra, Grifa, Franciosi and Melluso2018; Melluso et al., Reference Melluso, Tucker, Cucciniello, le Roex, Morra, Zanetti and Rakoroson2018) which are characterised by very high excess Q′, high Ne and generally low Ks; such phases might have crystallised at relatively high temperatures and before alkali feldspar was precipitated. Gibb and Henderson (Reference Gibb and Henderson1978) pointed out that such compositions plotted outside of the stability field of nepheline and might thus have formed metastably. Such a process might explain their high excess Q′ contents (up to ~20 mole %) and low Ks contents with bulk compositions approaching that of a hypothetical anhydrous analcime composition. More research is needed to understand such compositions. The other analyses in Table 3 are for nephelines, mainly from foidites and nepheline syenites, with more normal silica contents (40–46 wt.% SiO2 with variable Q(Si–Al) from ~10 to 1 mol.%); these are generally more potassic and most are likely to have equilibrated with alkali feldspars. Note that the ‘peralkaline’ samples from Oldoinyo Lengai and Shombole volcanoes (columns 6, 11–15) have a range of excess Q values (1.5–6 mol.%), and variable Naxs levels which are difficult to calculate reliably because of analytical and stoichiometric uncertainties; however, the Shombole sample (column 15) has the highest Naxs of 0.53 atoms / 32 O which is equivalent to ~5 mol.% of the hydroxycancrinite end-member (cf. vishnevite). Better and complete analyses are required to assess these parameters more carefully.
Table 3. Data from corrected Na spreadsheet showing results for ‘excess’ Na and possible cancrinite contents.

Sample sources: [1] Gibb and Henderson (Reference Gibb and Henderson1978); [2] Wilkinson and Hensel (Reference Wilkinson and Hensel1994); [3] Cucciniello et al. (Reference Cucciniello, le Roux, Jourdan, Morra, Grifa, Franciosi and Melluso2018); [4] Melluso et al. (Reference Melluso, Tucker, Cucciniello, le Roex, Morra, Zanetti and Rakoroson2018); [5] Paslick et al. (Reference Paslick, Halliday, Lange, James and Dawson1996); [6] Berkesi et al. (Reference Berkesi, Bali, Bodnar, Szabo and Guzmics2020); [7] Melluso et al. (Reference Melluso, Srivastava, Petrone, Guarino and Sinha2012); [8] Blancher et al. (Reference Blancher, D'Arco, Fonteilles and Pascal2010); [9] Zhu et al. (Reference Zhu, Yang, Sun, Zhang and Wu2016); [10] Andersen et al. (Reference Andersen, Elburg and Erambert2017); [11] Dawson et al. (Reference Dawson, Smith and Steele1995); [12] Dawson and Hill (Reference Dawson and Hill1998); [13] Mitchell and Dawson (Reference Mitchell and Dawson2007); [14] Kjarsgaard and Peterson (Reference Kjarsgaard and Peterson1991); [15] Peterson (Reference Peterson1989); [16] Hamada et al. (Reference Hamada, Akasaka and Ohfuji2019); [17] and [18] Tappe et al. (Reference Tappe, Foley and Pearson2003).
Fe valence considerations
Feldspars are the main aluminosilicate minerals and are essentially stoichiometric with only trivalent Al and Fe3+ substituting for Si in the tetrahedral framework sites. Nepheline, by contrast, has a much more ‘flexible’ structure and ‘small’ divalent tetrahedral cations (mainly Mg with less common Mn) are commonly present in minor concentrations, especially in K-rich nepheline solid solutions and kalsilite (see paper 2). These phases are enriched in Fe and it is possible, if Mg and Mn are present, that a significant amount of Fe2+ might also be present. Ideally, microprobe analyses of these phases should include determination of both oxidation states of Fe however this is far from straightforward. Specialised techniques that could provide useful information include application of K- and L-edge X-ray absorption spectroscopies (XAS), the latter being particularly rich in information on the chemical and structural state of multivalent transition elements in minerals and glasses (e.g. Cressey et al., Reference Cressey, Henderson and van der Laan1993; Henderson and Foland, Reference Henderson and Foland1996; Schofield et al., Reference Schofield, Smith, Scholl, Doran, Covey-Crump, Young and Ohldag2014). Microprobe and high-resolution imaging techniques include Fe K-edge X-ray absorption spectroscopy (EXAFS and XANES; e.g. Fiege et al., Reference Fiege, Ruprecht, Simon, Bell, Gőttlicher, Newville, Lanzirotti and Moore2017; Suga et al., Reference Suga, Suzuki, Usui, Yamaguchi, Sekizawa, Nitta, Takeichi and Takahashi2021), scanning transmission X-ray microscopy (STXM; Carrière et al., Reference Carrière, Dillmann, Neff, Dynes, Linard, Michau and Martin2019; Pattammattel et al., Reference Pattammattel, Leppert, Aronstein, Robinson, Mousavi, Sioutas, Forman and O'Day2021; Suga et al., Reference Suga, Suzuki, Usui, Yamaguchi, Sekizawa, Nitta, Takeichi and Takahashi2021), X-ray photo electron emission spectroscopy (XPEEM; Schofield et al., Reference Schofield, Smith, Scholl, Doran, Covey-Crump, Young and Ohldag2014; Pattammattel et al., Reference Pattammattel, Leppert, Aronstein, Robinson, Mousavi, Sioutas, Forman and O'Day2021) and electron energy-loss spectroscopy (EELS; Brown et al., Reference Brown, Hillier and Brydson2017; Pattammattel et al., Reference Pattammattel, Leppert, Aronstein, Robinson, Mousavi, Sioutas, Forman and O'Day2021). The first three techniques require synchrotron radiation and the last specialised TEM facilities; none are in routine application for petrological and geochemical research on magmatic rocks though note that Baudouin (Reference Baudouin2016) has used Fe K-edge XANES to analyse a nepheline phenocryst from a Mg-poor nephelinite from Tanzania and has reported an Fe3+/total Fe ratio of 0.93. We have considered how stoichiometric recalculation methods (e.g. Droop, Reference Droop1987), based on an ideal 16.0 T-site framework, could be used to recalculate a wt.% oxide analysis with all Fe recorded as FeO using the formula: Fe3+ atoms = 2 × 32 × (1–16/sum T site cations) per 32 O. However, we have already used strict stuffed-tridymite stoichiometric considerations to define the various proportions of the chosen nepheline end-members; indeed, the estimation of the amount of an excess (or deficiency) of Na, reflecting the presence of a cancrinite molecule (or analytical error), negates this possibility. Nevertheless, we consider below how it might be possible to assess whether a significant Fe2+ component could be indicated based on the variation of the ΔAlcc and ΔTch stoichiometry parameters.
Spreadsheet 3 has key data for assessing the Fe valences in model and analysed nephelines and kalsilites. Model compounds include KsFe end-members K8Fe3+8Si8O32 (composition A, Table 4) and K8Fe2+4Si12O32 (B, Table 4) and the three solid solutions K8Fe3+3.85Fe2+2.08Si10.08O32 (50:50 wt.% end-members; C, Table 4), K8Fe3+5.88Fe2+1.06Si9.06O32 (75:25 wt.% end-members; D, Table 4) and the hypothetical composition K8Al6.94Fe3+0.69Fe2+0.19Si8.18O32 (85KsAl:10KsFe3+:5KsFe2+ wt.% end-members; E, Table 4). All of these have strict stuffed-tridymite formulae with 8 cavity cations and 16 T-site frameworks with no excess Si and no vacancies and thus have effectively zero values for the delta parameters. The spreadsheet shows three rows for each solid solution: a purple highlighted row for the stoichiometric compositions; a brown highlighted row for total Fe shown as Fe2O3 and a green highlighted row for total Fe as FeO. For each data set with total Fe calculated as wt.% FeO, the total T-site atom sum is >16.000 reflecting that the cation numbers are too high because not enough oxygen was declared in the wt.% compositional data. As expected, the ΔAlcc and ΔTch parameters both have large positive values with a ΔAlcc/ΔTch greater than that for a stoichiometric cell formula; note that the larger the overestimate of an Fe2+ content the more positive both delta values will be (see Table 1 with equations for calculating ΔAlcc and ΔTch).
Table 4. Valence characterisation for Fe model compounds and three high-Fe nepheline-group minerals.

& Based on total Fe as FeO in wt.% analysis.
$ Estimated model Fe3+ and Fe2+ atoms per 32 oxygens and 16.000 ΣT cations (i) Fe3+= 2 × 32 × (1–16/sumT) and (ii) (Fe2+ = total Fe per 32O × 16/ΣT) (Droop, Reference Droop1987).
£ Fe valence from ΔAlcc; Equivalent wt.% Fe oxides: Fe2O3 = (model Fe3+ × ΣO/32) × (159.69/2) × (ΣT/16); FeO = (model Fe2+ × ΣO/32) × 71.85 × (ΣT/16).
The size of the delta parameters reflects the amount of non-stoichiometry that has been introduced in calculating all the Fe as either ferric or ferrous; in addition, the relative displacement from ΔAlcc/ΔTch = 0 provides information for estimating the actual values for the two oxidation states. We have shown above that entry of a T2+ framework cation has twice the effect on causing a framework-cation / cavity-cation valence mismatch compared to that for entry of a T3+ framework component; thus, an overestimate of Fe2+, compared with Fe3+, seriously increases the ΔAlcc parameter. For example, the 50:50 solid solution (sample C) discussed above has a ‘reduced-Fe’ delta (denoted ΔAlFe2+) parameter of +4.1; the positive parameter implies that 4.1 too few atoms of Fe3+ have been declared. By comparison, an ‘oxidised-Fe’ ΔAlFe3+ has a value of –2.0 and this negative sign is consistent with 2.0 atoms too many atoms of Fe3+ having been declared. These two delta values define the extremes of the non-stoichiometries for a mixing model with a total range of non-stoichiometry of 4.1 + 2.0 = 6.1; this value is equivalent to the average number of Fe atoms shown by the oxidised- and reduced-Fe data sets (6.02). If we treat these data in terms of a lever-rule, the balance would be at the strict stoichiometry, lever-rule-pivot position of ΔAlcc = 0.000 with a value for Fe3+ close to 4.1 atoms/32 O and a value for Fe2+ ≈ 2.0 atoms/32 O. Using the Droop (Reference Droop1987) calculation based on 32 O and 16 T atoms for the reduced Fe data for composition C would give an Fe3+ = 3.846 and a corrected Fe2+ = 2.076. These two sets of values are similar however the former are only approximations because they are based on end-member estimates; both are calculated to 32 oxygens cells but with different numbers of T-site atoms (i.e. 17.023 for the Fe2+ cell and 15.495 for Fe3+; see Table 4). Data for model composition E (Table 4), which has Fe contents more likely to be found for natural nepheline/kalsilite samples, give delta-based values of Fe3+ = 0.698, Fe2+ = 0.186, total Fe = 0.884 atoms/32 O compared with actual values of 0.690, 0.186 and 0.876, respectively (see Table 4). Note that the estimates for Fe3+ and Fe2+ contents can be converted to equivalent wt.% Fe2O3 and FeO values by reversing the atomic formulae calculations as defined in the footnote to Table 4. Using these values together with analytical data for the other components in Spreadsheet 1 will then give the correct atomic values and molecular end-member compositions incorporating the deduced ‘model’ Fe valence data.
For reliably analysed natural nepheline/kalsilite minerals where care was taken not to lose Na during microprobe analyses, where Mg and Mn were analysed for, and where reasonably high total Fe contents are present with a significant amount of each Fe oxidation state, the delta parameters should show similar relationships to those described here for the stoichiometric model compositions and it might be possible to predict the amounts of the different oxidation states. Thus, we have tested this approach to provide approximate values for the amounts of Fe2+ that might be present for two Fe-rich nepheline samples considered by Henderson (Reference Henderson2020) and for a published Fe- and Mg-rich kalsilite sample (Tappe et al., Reference Tappe, Foley and Pearson2003). The data provided in Spreadsheet 3 and Table 4 show that all three analyses show positive ΔAlcc and ΔTch values when using total iron as Fe2+ in the calculation and negative values when total Fe3+ is used; these relationships are consistent with Fe being present in both oxidation states and the relative values for the ΔAlcc parameters for the all-Fe2+ and all-Fe3+ datasets can be used to estimate the relative proportions of the two valency states for each sample. Table 4 (bottom two rows) gives the estimated values for Fe3+ and Fe2+ (atoms per 32 O) and the equivalent wt.% values for these three samples. Thus, we suggest that the nepheline analyses of Dawson (Reference Dawson, Smith and Steele1995) and Dawson and Hill (Reference Dawson and Hill1998) are consistent with 15–20% of the total Fe being present as FeO whereas the Tappe et al. (Reference Tappe, Foley and Pearson2003) kalsilite might have ~10% of the total Fe as FeO.
This approach is particularly relevant for Mg- and Fe-rich potassic nephelines and kalsilites and we will consider this matter further in Paper 2 (Oliveira and Henderson, Reference Oliveira and Henderson2022, this volume).
Acknowledgements
We thank Jack Zussman for his encouragement at an early stage of this nepheline stoichiometry ‘journey’, the constructive comments of an anonymous referee, also Roger Mitchell for his patient and detailed suggestions, and overall for the editorial input. I.L.O. also thanks the Brazilian National Council for Scientific and Technological Development (CNPq) for the doctorate scholarship (GM/GD146955/2016-1).
Supplementary material
To view supplementary material for this article, please visit https://doi.org/10.1180/mgm.2022.24


