Introduction
Sphalerite (ZnS) is a common mineral in sulfide deposits, and the bulk of Zn and critical elements such as Ge, Ga, In, etc. are extracted from sphalerite ore (Höll et al., Reference Höll, Kling and Schroll2007; Cook et al., Reference Cook, Ciobanu, Pring, Skinner, Shimizu, Danyushevsky, Saini-Eidukat and Melcher2009, Reference Cook, Sundblad, Valkama, Nygård, Ciobanu and Danyushevsky2011; Frenzel et al., Reference Frenzel, Mikolajczak, Reute and Gutzmer2017 and reference therein). The mineral occurs in diverse textures such as euhedral crystals, concentric zoning and colloform textures (McLimans et al., Reference McLimans, Barnes and Ohmoto1980; Pattrick et al., Reference Pattrick, Dorling and Polya1993; Barrie et al., Reference Barrie, Boyce, Boyle, Williams, Blake, Wilkinson, Lowther, McDermott and Prior2009). These textures, common in various types of Ag–Pb–Zn and Au–Ag veins and in Mississippi Valley-type (MVT) deposits (Barton et al., Reference Barton, Bethke and Roedder1977; Di Benedetto et al., Reference Di Benedetto, Bernardini, Costagliola, Plant and Vaughan2005; Barrie et al., Reference Barrie, Boyce, Boyle, Williams, Blake, Wilkinson, Lowther, McDermott and Prior2009; Belissont et al., Reference Belissont, Boiron, Luais and Cathelineau2014), record physicochemical conditions during mineral formation (Pattrick et al., Reference Pattrick, Dorling and Polya1993), and illustrate the sequential evolution of hydrothermal fluids (e.g. Kelley et al., Reference Kelley, Leach, Johnson, Clark, Fayek, Slack, Anderson, Ayuso and Ridley2004).
Zoning textures in sphalerite have been described in most studies of the metallogeny of Zn–Pb deposits but very few investigations have examined the causes of the zoning. There are a few notable exceptions (Roedder, Reference Roedder1968; McLimans et al., Reference McLimans, Barnes and Ohmoto1980; Pattrick et al., Reference Pattrick, Dorling and Polya1993; Di Benedetto et al., Reference Di Benedetto, Bernardini, Costagliola, Plant and Vaughan2005; Pfaff et al., Reference Pfaff, Koenig, Wenzel, Ridley, Hildebrandt, Leach and Markl2011 and Gagnevin et al., Reference Gagnevin, Menuge, Kronz, Barrie and Boyce2012). The pioneering work of Roedder and Dwornik (Reference Roedder and Dwornik1968) showed the total Fe content varies between bands but does not display any correlation with the colour of the band. In contrast, McLimans et al. (Reference McLimans, Barnes and Ohmoto1980) considered that the colour of the bands is related to the FeS content due to a strong relationship between colour and iron content. Pattrick et al. (Reference Pattrick, Dorling and Polya1993) proposed that repetitive bands are associated with cyclic changes in solution pH. Recently, Gagnevin et al. (Reference Gagnevin, Menuge, Kronz, Barrie and Boyce2012) proposed that layered sphalerite in Irish-type deposits forms by mixing two compositionally and isotopically contrasting hydrothermal fluids. Older publications have mostly relied on electron microprobe (EMP), scanning electron microscopy (SEM) and/or wet chemistry. However, the utility of EMP is restricted because of the relatively high detection limits (mostly >100 ppm). Although wet chemistry can provide quantitative results for trace elements and isotopes, the micro-scale chemical and isotopic resolution is limited. This has resulted in limited documentation and understanding of the growth mechanism of zoned sphalerite—limiting its utility in reconstructing the evolution of hydrothermal fluids. Recent advances of in situ microanalytical techniques such as laser ablation inductively coupled plasma mass spectrometry (LA-ICP-MS) and secondary ion mass spectrometer (SIMS) can provide, not only the quantitative results for trace elements present at very low concentrations (~0.01 ppm; Cook et al., Reference Cook, Ciobanu, Pring, Skinner, Shimizu, Danyushevsky, Saini-Eidukat and Melcher2009), but also offers an attractive option for qualitative mapping of low concentrations of trace elements at high spatial resolution (Large et al., Reference Large, Danyushevsky, Hollit, Maslennikov, Meffre, Gilbert, Bull, Scott, Embsbo, Thomas, Singh and Foster2009). Furthermore, LA-Multi-Collector-ICP-MS (LA-MC-ICP-MS), with a spot size as small as 20 μm, provides an opportunity to study sulfur isotope composition of individual growth bands of minerals (Pfaff et al., Reference Pfaff, Koenig, Wenzel, Ridley, Hildebrandt, Leach and Markl2011).
In this investigation, we present detailed observations of growth zones in sphalerite from vein-hosted sphalerite from the Nayongzhi MVT Zn–Pb deposit, South China. In situ LA-ICP-MS trace-element spot analyses, element-distribution maps and LA-MC-ICP-MS sulfur isotope analyses were used to: (1) reveal the relationship between colour and trace elements in sphalerite; (2) constrain the sulfur isotope variation on a crystal scale; and (3) determine the possible control factors on the formation of zoned sphalerite. Finally, a possible growth process to explain the observed zoned sphalerite is proposed.
Geology of the Nayongzhi MVT deposit
The Nayongzhi MVT deposit is located at the eastern border of the Sichuan–Yunnan–Guizhou metallogenic province, on the southwestern edge of the Yangtze Platform (Fig. 1a,b). The deposit lies in the NE-trending Wuzhishan anticline and is limited by two parallel NNE-trending regional faults, the Jichangpo and the Xiongchang faults (Fig. 1c; Wei et al., Reference Wei, Huang, Yan, Hu and Ye2018a and reference therein). In the Nayongzhi area, the lower Cambrian Qingxudong Formation is divided into three members based on lithological features: (1) argillaceous dolostone and carbonaceous dolostone; (2) laminated dolostone interlayered with zebra dolostone; and (3) fine-grained dolostone and argillaceous dolostone (e.g. Jin et al., Reference Jin, Zhou, Huang, Luo, Gao, Peng, Wang and Chen2016). The orebodies are hosted primarily in the junction between the members 1–2 of the Qingxudong Formation and consist of two principal types, a stacked series of stratabound lenses and steeply dipping veins with the stratabound lenses primarily in the Qingxudong Formation and the steeply dipping veins within the F12 fault (Fig. 1d). The Zn–Pb ore is associated spatially and temporally with the NW-trending F12 thrust fault. High-grade orebodies occur mainly as massive solution-collapse breccias and veins in proximity to the F12 fault, however, low-grade replacement orebodies mainly occur as stratiform and/or lentiform bodies far from the F12 fault, suggesting the F12 fault probably acted as an efficient conduit for an upward flowing hydrothermal fluid (Wei et al., Reference Wei, Ye, Huang, Hu and Wang2020).
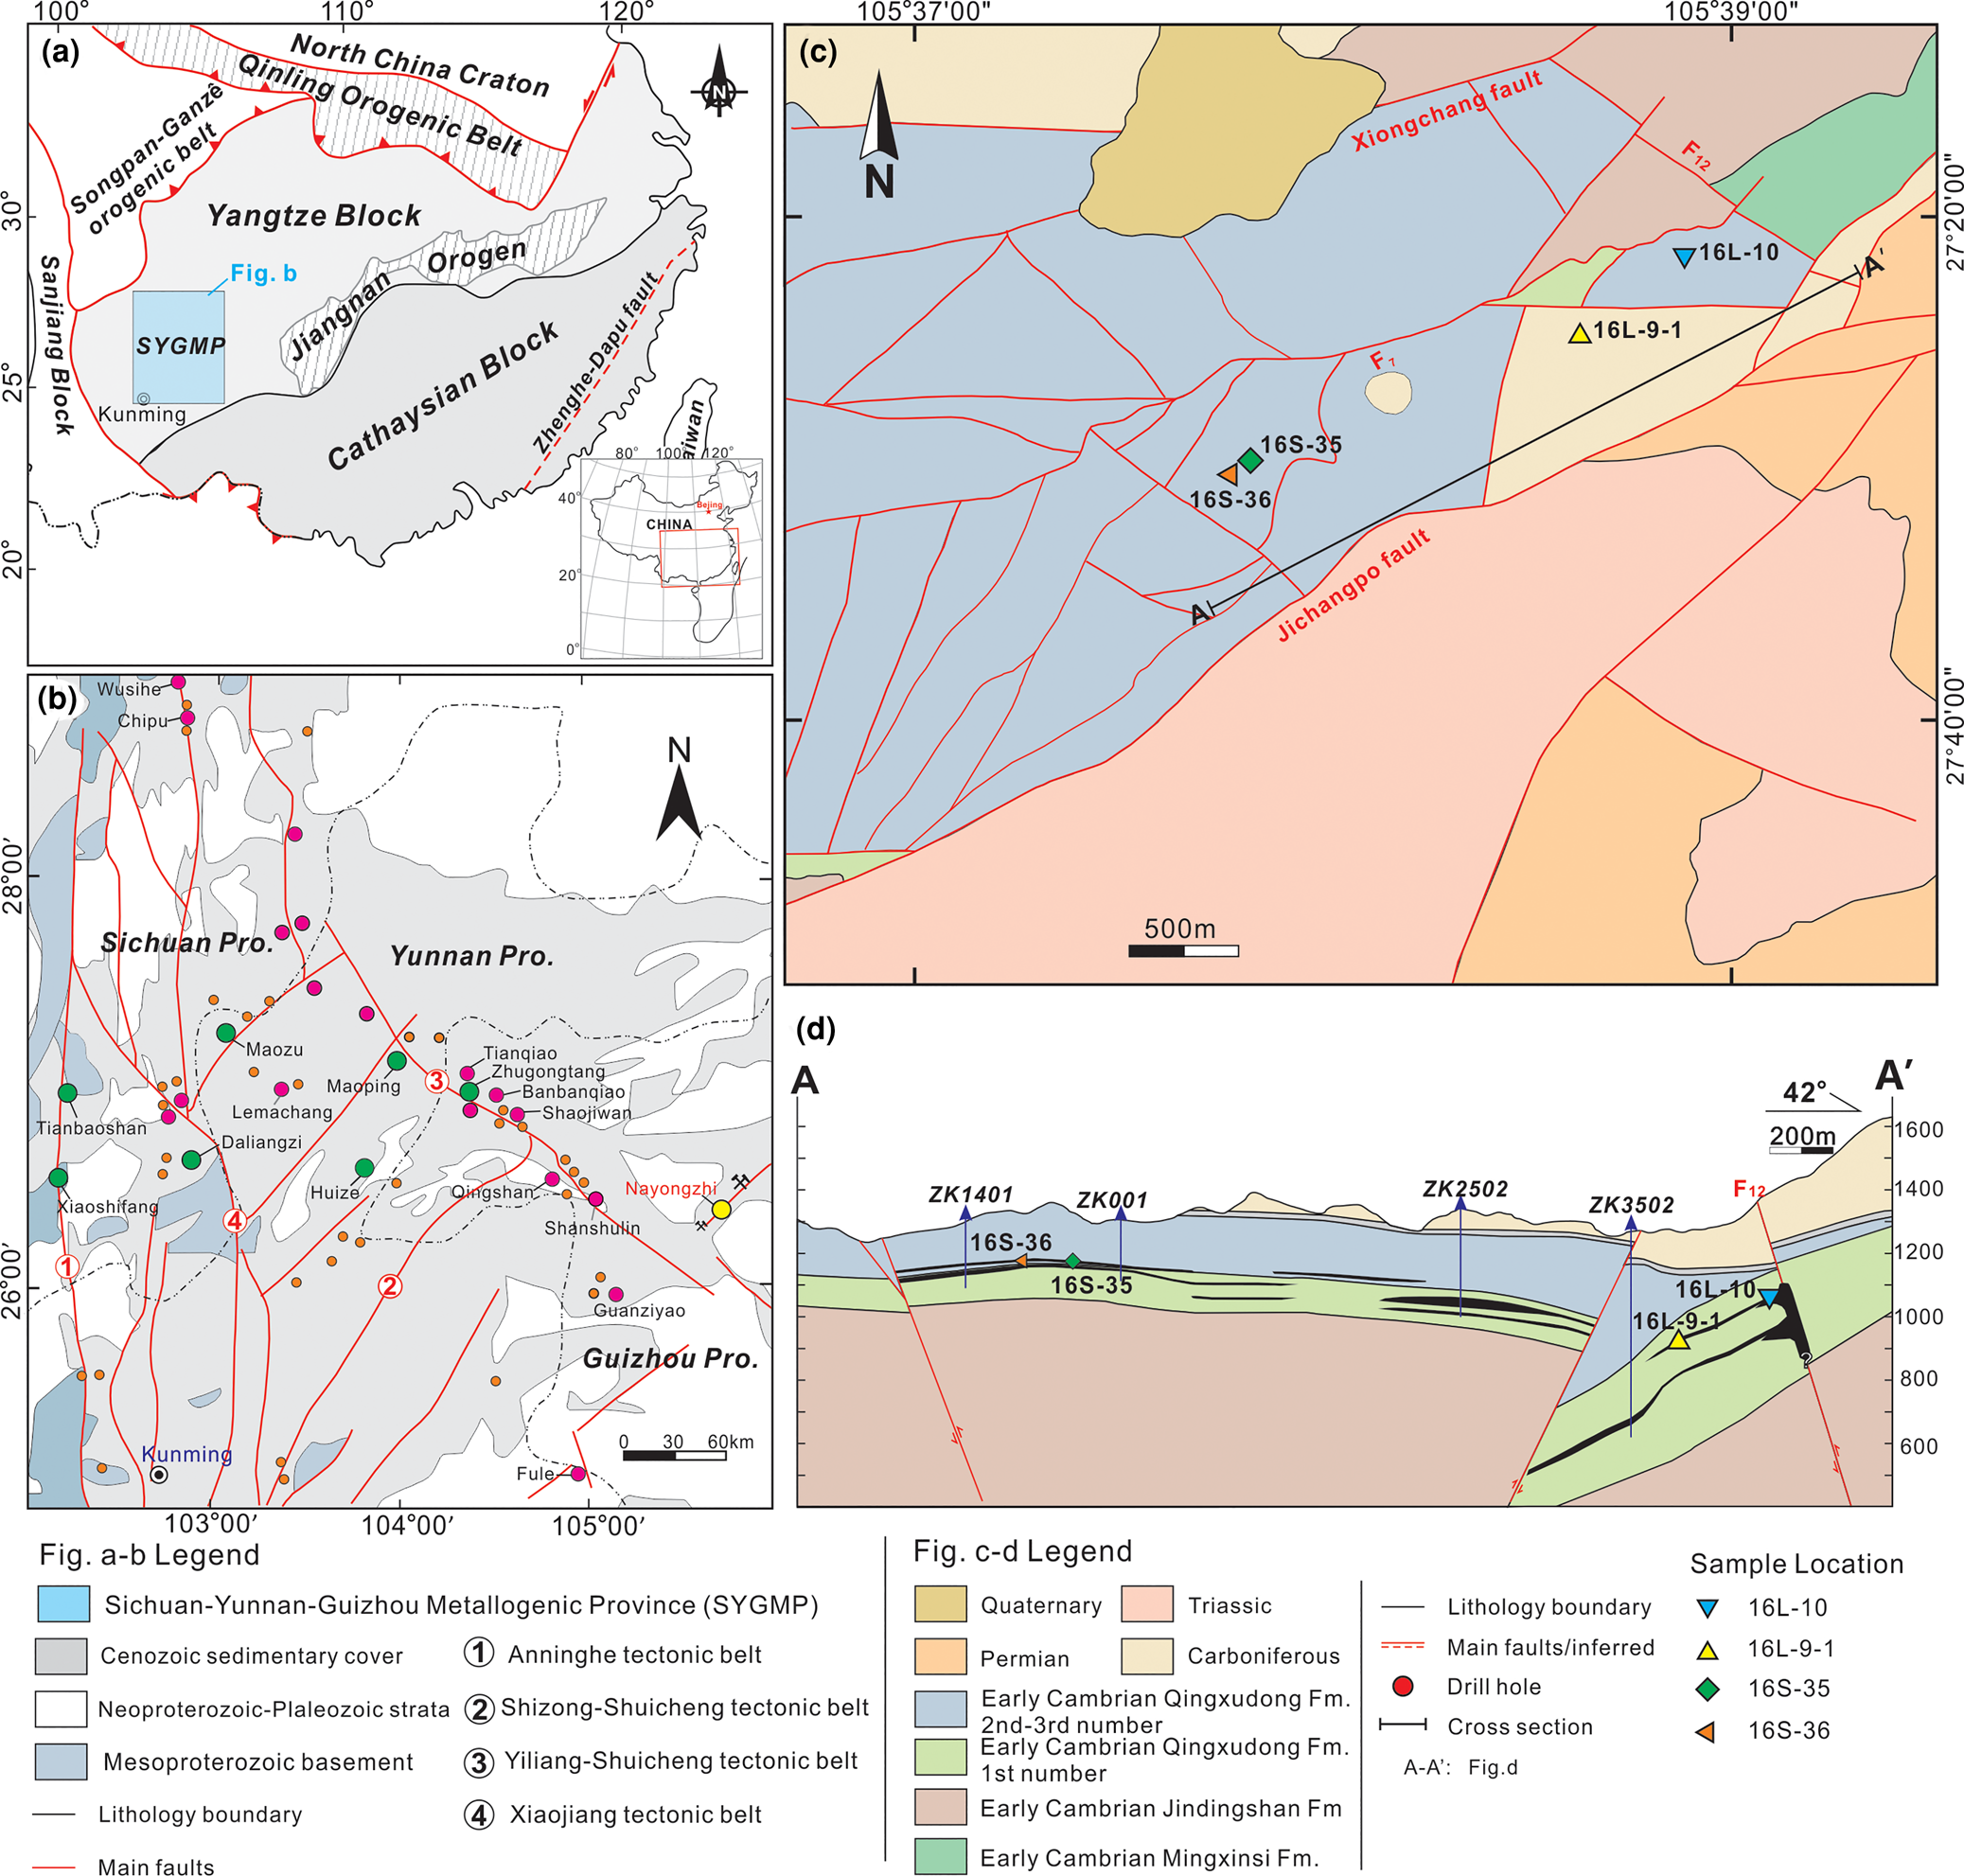
Fig. 1 (a) The location of the Sichuan–Yunnan–Guizhou metallogenic province (SYGMP) in South China (modified from Wei et al., Reference Wei, Huang, Yan, Hu and Ye2018a); (b) location of the Nayongzhi deposit in the SYGMP (modified from CIGMR, 2003); (c) simplified geological map of the Nayongzhi deposit; (d) representative cross-section showing the occurrence and morphology of the sulfide orebodies at Nayongzhi. The location of the section is indicated in (c).
The economic minerals in the Nayongzhi MVT deposit consist of sphalerite and galena with minor pyrite, accompanied by hydrothermal dolomite and calcite as the main gangue minerals. The main ore stage consists of coarsely crystallised sphalerite and galena, accompanied by fine-grained pyrite with co-existing hydrothermal dolomite (Wei et al., Reference Wei, Huang, Yan, Hu and Ye2018a; Zhou et al., Reference Zhou, Wang, Wilde, Luo, Huang, Wu and Jin2018). Coarsely crystallised sphalerite is essentially restricted to cavity and fracture fillings of the host rock (Wei, Reference Wei2018), which is a common texture of the main ore stage.
Sampling and analytical methods
Sampling
Four representative sphalerite ore samples (16L-10, 16L-9-1, 16S-35 and 16S-36) were collected from different sulfide veins (0.2–1 m wide) in the underground tunnels of level 1270 m and 1290 m, respectively. Specifically, samples (16L-10 and 16L-9-1) were collected from the proximity of the F12 fault, whereas samples 16S-35 and 16S-36 were collected from ~2.2 km away from the F12 fault. Detailed sampling locations are shown in Fig. 1c–d.
LA-ICP-MS multi-element analysis and element mapping
Spot analysis using LA-ICP-MS and element-distribution maps were acquired at the State Key Laboratory of Ore Deposit Geochemistry, Institute of Geochemistry Chinese Academy of Sciences (IGCAS), using a high-performance RESOlution 193nm ArF excimer Laser Ablation System coupled to an Agilent 7700x ICP-MS instrument. The ablated aerosol transported using a constant He (350 ml/min) flow and mixed with Ar (900 ml/min) in a cyclone coaxial mixer before entering the ICP-MS. Spot ablation was carried out using a 26 μm spot size at ~3 J/cm2 with a 5 Hz pulse frequency. Each analysis incorporated a background acquisition of ~30 s (gas blank) followed by 60 s of data acquisition from the sample. The following isotopes were monitored: 23Na, 27Al, 29Si, 34S, 49Ti, 51V, 55Mn, 57Fe, 59Co, 60Ni, 65Cu, 66Zn, 72Ge, 75As, 85Rb, 88Sr, 107Ag, 111Cd, 115In, 118Sn, 121Sb, 205Tl and 208Pb. Internal calibration used 66Zn, with the measured 64.6 wt.% data from EMP analyses (Wei et al., Reference Wei, Huang, Yan, Hu and Ye2018a). External reference materials STDGL2b3 (Danyushevsky et al., Reference Danyushevsky, Robinson, Gilbert, Norman, Large, McGoldrick and Shelley2011), GSD-1G and GSE-1G were used for instrument drift correction and trace-element quantification. These were run before analyses of the unknown samples and after every 1.5 h to record instrumental drift. Data reduction calculations and error propagations were performed using LADR software designed at the analytical laboratories of the Centre of Excellence in Ore Deposits (CODES), University of Tasmania, following the standard methods of Longerich et al. (Reference Longerich, Jackson and Gunther1996). The complete trace-element dataset for each element in each sample are given in the Supplementary material (see below).
Element maps were obtained by ablating sets of parallel lines across the sphalerite using a consistent laser spot size (9 μm) and 10 μm/s scan speed at a laser repetition of 10 Hz and 0.002 s dwell time for all measured elements. Identical rasters were done on the reference material of STDGL2b3, GSE-1G and GSD-1G at the start and end of a mapping run to calculate element concentrations in sphalerite and to correct for instrumental drift. Element maps were compiled and processed using the program Iolite (Paton et al., Reference Paton, Hellstrom, Paul, Woodhead and Hergt2011) and an add-in for the data analysis program Igor developed by WaveMetrics. All LA-ICP-MS maps were produced for each element using a logarithmic colour scale.
LA-MC-ICP-MS sulfur analysis
In order to study the sulfur isotopes with respect to colour-zoned sphalerite, polished thin sections used for LA-ICP-MS trace element spot analysis were repolished and used for in situ sulfur isotope analysis. In situ sulfur isotopes were measured using a Nu-Plasma 1700 multicollector ICP-MS (Nu Instruments, United Kingdom) at the State Key Laboratory of Continental Dynamics (SKLCD), Northwest University, China. Sphalerite samples were ablated at a spot size of 30 μm, using a fluence of 3.6 J/cm2 at 3 Hz. The total S signal obtained for sphalerite was typically 8 to 12 V. Under these conditions, after a 30 s baseline, 50 s of ablation is needed to obtain an internal precision of 34S/32S ≤ ±0.000002 (1σ). More details of the method can be found in Chen et al. (Reference Chen, Chen, Bao, Liang, Sun and Yuan2017). Two in-house standards were used for external standard bracketing (NWU-Py-4) and quality control (PTST-2) of analyses (Chen et al., Reference Chen, Chen, Bao, Liang, Sun and Yuan2017). The δ34SCDT (‰) of PTST-2 yielded in this investigation were 32.4±0.4‰ (2σ, n = 35), which agree well with that of the reported value of 32.5±0.3‰ (2σ) measured by gas source-mass spectrometry or solution-introduced MC-ICP-MS (Chen et al., Reference Chen, Chen, Bao, Liang, Sun and Yuan2017).
Focused ion beam and transmission electron microscopy study
Two thin foils for transmission electron microscopy (TEM) investigation were prepared using a Dual-Beam focused ion beam (FIB) system (FEI Helios Nanlab 350S) at the Center for Lunar and Planetary Sciences, IGCAS. For this investigation, foils with a size of 15 μm × 15 μm × 0.1 μm at chosen locations within sphalerite were sputtered with Ga ions accelerated to 30 keV. Each foil was placed on a copper grid and thinned. TEM characterisation was performed using an FEI Tecnai G2 F20 S-TWIN TEM system at the State Key Laboratory of Environmental Geochemistry, IGCAS. The TEM is equipped with an energy-dispersive X-ray spectrometer (EDAX) and high angle annular dark field (HAADF) detector in STEM mode.
Results
Petrography
Optical microscope observations of the analysed sphalerite samples show obvious core–rim (CR) zonation (Fig. 2). Minor inclusions of galena and pyrite can be observed in sphalerite from sample 16L-10 (Fig. 2c). The thickness of discrete zones varies between 80 μm and 500 μm (Fig. 2). Colour variations in CR zoned sphalerite are dramatic, with brown zones contrasting with pale-yellow and/or light zones, with a cross-section width of no more than 100 μm (Fig. 2). Sphalerite grain size varies significantly within the samples and individual sphalerite crystals can have up to five discrete colour zones. Cursory observations suggest two typical optical colour zoning patterns in sphalerite crystals: (1) CR texture (Fig. 2a,b) and (2) core–mantle–rim (CMR) texture (Fig. 2c,d). Specifically, CR texture, generally coarse grained (~1 mm), occurs as a brown core (200–400 μm) and light rim with highly variable width (Fig. 2a,b) and were observed in samples 16S-35 and 16S-36 (the distal part of the F12 fault; Fig. 1c,d). Whereas the CMR texture includes a brown core (300–500 μm) and alternate parallel pale-yellow and light growth bands that vary in thickness from 60 μm to 150 μm; this appears flattened (Fig. 2c,d) and is common in samples 16L-10 and 16L-9-1, collected from proximal to the F12 fault (Fig. 1c,d). Notably, many fluid inclusions were observed in all three colour zones within these sphalerite (Fig. 2e).
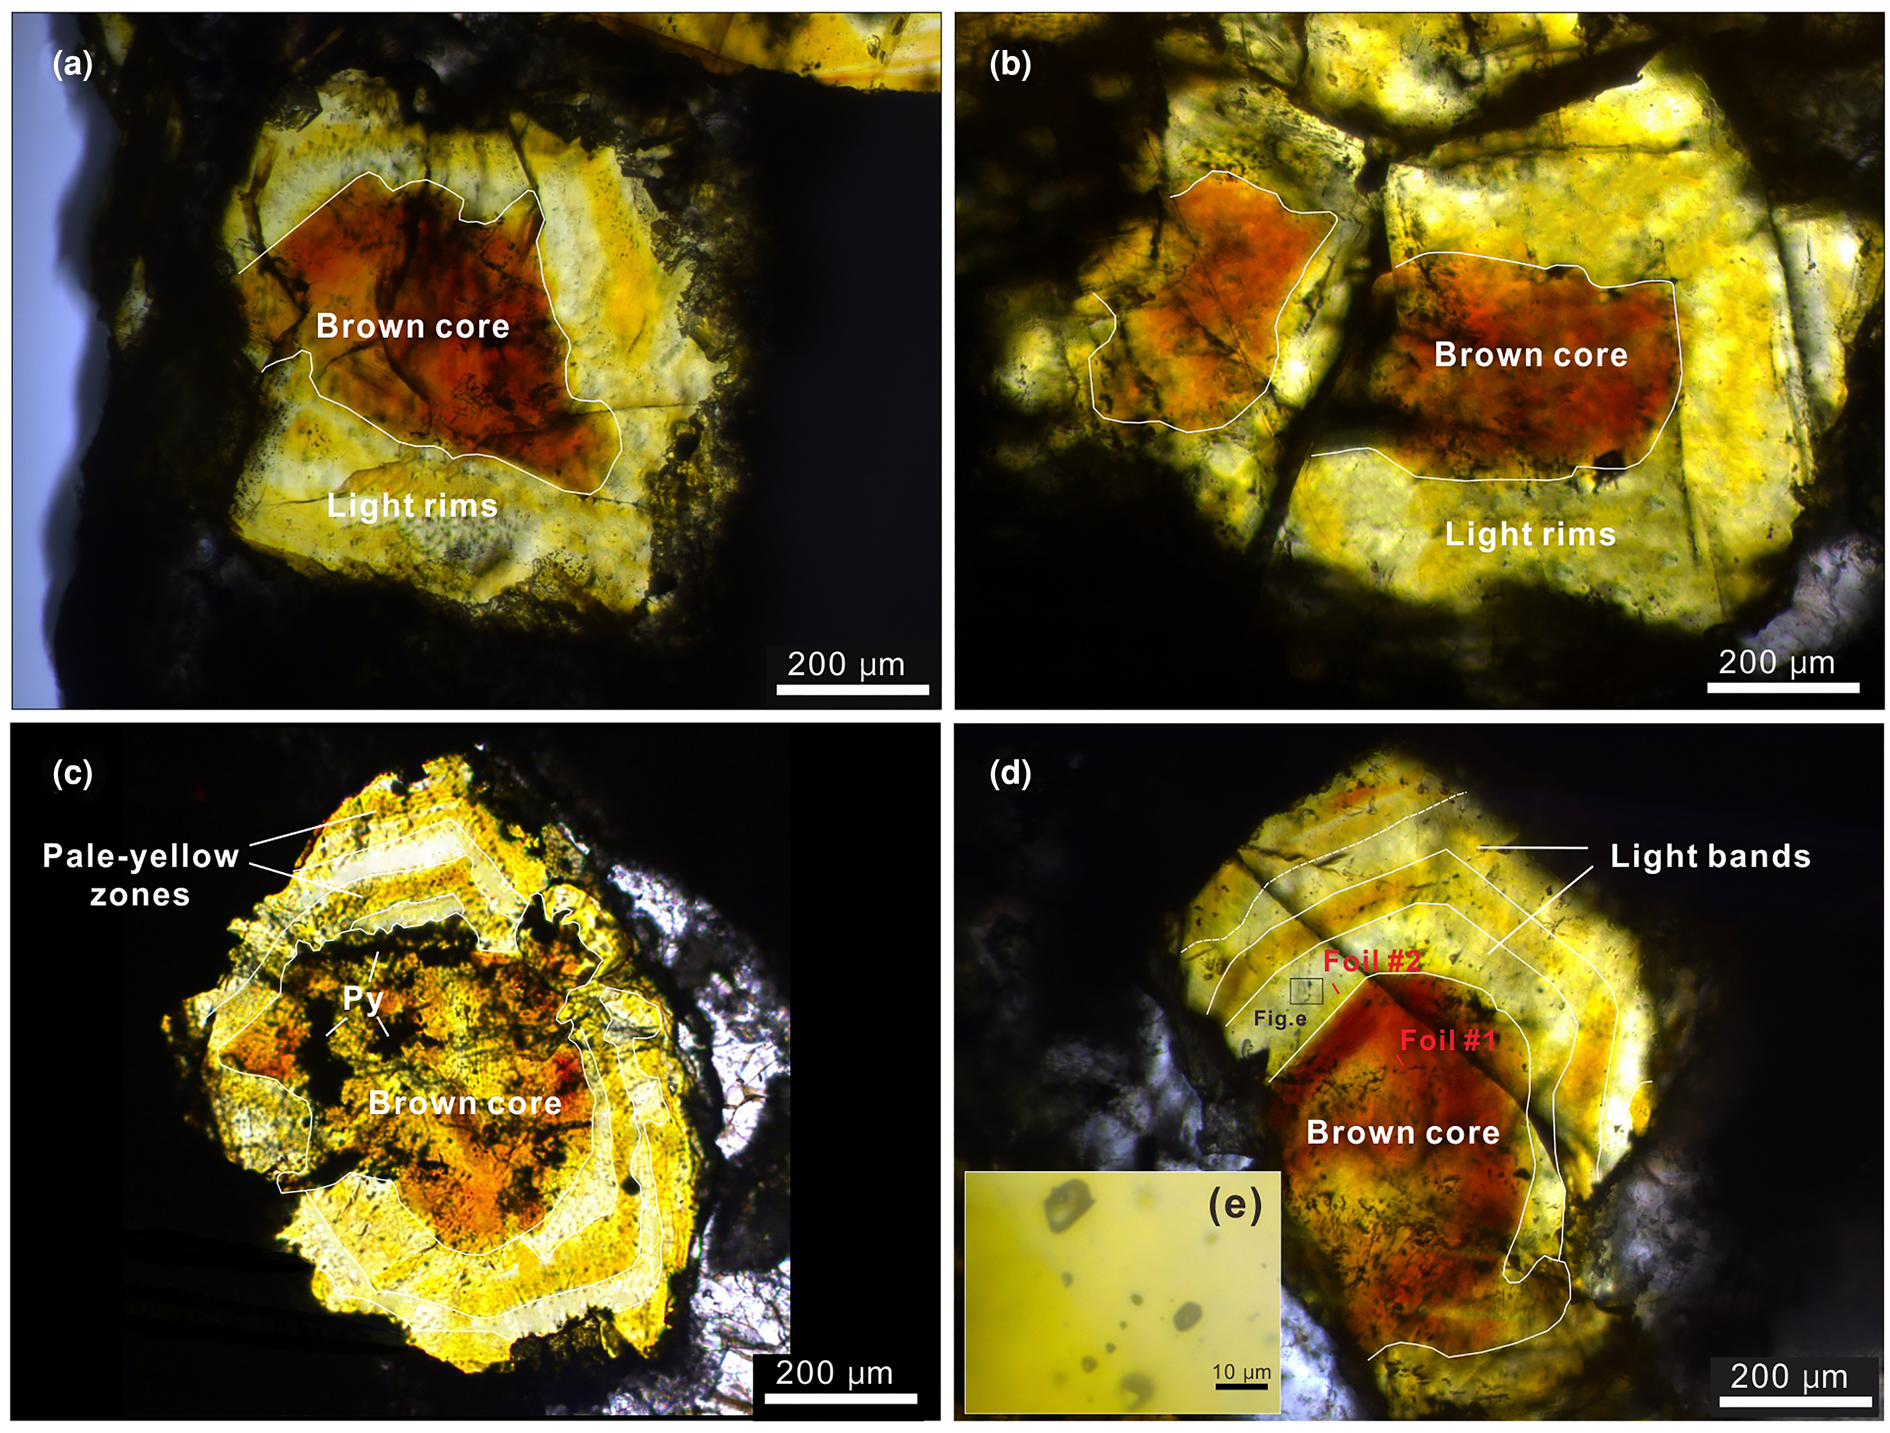
Fig. 2. Transmitted light microphotographs of the zoned sphalerite from Nayongzhi showing the main zoning patterns: (a) Sample 16S-35; (b) sample 16S-36; (c) sample 16L-9-1; (d) sample 16L-10; and (e) magnified insert showing inclusions.
Trace-element compositions
All analytical data for minor and trace elements in sphalerite determined by LA-ICP-MS are presented as Supplementary material and summarised in Table 1. LA-ICP-MS ablation profiles were generally smooth, suggesting homogeneous distribution of elements in the spot analysed (Fig. 3). No discrete nanoparticles were detected by TEM in any of the analysed foils suggesting homogeneous incorporation of trace elements into the sphalerite lattice (Fig. 4 a,b). A fluid inclusion, 80 nm diameter, in the brown sphalerite zone (foil #2) was observed by TEM (Fig. 4c). Line scans with EDAX indicate an area of 50–70 nm in width with increasing Ge, Co, Fe, Cl, Si and Pb concentrations and simultaneously decreasing Zn and S values (Fig. 4d).
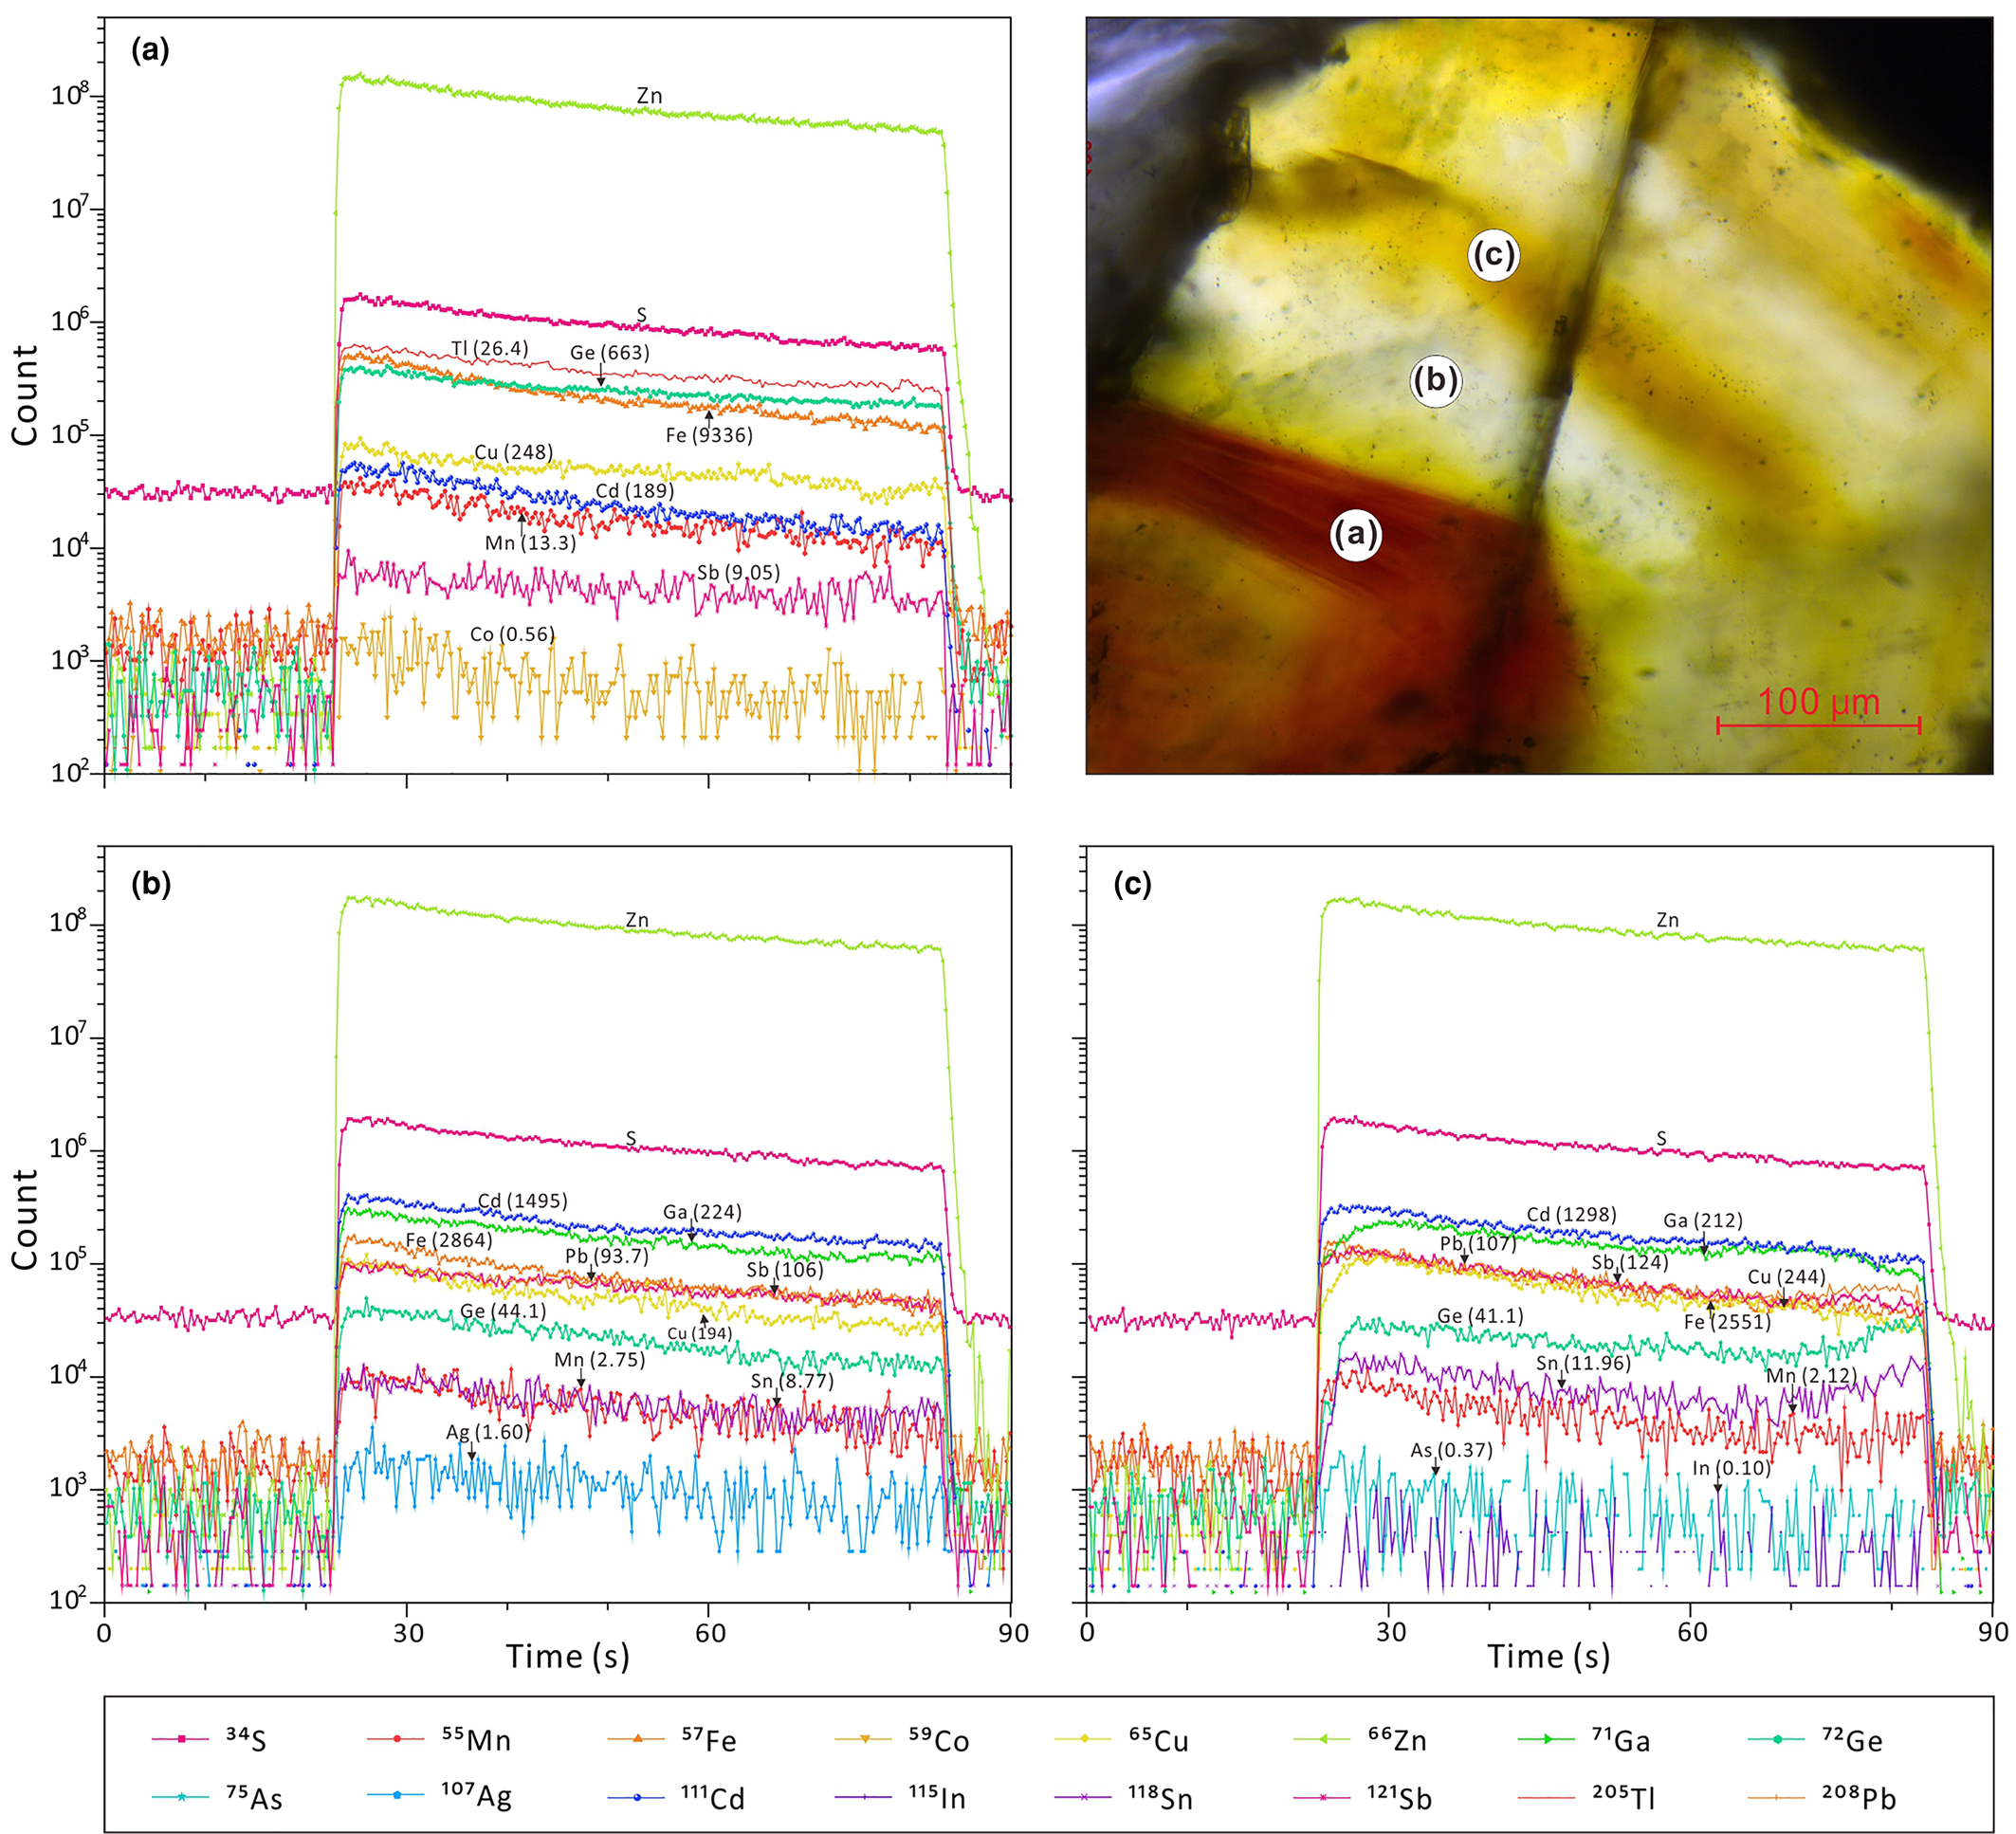
Fig. 3. Typical time-resolved LA-ICP-MS output graphs for the three zoning types, illustrated on a sphalerite crystal (sample 16L-10). (a) Brown cores; (b) pale-yellow zones; and (c) light bands.
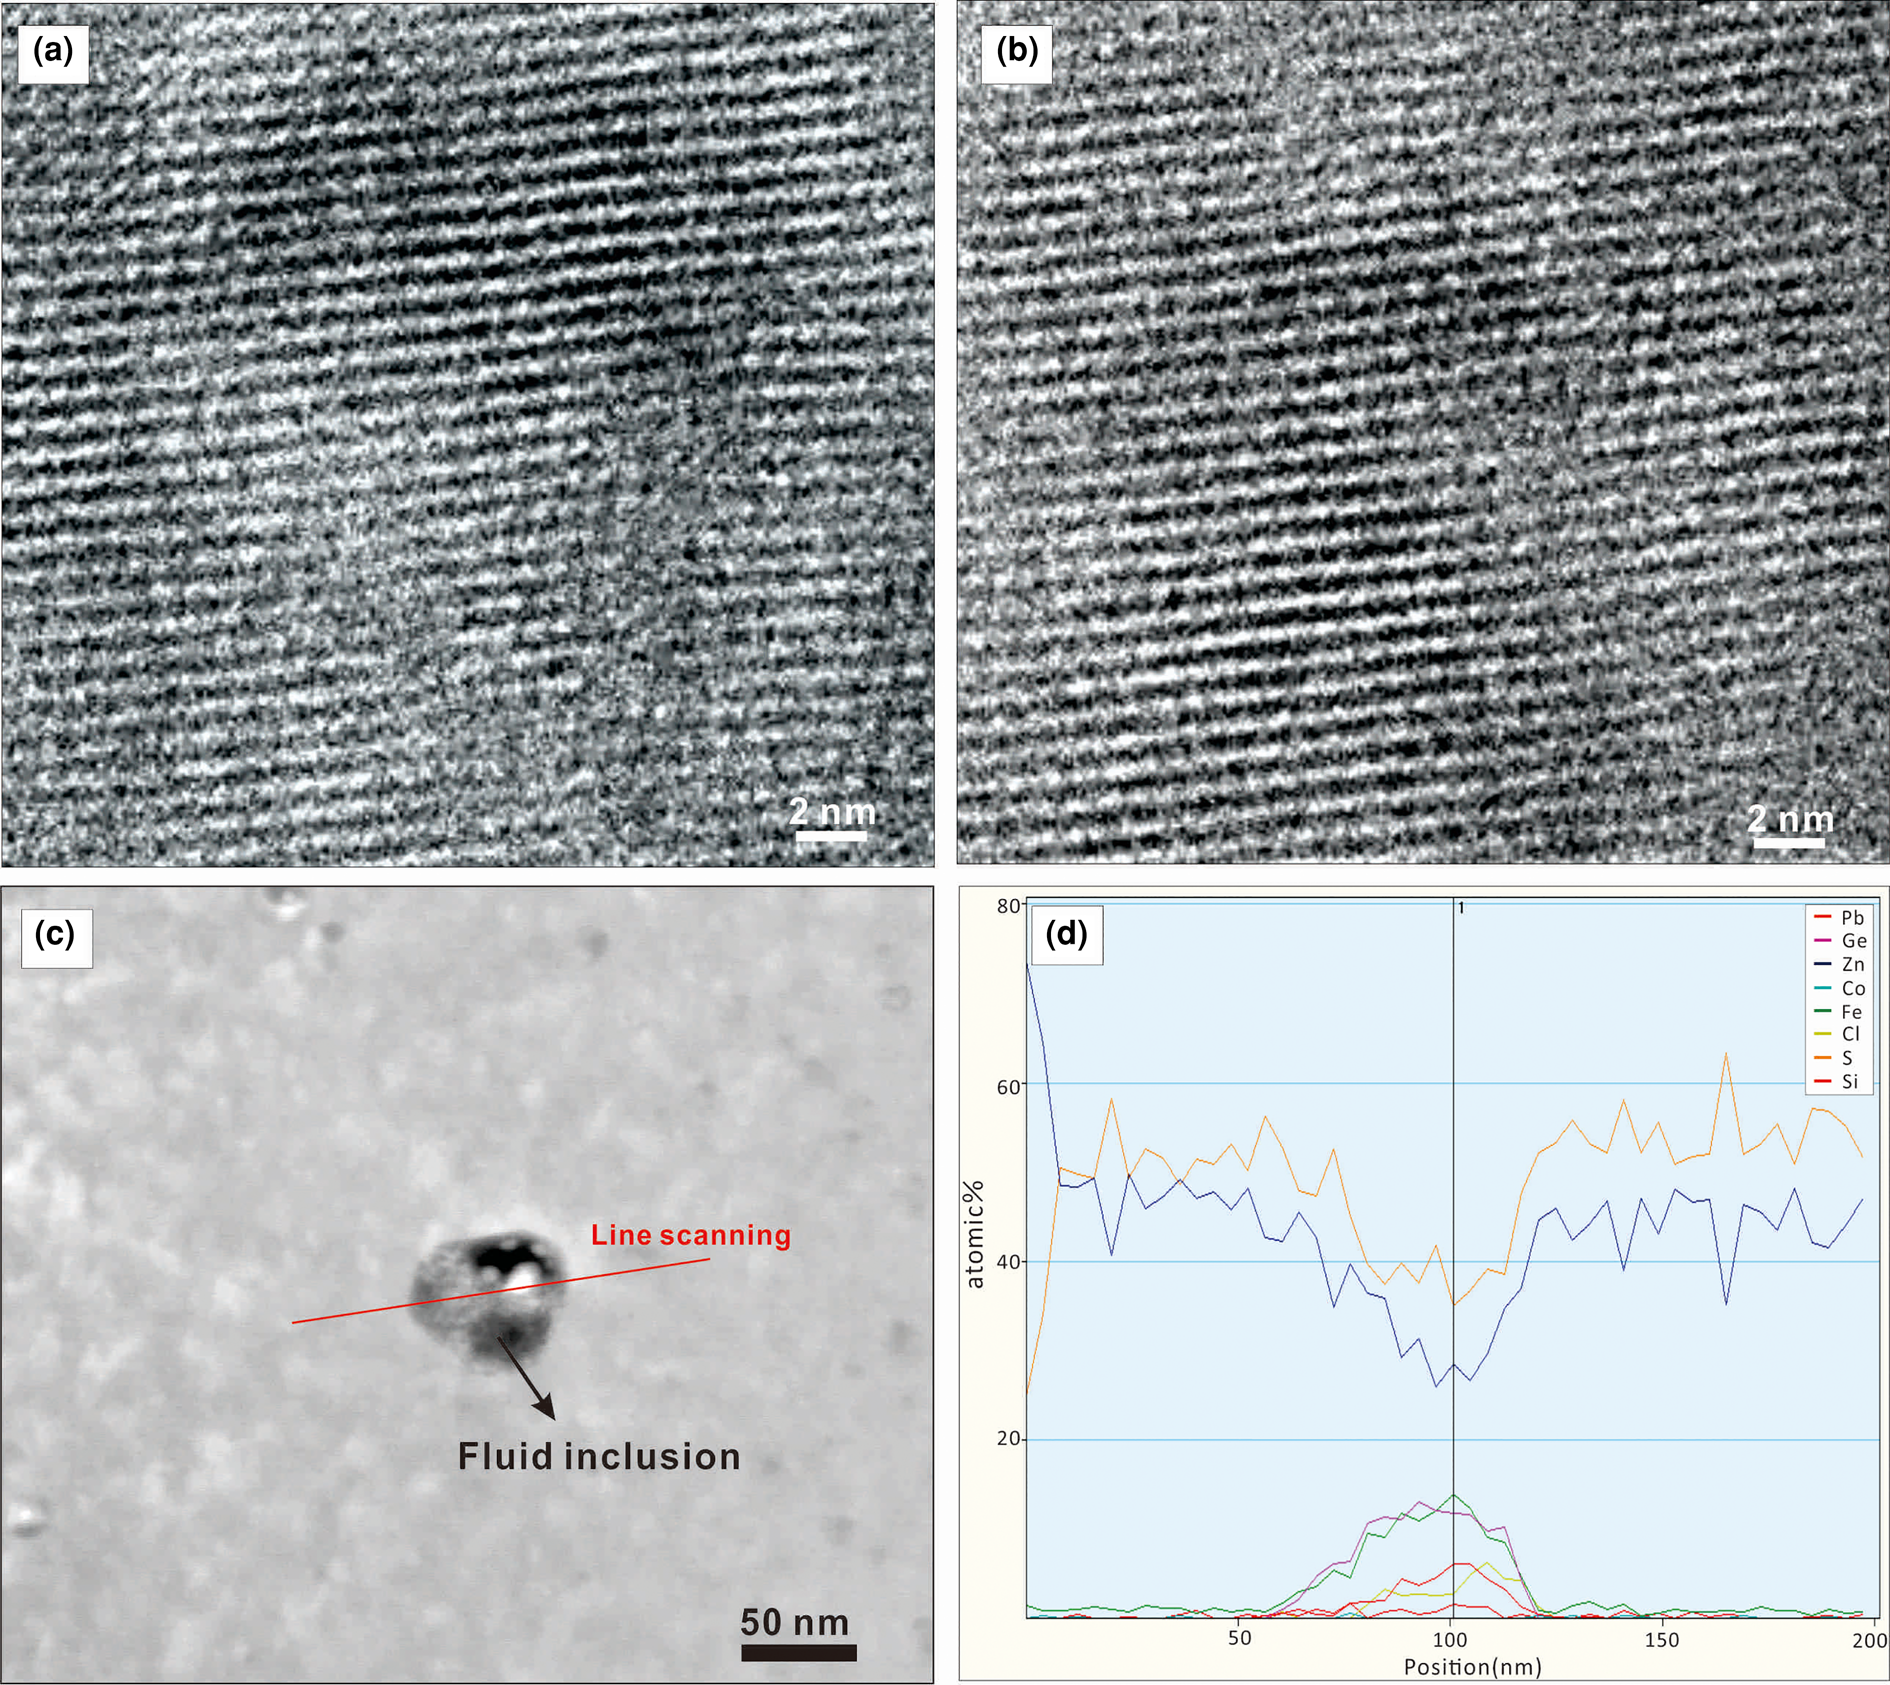
Fig. 4. High-resolution TEM images showing detail of colour zoning in sphalerite: (a) brown core (foil#1); (b) light zone (foil#2); (c) HAADF image showing the fluid inclusions in foil#2 with the red line indicating the position of the EDAX line scan; (d) element concentration distribution along the line scan for Pb, Ge, Zn, Co, Fe, Cl, S and Si.
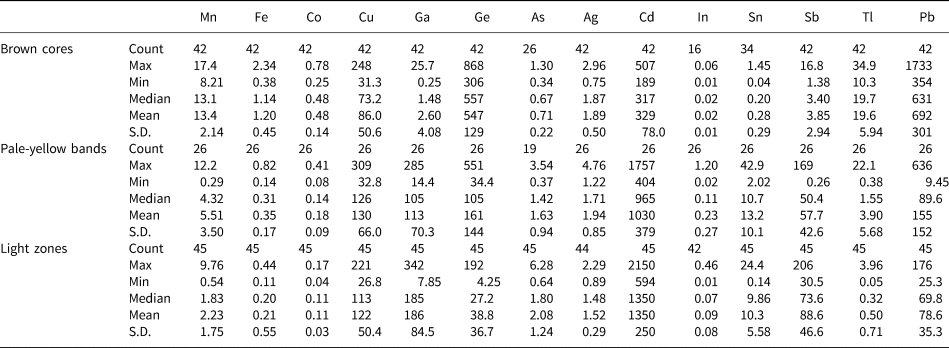
Table 1 LA-ICP-MS data for the three colour zones of sphalerite from the Nayongzhi Zn–Pb deposit.

Note: Fe in wt.% and other elements in ppm
Comparative boxplots of minor and trace elements in the three identified colour zones of sphalerite are shown in Fig. 5, consisting of 42 spot analyses in brown cores, 26 spot analyses in pale-yellow bands and 45 spot analyses in light zones. Median values are used for comparison (Fig. 5).
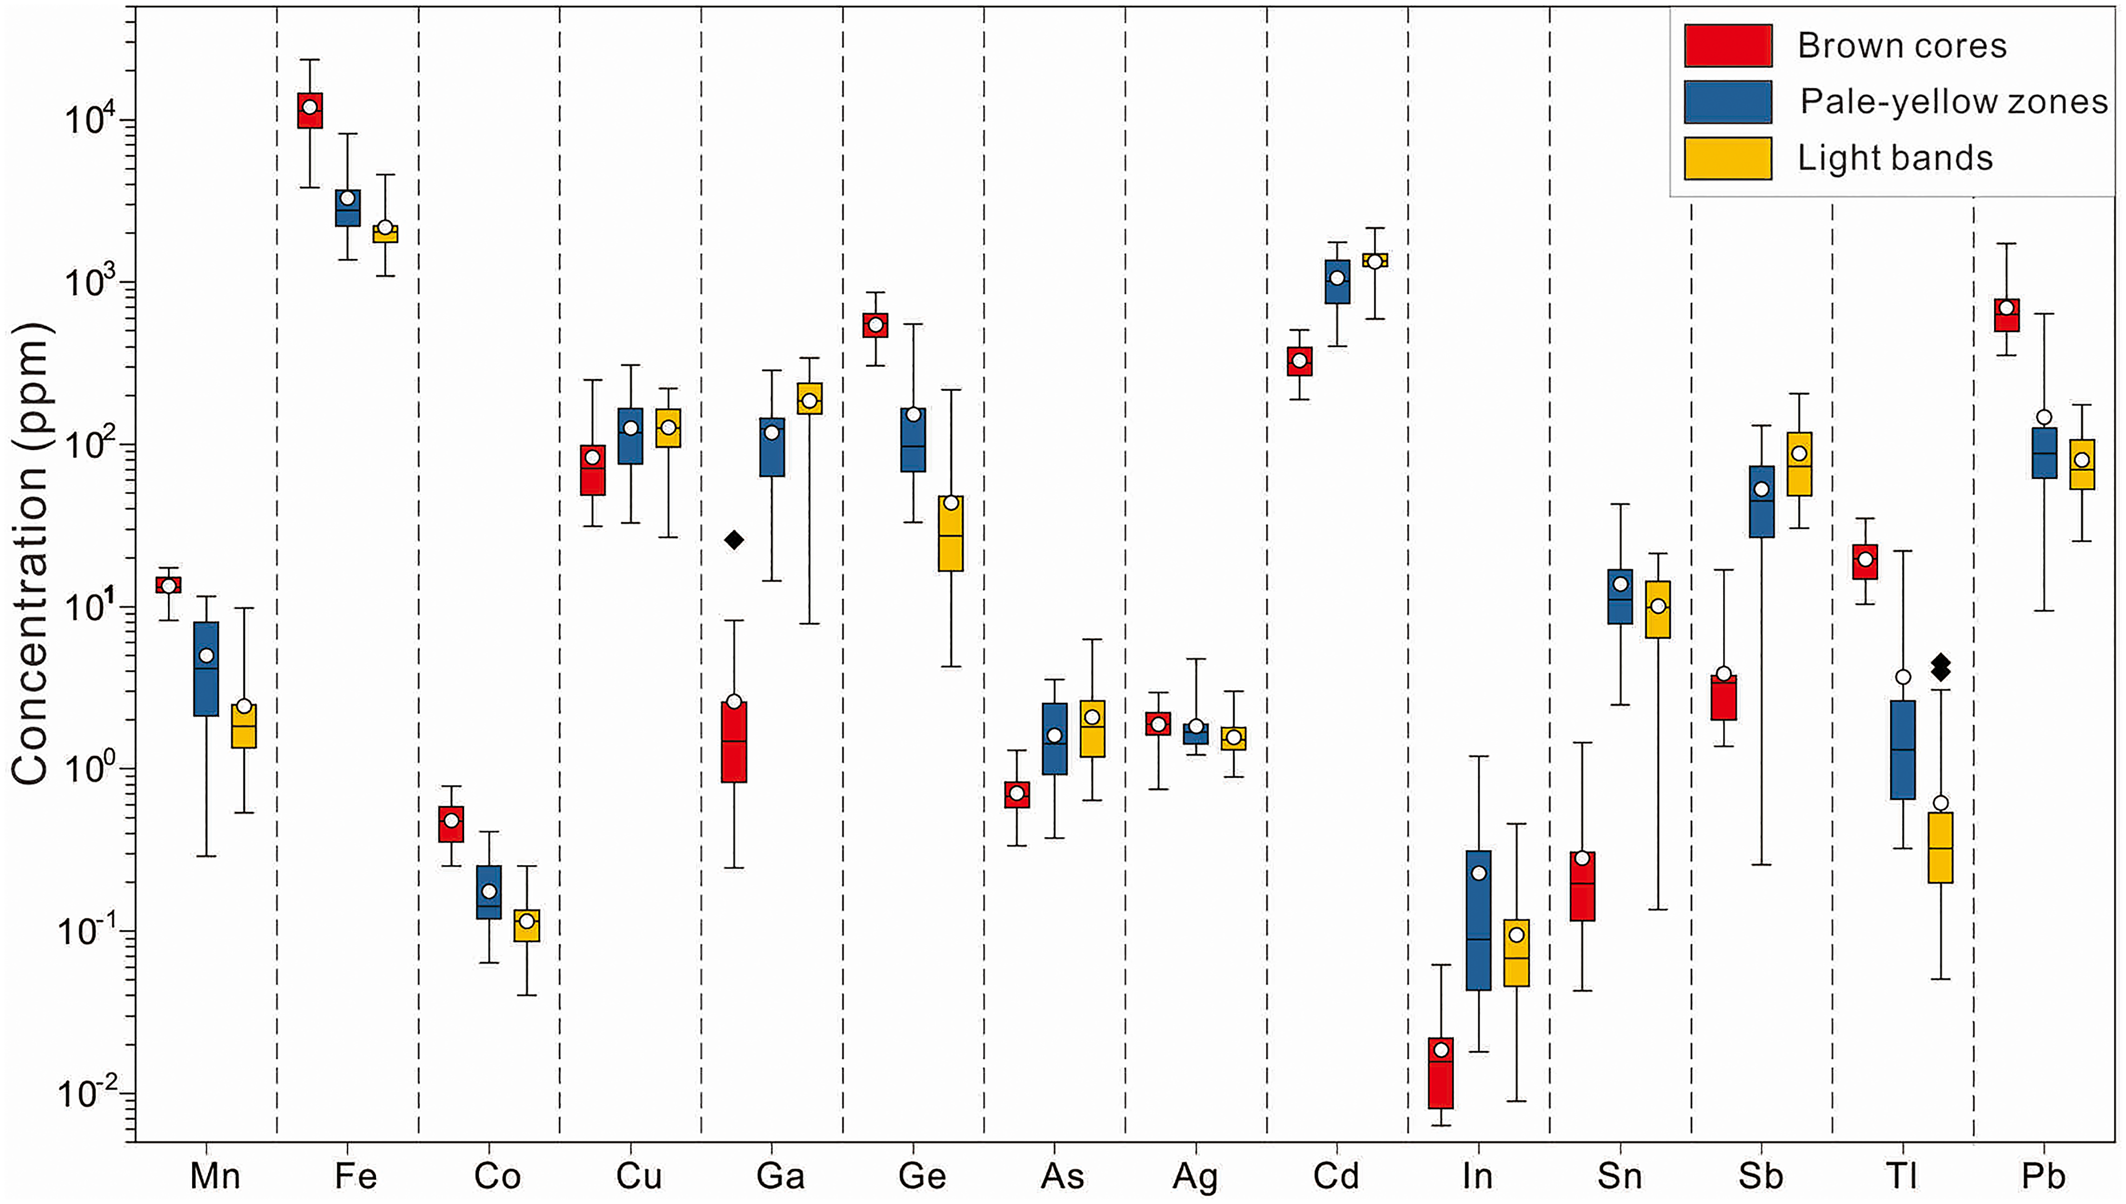
Fig. 5. Boxplots of trace elements in the three identified zoning types within sphalerite from Nayongzhi analysed by LA-ICP-MS. Upper and lower threshold values are 95%. The upper and lower margin of the box represent the upper 75% and 25% of the data. Mean values are shown as solid white circles and median values as solid black lines.
Iron is the most abundant trace element in sphalerite with concentrations ranging between 0.11 and 2.34 wt.%. Highest concentrations can be found in brown cores, with a median value of 1.14 wt.%. Cadmium is the second most abundant trace element in the sphalerite sample analysed. The concentration of Cd varies from 189 to 2149 ppm, and is greatest in light zones, with a median value of 1350 ppm. Lead, Ge, Ga, Cu and Sb display highly variable concentrations. These elements vary from 9.45–1733 ppm (median of 324 ppm), 4.25–868 ppm (median of 256 ppm), 0.25–342 ppm (median of 101 ppm), 26.8–309 ppm (median of 110 ppm) and 0.26–206 ppm (median of 50 ppm), respectively. Gallium, Cu and Sb are mostly concentrated in light zones, ranging from 7.85–342 ppm (median of 186 ppm), 32.8–309 ppm (median of 130 ppm) and 30.5–206 ppm (median of 88.6 ppm), respectively. Lead and Ge, however, are enriched in brown core zones, ranging from 354–1733 ppm (median of 692 ppm) and 306–868 ppm (median of 547 ppm), respectively. In addition, Mn, Tl and Co exhibit a wide range of concentrations (0.29–17.4 ppm, 0.05–34.9 ppm and 0.04–0.78 ppm, respectively) and are more concentrated in brown cores with median values of 13.4 ppm, 19.6 ppm and 0.48 ppm, respectively. Sliver, In and Sn extend from below the limit of detection to 4.63 ppm, 1.20 ppm and 42.9 ppm, respectively and are more enriched in pale-yellow bands. Further, As was detected in several spots, with concentrations ranging from below the limit of detection to 6.28 ppm (median of 1.59 ppm), with higher concentrations in light zones, with a median value of 2.08 ppm.
Trace-element distribution in zoned sphalerite
A typical optical colour CR pattern in single sphalerite crystals (~600 μm across) was chosen for LA-ICP-MS mapping (Fig. 6). Although the distribution of most analysed trace elements is heterogeneous, the element-distribution maps reveal two distinct compositional zoning patterns. Iron, Ge, Tl, Mn, Co, Pb and Ag are mainly concentrated in brown cores and depleted in ~200 μm wide light rims (Fig. 6). In contrast, light zones are preferentially enriched in Cd, Ga, Sb, In and Sn, relative to brown cores (Fig. 6).
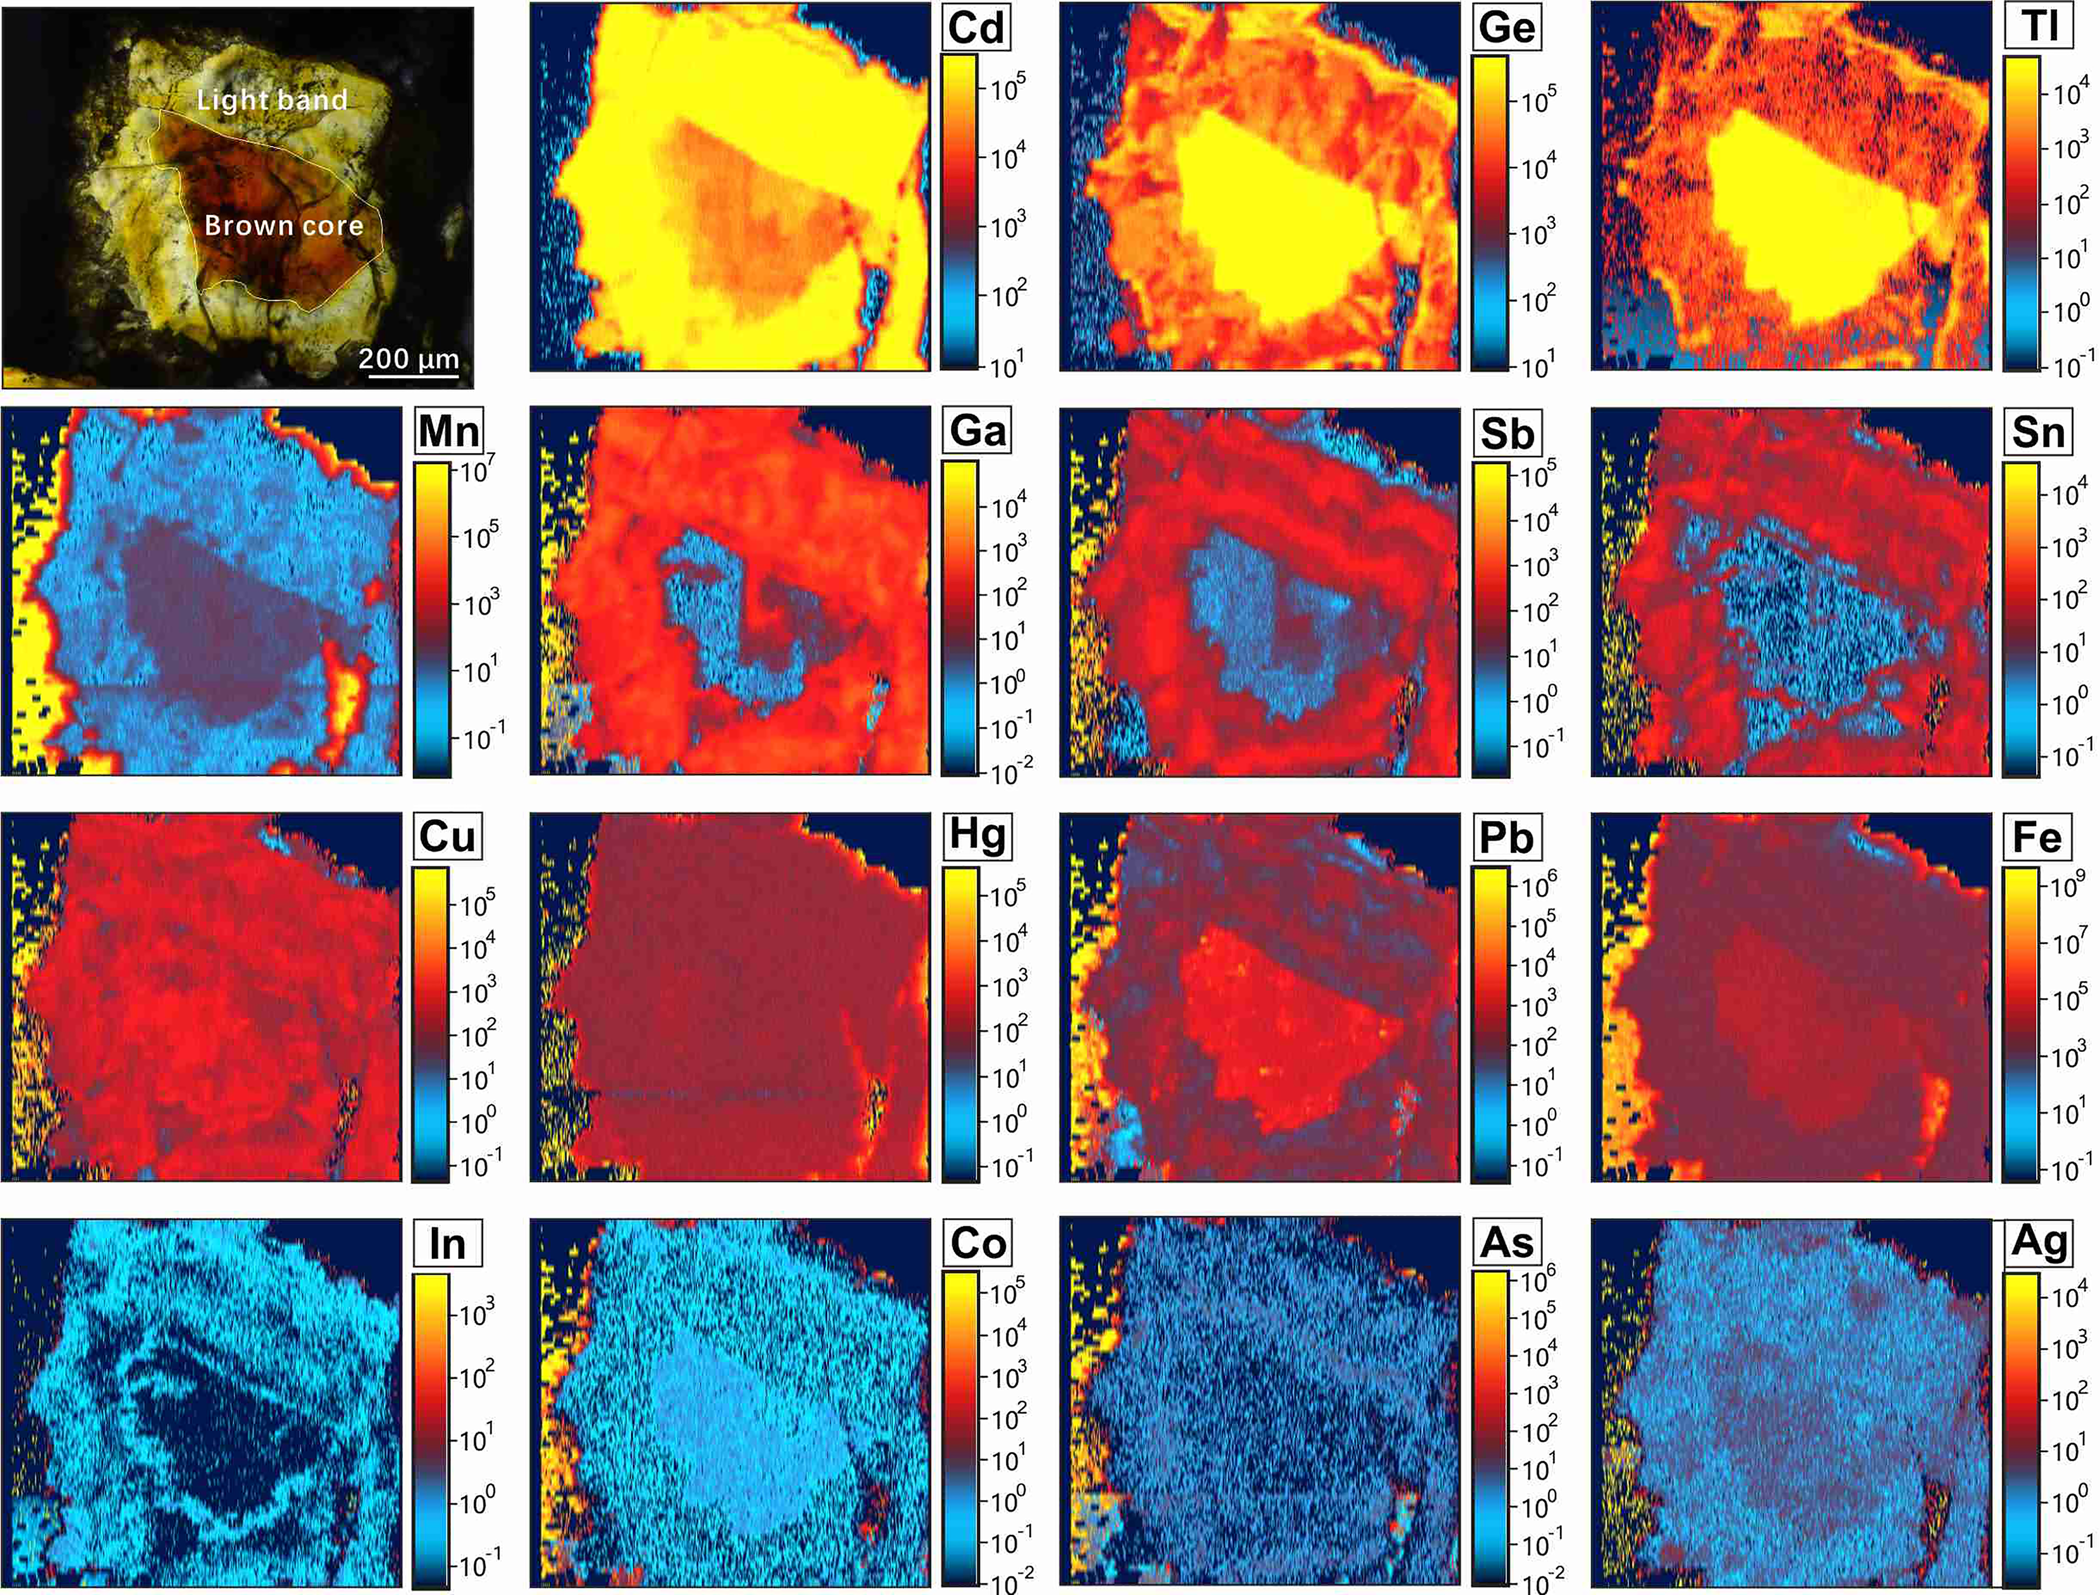
Fig. 6. Elemental maps generated with LA-ICP-MS showing the distribution of selected trace elements in the CR pattern of sphalerite from sample 16S-35.
The CMR pattern in sphalerite samples was not analysed by LA-ICP-MS elemental mapping due to the high abundance of fluid inclusions. Two linear traverses across the CMR texture of sphalerite from sample 16L-9-1 were acquired (Fig. 7). The traverses reveal that brown cores exhibit distinctly higher Mn, Fe, Co, Ge, Tl and Pb concentrations than pale-yellow and light zones (Fig. 7). However, pale-yellow and light zones have elevated Ga, Cd, Sn, In and Sb concentrations relative to brown cores (Fig. 7). These partition trends are comparable to what can be seen in the LA-ICP-MS elemental maps of CR patterns (Fig. 6). The concentration of trace elements such as Cu, Sb, In and Sn shows slight variation between pale-yellow and light zones (Fig. 7). Light zones have higher In and Sn but lower Cu and Sb abundances relative to the pale-yellow zones.
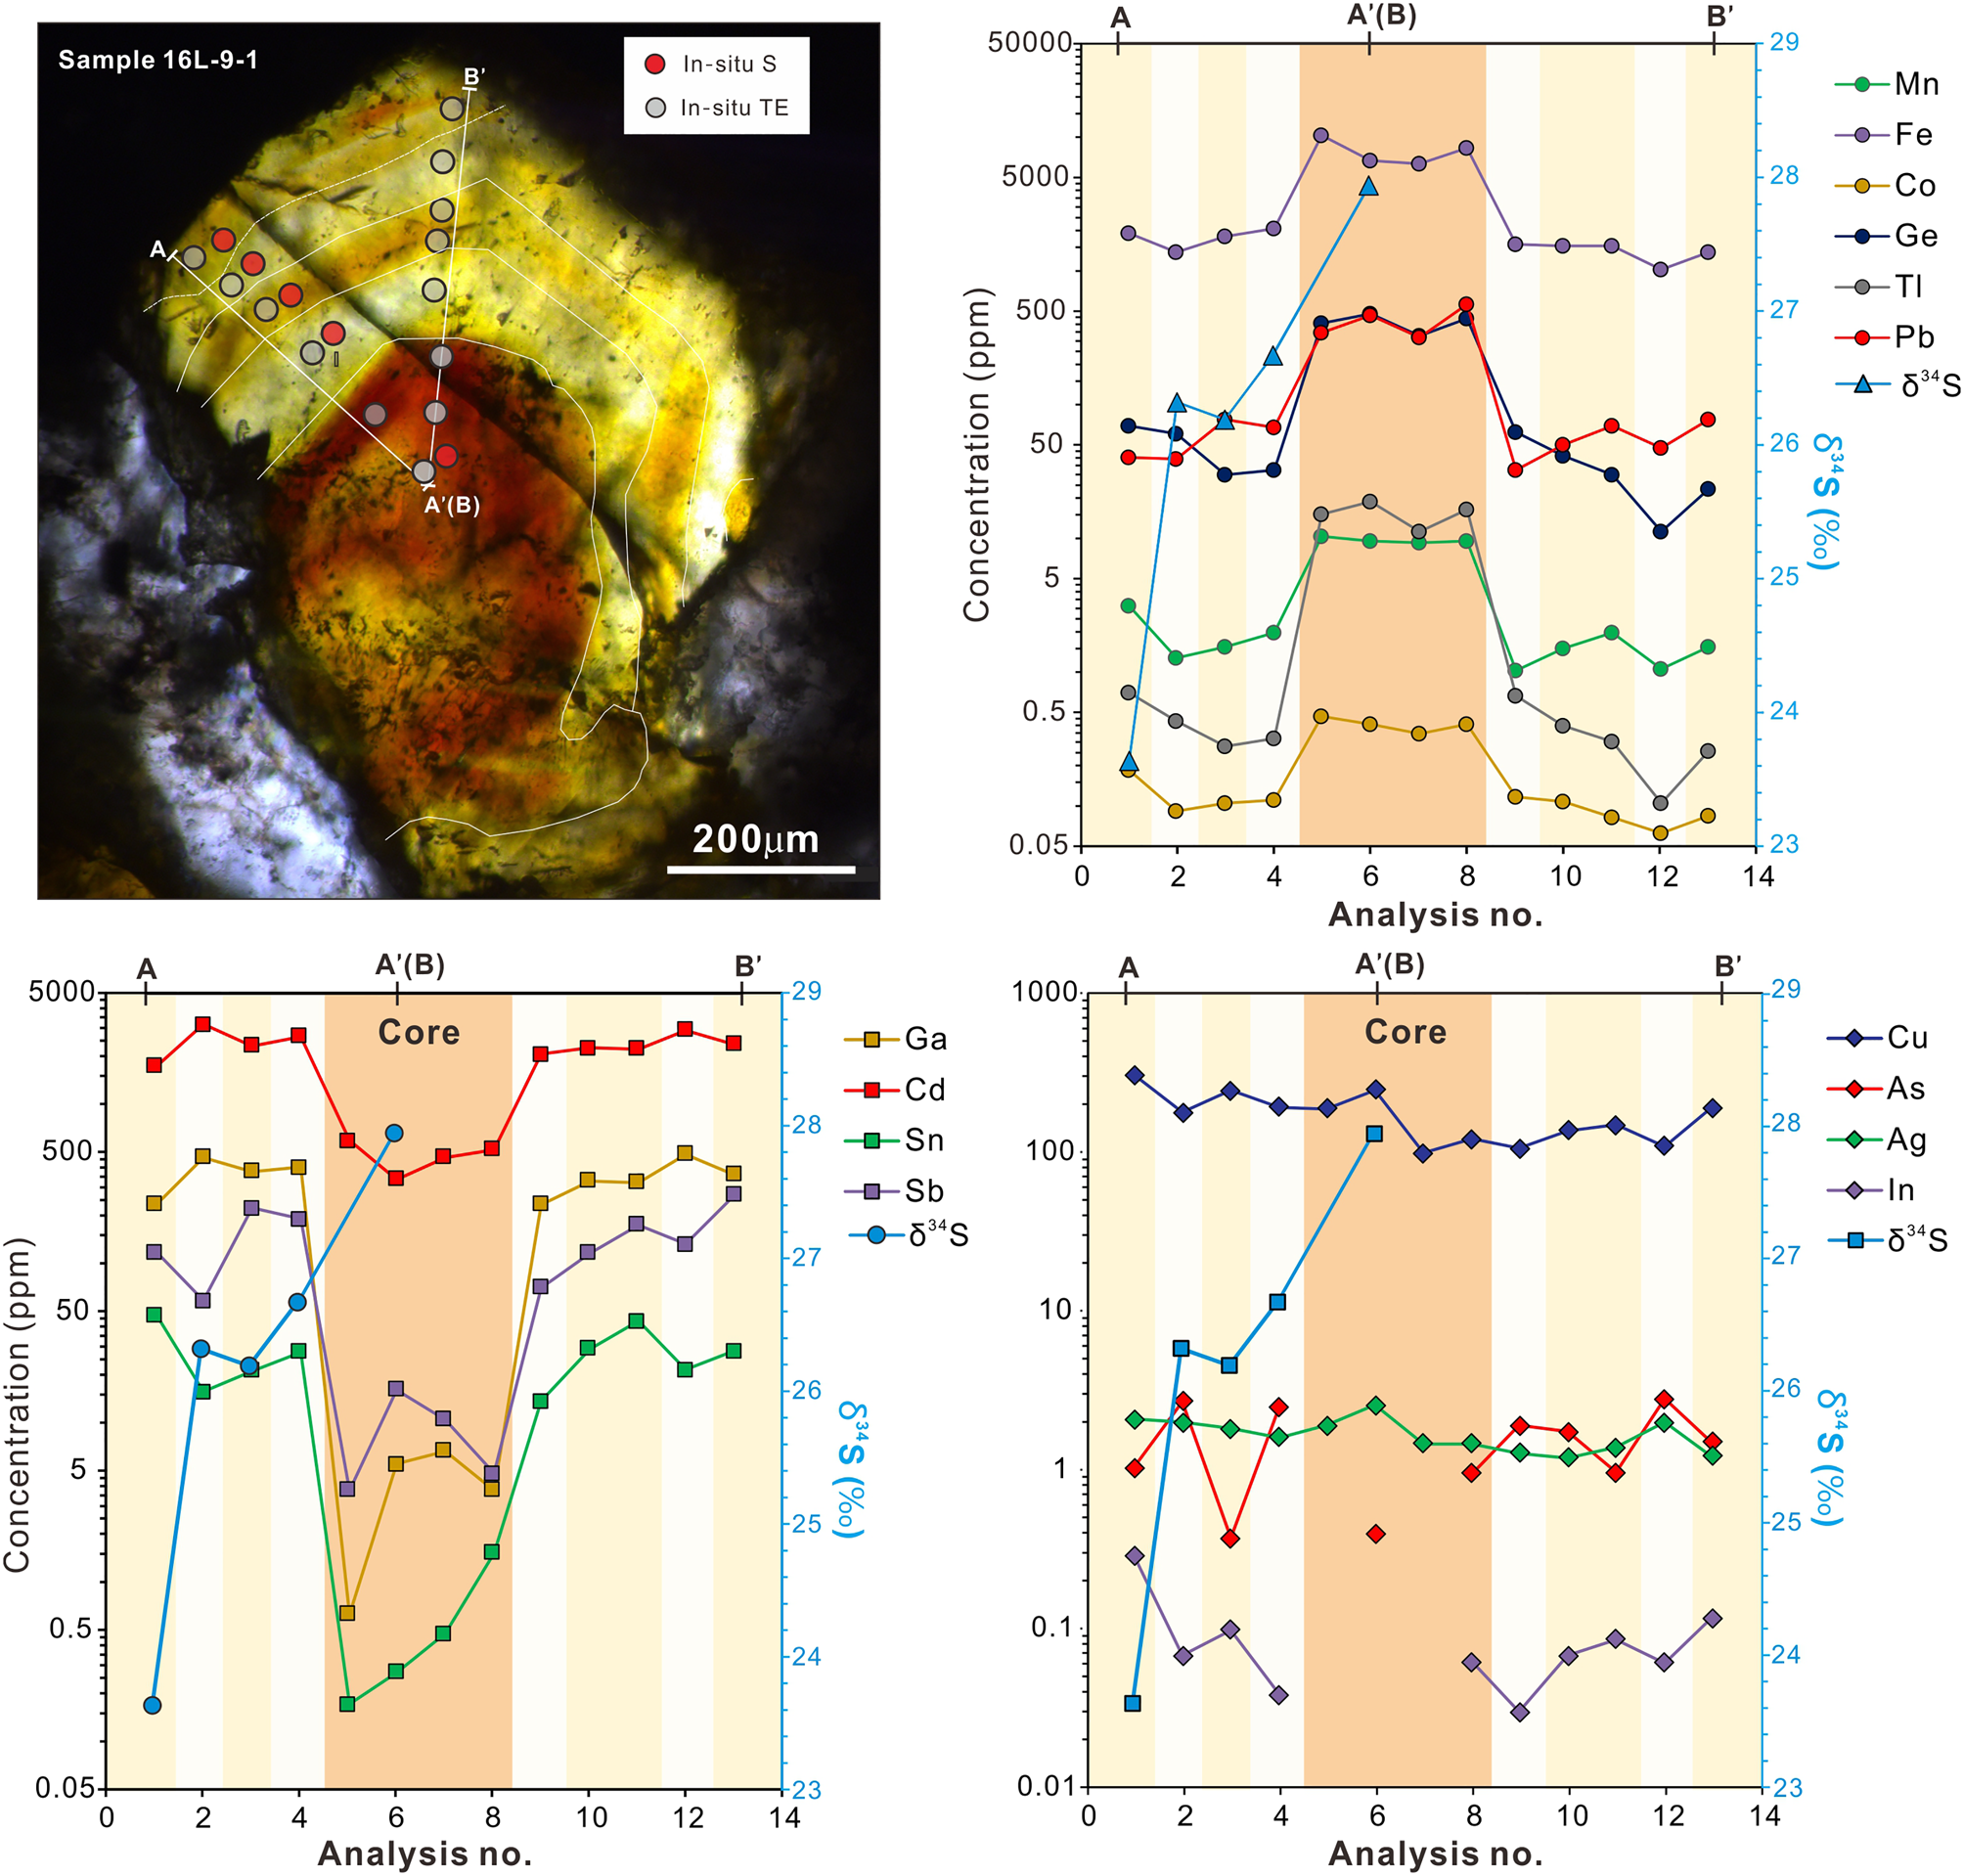
Fig. 7. Detailed traverses obtained for the CMR pattern of sphalerite from sample 16L-9-1 showing the variation of trace elements and sulfur isotopes in a sphalerite crystal. TE= trace elements.
Sulfur isotopic compositions
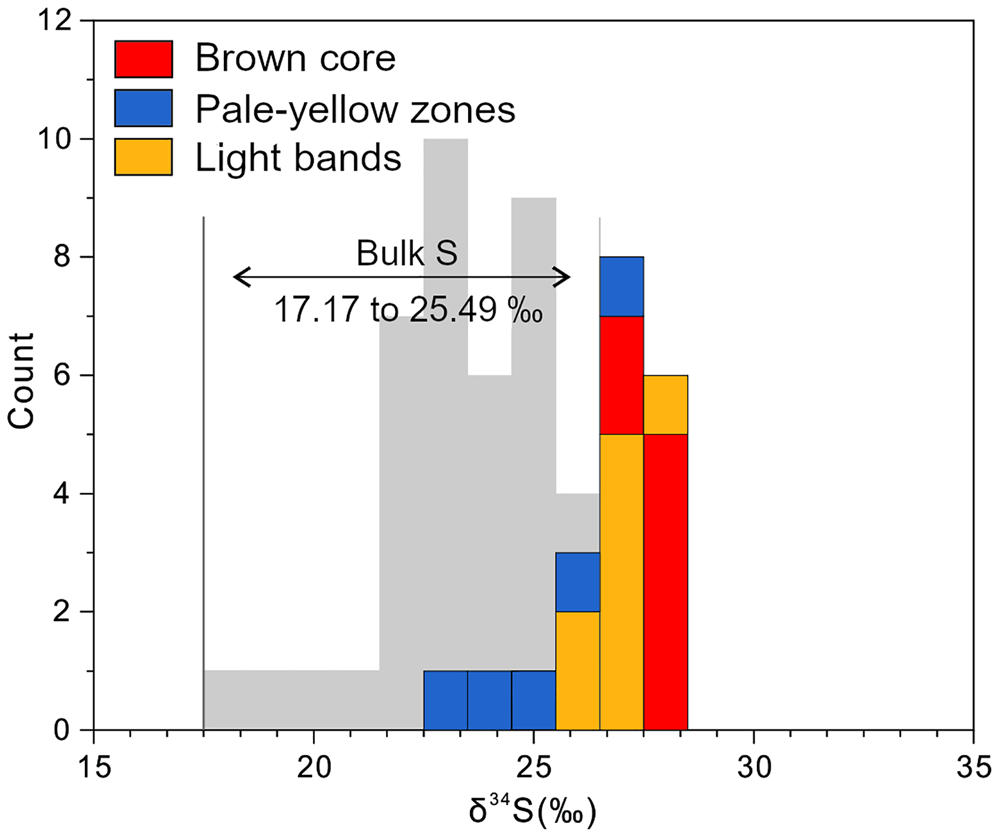
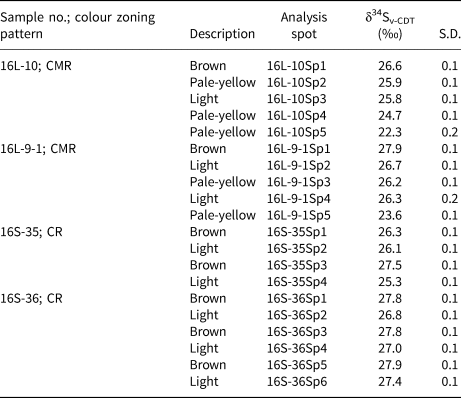
The sulfur isotopic compositions were determined by in situ LA-MC-ICP-MS analyses (Table 2 and Fig. 8). All 20 spots correspond with prior trace-element spot analyses. The δ34S values of seven spots in brown cores vary from +26.3 to +27.9‰, (mean of +27.4±0.7‰); five analyses of pale-yellow bands yield a relatively wide range in δ34S values from +22.3 to +26.2‰, with a mean of +24.6±1.6‰; the δ34S values of light zones range from +25.3 to +27.4‰ (mean of +26.4±0.7‰, n = 8).

Fig. 8. (a) Histogram of δ34S variation in the three zones within sphalerite. The bulk S dataset is from Jin et al. (Reference Jin, Zhou, Huang, Luo, Gao, Peng, Wang and Chen2016) and Zhou et al. (Reference Zhou, Wang, Wilde, Luo, Huang, Wu and Jin2018).
Table 2. In situ S isotopic composition for the three colour zones in sphalerite from the Nayongzhi Zn–Pb deposit determined by LA-MC-ICPMS.

S.D. – standard deviation; CMR – core–mantle–rim texture; CR – core–rim texture.
The relationship between trace element and δ34S
In Fig. 9, the δ34S values show a positive correlation with Fe and a negative correlation with Ga, In and Sn when plotted in bulk. However, these correlations cannot be seen when these same data are considered in the context of crystal zonation (Fig. 7). Iron, Co, Ga, In and Sn do not co-vary with the δ34S values when the geochemical data were plotted from crystal core to rim, which is why the apparent relationships between Fe, Co, Ga, In and Sn and δ34S on the bulk binary plots is considered meaningful.

Fig. 9. Binary plots of the Fe, Ga, In and Sn contents of the zoned sphalerite versus δ34S value.
Discussion
The relationship between colour and composition
Sphalerite from MVT deposits ranges in colour from white to dark brown with variable yellow to red-brown intermediates. It has been shown that the colours of sphalerite formed in various environments are attributed to the substitution of Fe for Zn in the sphalerite lattice (e.g. Slack et al., Reference Slack, Roberts and Ham1967; Mclimans et al., Reference McLimans, Barnes and Ohmoto1980; Hill et al., Reference Hill, Rowlands and Finch1985; L'Heureux, Reference L'Heureux2000; Barrie et al., Reference Barrie, Boyce, Boyle, Williams, Blake, Wilkinson, Lowther, McDermott and Prior2009 and references therein). However, several authors recently found that the colour of colloform sphalerite shows a strong correlation with As content rather than Fe content (especially Fe<1.0 wt.%) in studies of MVT deposits (e.g. Pfaff et al., Reference Pfaff, Koenig, Wenzel, Ridley, Hildebrandt, Leach and Markl2011; Gagnevin et al., Reference Gagnevin, Menuge, Kronz, Barrie and Boyce2012), leading to the prediction that the crystalline sphalerite at Nayongzhi with higher As concentration tends to be darker. However, the highest As contents (median of 2.08 ppm) were measured in the lightest sphalerite (light bands), suggesting the colour of sphalerite at Nayongzhi is unlikely to be controlled by As concentrations. In contrast, the median value of Fe concentrations increases from 0.20 wt.% in light bands, 0.31 wt.% in pale-yellow zones to 1.14 wt.% in brown cores. This trend suggests sphalerite with higher Fe concentration tends to be darker. In vein-hosted colour-zoned sphalerite of the Dadongla Zn–Hg deposit, South China, elevated Fe concentrations also correlate with brown sphalerite (Hu et al., Reference Hu, Ye and Wei2020). Iron has the highest measured concentration in sphalerite compared to any other elements analysed in this investigation and a well-defined correlation between Fe concentration and sphalerite colour was identified. So, the colour in crystallised sphalerite could be tentatively ascribed to Fe variation.
LA-ICP-MS element-distribution maps (Fig. 6) and linear traverses (Fig. 7) display concomitant changes in trace elements, Pb, Ge, Tl and Mn, decrease by an order of magnitude or more from brown cores to light rims. Indium and Co decrease to a lesser extent. Concentrations of Sb, Cd, Ga and Sn increase by an order of magnitude or more at the transition from brown cores to light rims. These elements also show a remarkable correlation with sphalerite colour. However, other studies of zoned sphalerite did not find a correlation between In, Sn, As and Ge and colour (Belissont et al., Reference Belissont, Boiron, Luais and Cathelineau2014; Hu et al., Reference Hu, Ye and Wei2020). Therefore, the relationship between sphalerite and content of Pb, Ge, Tl, Mn Sb, Cd, Ga and Sn remains poorly constrained. As many previous studies did not analyse these elements further study is required.
Implications from S isotope composition
Source of sulfur and the precipitation mechanism for sulfides
The in situ δ34S values obtained in this investigation range from +22.3‰ to +27.9‰, which is consistent with previous bulk sulfur isotopic data on the Nayongzhi sphalerite (+17.17‰ to +25.49‰; Fig 8; Jin et al., Reference Jin, Zhou, Huang, Luo, Gao, Peng, Wang and Chen2016; Zhou et al., Reference Zhou, Wang, Wilde, Luo, Huang, Wu and Jin2018). A plausible explanation for the sulfur compositions of sphalerite is that it is formed by thermochemical sulfate reduction (TSR) of Cambrian marine sulfate (+28‰–+32‰, Claypool et al., Reference Claypool, Holser, Kaplan, Sakai and Zak1980). TSR commonly produces sulfur isotope fractionation between SO42– and H2S of 0 to 15‰ (Goldhaber and Kaplan, Reference Goldhaber and Kaplan1975; Seal, Reference Seal and Vaughan2006). The lowest δ34S values observed for sphalerite (+22.3‰) in this study suggests TSR might have occurred alongside the process associated with sulfide precipitation at Nayongzhi, in agreement with previous observations (Jin et al., Reference Jin, Zhou, Huang, Luo, Gao, Peng, Wang and Chen2016; Zhou et al., Reference Zhou, Wang, Wilde, Luo, Huang, Wu and Jin2018). Overall, the reduced sulfur originates from thermochemical sulfate reduction of seawater sulfate within the ore-hosted strata. It is worth noting that the majority of the metals were derived from the Proterozoic metamorphic basement (e.g. Zhou et al., Reference Zhou, Wang, Wilde, Luo, Huang, Wu and Jin2018; Wei et al., Reference Wei, Ye, Huang, Hu and Wang2020). These results suggest metals and reduced sulfur did not travel together in a single hydrothermal fluid, instead a more probable hypothesis is that there is mixing of basement-derived metal-rich fluids and the H2S-bearing fluid from ore-hosted strata at the site of sulfide precipitation (e.g. Deloule et al., Reference Deloule, Allegre and Doe1986; Pfaff et al., Reference Pfaff, Hildebrandt, Leach, Jacob and Markl2010 and references therein), which is in agreement with fluid-inclusion data (Wei, Reference Wei2018).
Crystal-scale S isotope variations
Considerable S isotope intergrain variations have been observed within individual samples (Table 3 and Fig. 7) and even within single sphalerite grains (up to 4.3‰). To better understand the microscale variation of δ34S values in Nayongzhi sphalerite, evaluation of the parameters affecting the S isotope compositions is required.
Table 3. Microthermometric data for fluid inclusions in the zoned sphalerite sample 16L-9-1 at Nayongzhi.*
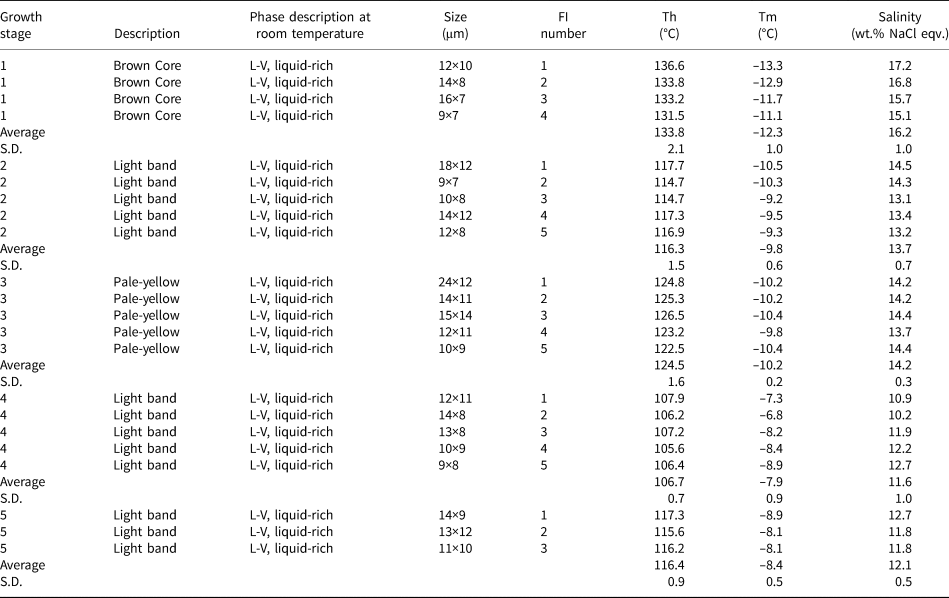
* Microthermometric data from Wei (Reference Wei2018).
S.D. = Standard Deviation; FI – fluid inclusion; Th – homogenization temperature; Tm – melting temperature.
Considering that the reduced sulfur is derived from the same source, other factors, such as temperature, pH, $f_{{\rm O}_ 2}$ , and the δ34S values of the H2S responsible for precipitating sulfides can significantly influence the S isotope composition of hydrothermal sulfide minerals (Sasaki and Krouse, Reference Sasaki and Krouse1969; Ohmoto, Reference Ohmoto1972). The fluid-inclusion homogenisation temperature of colour-zoned sphalerite grains ranges from 105.6 to 136.8°C (Table 3 and Fig. 10; data from Wei, Reference Wei2018), indicating appreciable fluctuations in temperature during the process of sulfide precipitation. However, the S isotopic fractionation between H2S and ZnS is very small (<1.0‰) in this temperature range. Therefore, temperature cannot be a significant factor in producing the observed δ34S variation. Calculations presented by Ohmoto (Reference Ohmoto1972) suggest that within the stability field of sphalerite, change in pH, and $f_{{\rm O}_ 2}$
 would have insignificant influence on δ34S variation (~0.5‰). Thus, the δ34S variations in sphalerite appear to have been controlled by predominantly the δ34S composition of H2S in the original fluid, although the influence of temperature, pH and/or $f_{{\rm O}_ 2}$
 cannot be entirely ruled out.

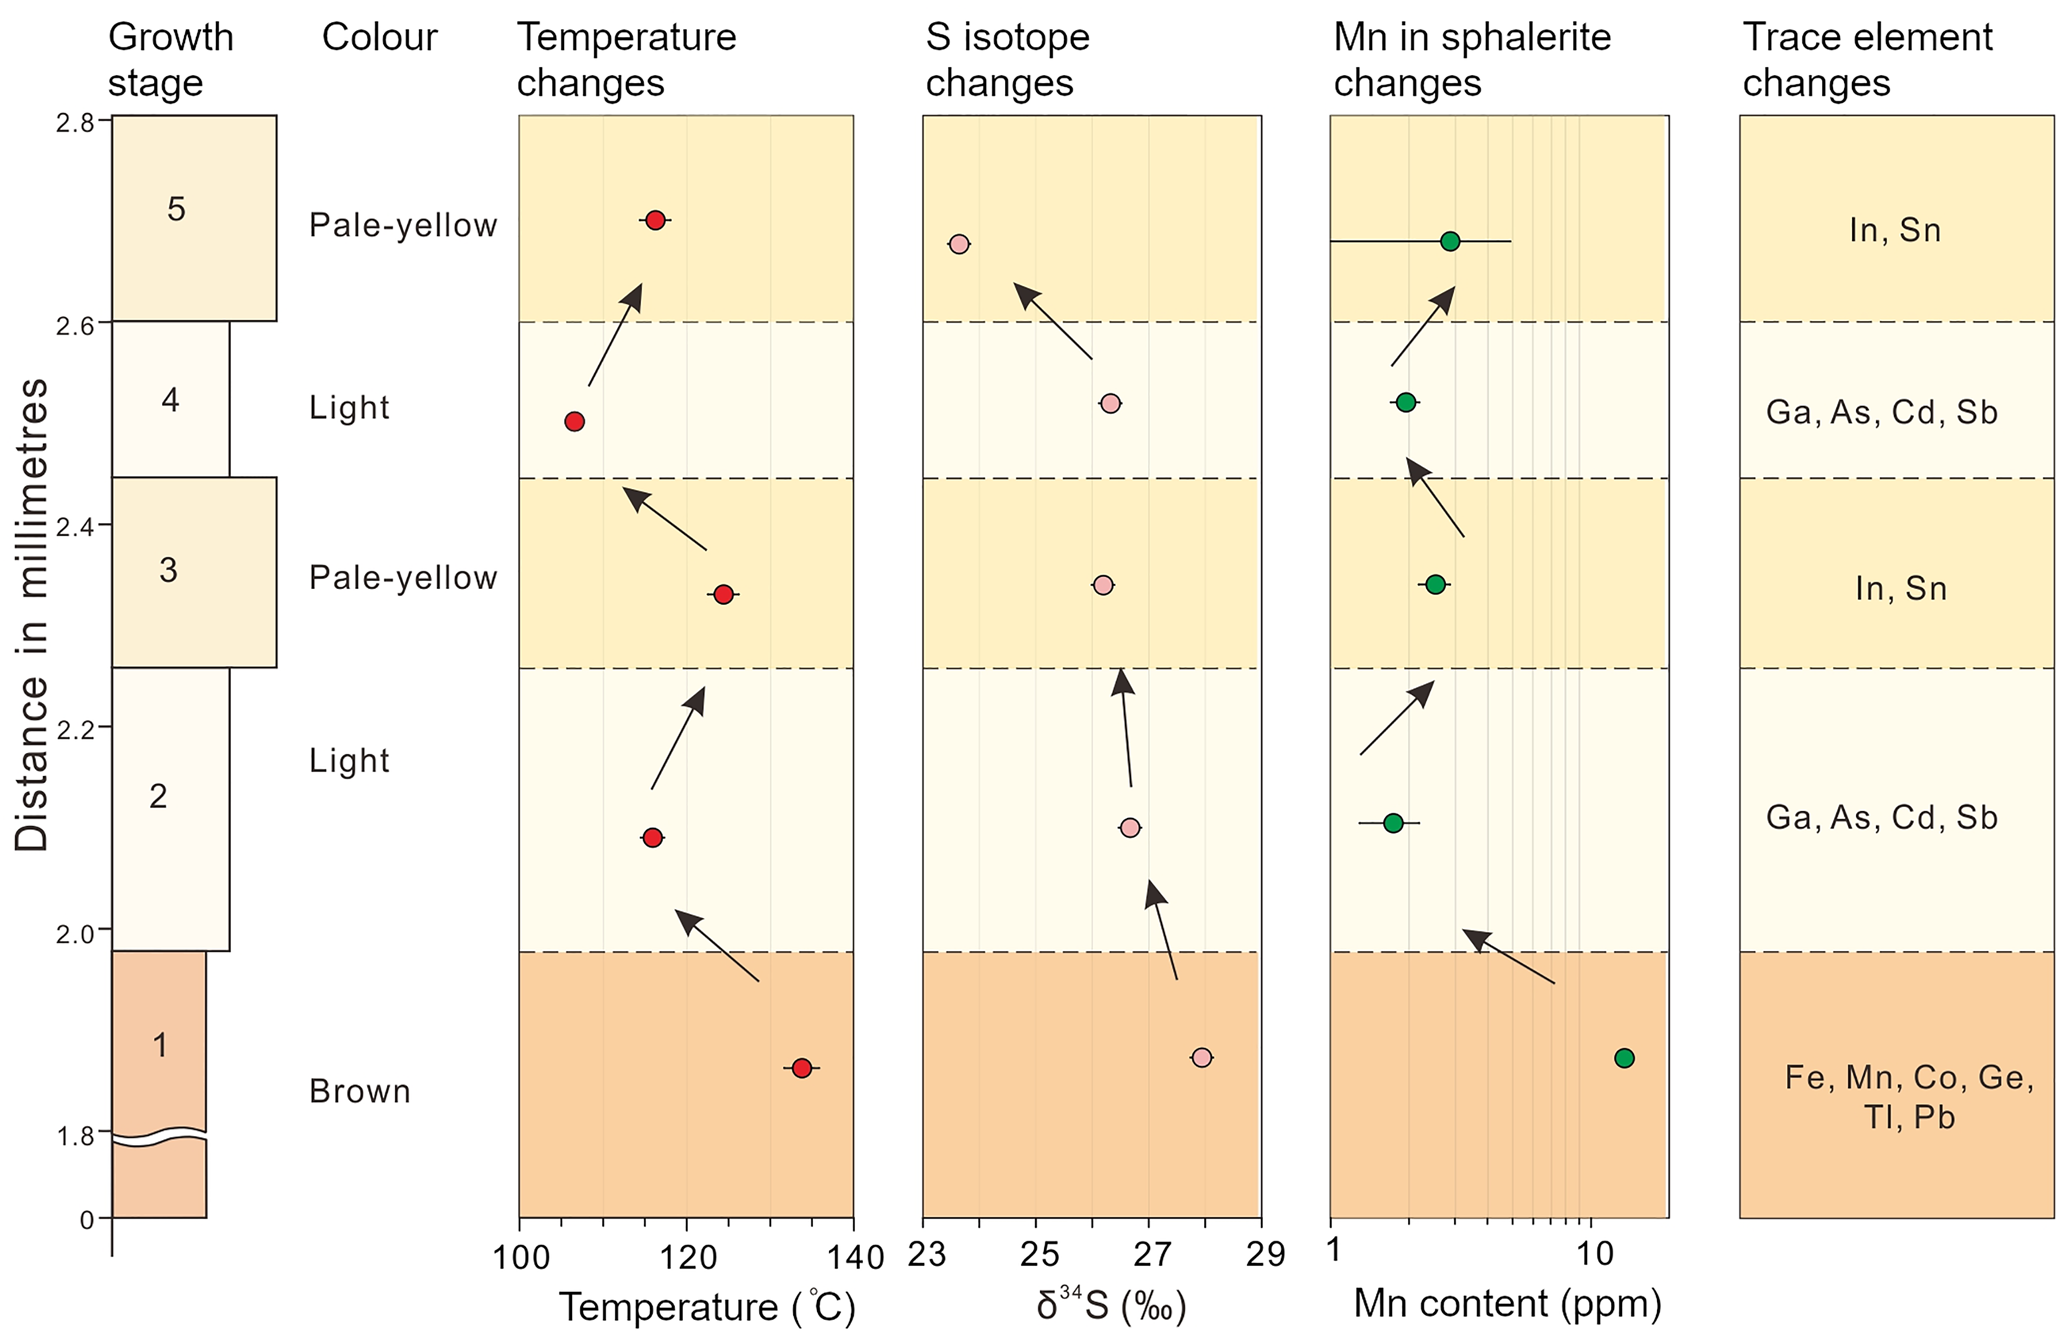
Fig. 10. Diagram correlating changes in colour, S isotope, redox condition, temperature, and trace-element distribution within a typical CMR pattern of the sphalerite sample (16L-9-1) studied.
Controls on the zoned sphalerite crystals
Colour bands and/or zones are common in sphalerite in MVT deposits (e.g. Beaudoin, Reference Beaudoin2000; Barrie et al., Reference Barrie, Boyce, Boyle, Williams, Blake, Wilkinson, Lowther, McDermott and Prior2009). Many studies have proposed two main mechanisms responsible for compositional zoning: (1) internal crystal growth processes representing self-organised phenomena controlled by kinetic factors, such as crystal growth rate and diffusion rate of key elements in the hydrothermal fluid (Fowler and L'Heureux, Reference Fowler and L'Heureux1996; Holten et al., Reference Holten, Jamtveit, Meakin, Cortini, Blundy and Austrheim1997; L'Heureux et al., Reference L'Heureux2000; Benedetto et al., 2005, Belissont et al., Reference Belissont, Boiron, Luais and Cathelineau2014); and (2) cyclic variations of external factors (e.g. temperature, $f_{{\rm O}_ 2}$ , pH and mineralising fluid composition; Holten et al.,1997; Beaudoin, Reference Beaudoin2000; Kelley et al., Reference Kelley, Leach, Johnson, Clark, Fayek, Slack, Anderson, Ayuso and Ridley2004; Barrie et al., Reference Barrie, Boyce, Boyle, Williams, Blake, Wilkinson, Lowther, McDermott and Prior2009; Pfaff et al., Reference Pfaff, Koenig, Wenzel, Ridley, Hildebrandt, Leach and Markl2011; Gagnevin et al., Reference Gagnevin, Menuge, Kronz, Barrie and Boyce2012 and Hu et al., Reference Hu, Ye and Wei2020).
Holten et al. (Reference Holten, Jamtveit and Meakin2000) found that the study of neighbouring mineral grains is an effective way to distinguish self-organisation from external fluctuations as the main cause for mineral zoning. It was concluded that, if these minerals grains all show similar zoning, external fluctuations are the probable cause. In Nayongzhi, the colour-zoned sphalerite occurs as a cluster, as shown in Fig. 2b. Wei et al. (Reference Wei, Yan, Huang and Hu2018b) found that the hydrothermal dolomite coexisting with colour-zoned sphalerite also displays well-developed colour zoning in cathodoluminescence images. Furthermore, this variation in trace-element composition was observed within single crystals. For instance, concentrations of Fe, Ga, Ge, Sb and Pb vary over two orders of magnitude across different colour zones, suggesting that spontaneous chemical self-organisation is highly unlikely (Figs 5−7). Therefore, the internal crystal processes have a very limited influence on the colour-zoned sphalerite in this investigation. Other factors, such as physicochemical conditions (e.g. pH, temperature and $f_{{\rm O}_ 2}$ ), mineralising fluid composition and the S isotope variations are probably important (e.g. Kelley et al., Reference Kelley, Leach, Johnson, Clark, Fayek, Slack, Anderson, Ayuso and Ridley2004; Barrie et al., Reference Barrie, Boyce, Boyle, Williams, Blake, Wilkinson, Lowther, McDermott and Prior2009; Pfaff et al., Reference Pfaff, Koenig, Wenzel, Ridley, Hildebrandt, Leach and Markl2011; Hu et al., Reference Hu, Ye and Wei2020 and reference therein).
Physicochemical conditions
It is possible that variation in colour-zoned sphalerite is brought about by changes in the physicochemical conditions accompanying mineralisation (Barton et al., Reference Barton, Bethke and Roedder1977; Pattrick et al., Reference Pattrick, Dorling and Polya1993; Pfaff et al., Reference Pfaff, Koenig, Wenzel, Ridley, Hildebrandt, Leach and Markl2011; Gagnevin et al., Reference Gagnevin, Menuge, Kronz, Barrie and Boyce2012). Many studies have deduced the pH value fluctuates from 5 to 7 at 150°C for similar MVT Zn–Pb deposits (e.g. Sverjensky, Reference Sverjensky1984; Leach et al., Reference Leach, Sangster, Kelley, Large, Garven, Allen, Gutzmer and Walters2005; Pfaff et al., Reference Pfaff, Hildebrandt, Leach, Jacob and Markl2010). Redox conditions of the hydrothermal fluids can be estimated qualitatively using the Mn content of sphalerite. Under reduced conditions, Mn tends to be incorporated into sphalerite lattices as MnS rather than forming Mn oxides (Vaughan and Craig, Reference Vaughan, Craig and Barnes1997). High Mn concentration in sphalerite thus suggests relatively reduced conditions. At Nayongzhi, the median value of Mn concentrations decreases from brown cores (13.1 ppm), pale-yellow zones (4.32 ppm) to light bands (1.80 ppm), suggesting sphalerite with darker colours tend to be relatively more reduced. There are two pluses in the Mn concentration in the CMR pattern of the sphalerite crystal selected from the proximity of the F12 fault. The most pronounced Mn content fluctuation occurs in the first pulse, decreasing from 13.43±0.59 to 1.74±0.45 ppm, and then increasing to 2.53±0.35 ppm. The second pulse is marked by smaller variations (1.94±0.25 ppm–2.87±2.02 ppm). The fluctuation of Mn content indicates the $f_{{\rm O}_ 2}$ level experienced at least two pulses during the growth of sphalerite. A similar temperature fluctuation is indicated by Table 3 and Fig. 10. Considering the sulfide precipitation was caused by mixing of two contrasting hydrothermal fluids, the pH showed coordinated variation with these parameters (temperature and $f_{{\rm O}_ 2}$
 ) (Pfaff et al., Reference Pfaff, Koenig, Wenzel, Ridley, Hildebrandt, Leach and Markl2011). In summary, the physicochemical conditions (e.g. pH, temperature and $f_{{\rm O}_ 2}$
 ) are coupled with colour changes during the growth process of the CMR pattern of Nayongzhi sphalerite crystal.
Hydrothermal fluid composition
The distribution of individual metals in sphalerite is also controlled by the composition of ore fluids (e.g. Viets et al., Reference Viets, Hopkins and Miller1992; Kuhlemann and Zeeh, Reference Kuhlemann and Zeeh1995). High Fe, Mn, Ge and Tl contents in brown cores are accompanied by pyrite (Fig. 2c). This would suggest an initial higher concentration of Zn, Fe, Mn and Tl in hydrothermal fluid and a higher sulfidation state relative to other colour bands (the modal volume of minerals decreases in the order: brown sphalerite>pyrite>galena). In contrast, pale-yellow bands of sphalerite are free of mineral inclusions and enriched in In, Sn and Ga, suggesting the fluid responsible for forming the pale-yellow bands has higher concentrations of In, Sn and Ga. Additionally, the relative amounts of Sb and As concentration in light bands and coexisting with high Sb galena (up to 0.35 wt.%; Wei, Reference Wei2018) infer that the fluid of light zones was elevated in Sb and As. Consequently, the fluid composition also shows a significant influence on the variable trace elements in colour-zoned sphalerite from Nayongzhi.
Effect of S isotope variation
The colour-zoned sample shows a clear variation in both colour and S isotope composition from the core to rim (Figs 7−8 and 10). Although colour changes between some zones, especially within the CR texture of the sphalerite crystal do appear to correspond to an associated change in the S isotopic composition, this is not consistent, and the nature of the changes is not systematic between colour zones relative time (from crystal core to rim), which is in agreement with results from other studies (Belissont et al., Reference Belissont, Boiron, Luais and Cathelineau2014; Hu et al., Reference Hu, Ye and Wei2020). This suggests that the change in sulfur isotopic compositions has no relationship with the colour-zoned sphalerite at Nayongzhi.
In summary, a concomitant change recorded in colour-zoned sphalerite from Nayongzhi has been observed to accompany the changes in physicochemical conditions (e.g. pH, temperature and $f_{{\rm O}_ 2}$ ) and fluid composition, demonstrating that external factors exert a significant influence on the formation of the zoned sphalerite at Nayongzhi.
Interpretation of the decoupling between δ34S and trace elements at a crystal scale
We have established that the δ34S values of zoned sphalerite are controlled mainly by the δ34S composition of original fluid rather than the change of temperature, pH and/or $f_{{\rm O}_ 2}$ . Therefore, the δ34S variation could not reflect the changes of physicochemical condition during the growth of sphalerite but records the potential source(s) of sulfur. In addition, the significant difference in trace-element concentrations among the three identified colour zones has been recognised. On the basis of the LA-ICP-MS and TEM studies, trace elements commonly occur as solid solutions in colour-zoned sphalerite. We interpret the trace-element variation in sphalerite as a record of external environmental changes (such as pH, temperature, $f_{{\rm O}_ 2}$
 , and the composition of metal-bearing hydrothermal fluid) during the growth of sphalerite. Systematic changes in metal concentrations in the ore-forming fluid and the physicochemical conditions (e.g. pH, temperature and $f_{{\rm O}_ 2}$
 ) might cause the formation of the colour-zoned sphalerite observed in this investigation. Therefore, all the evidence points to decoupling between δ34S and trace elements during the formation of the colour-zoned sphalerite at a crystal scale. A plausible explanation is the persistence of a cyclic plumbing system open to the ore solution in Nayongzhi. Episodic injection of ore solution mixes with a reduced sulfur-rich fluid derived from the aquifers of the ore-hosted strata, causing the cyclic changes of pH, temperature, $f_{{\rm O}_ 2}$
 , and fluid composition and finally forming the colour-zoned sphalerite crystal in Nayongzhi.
Growth history of zoned sphalerite
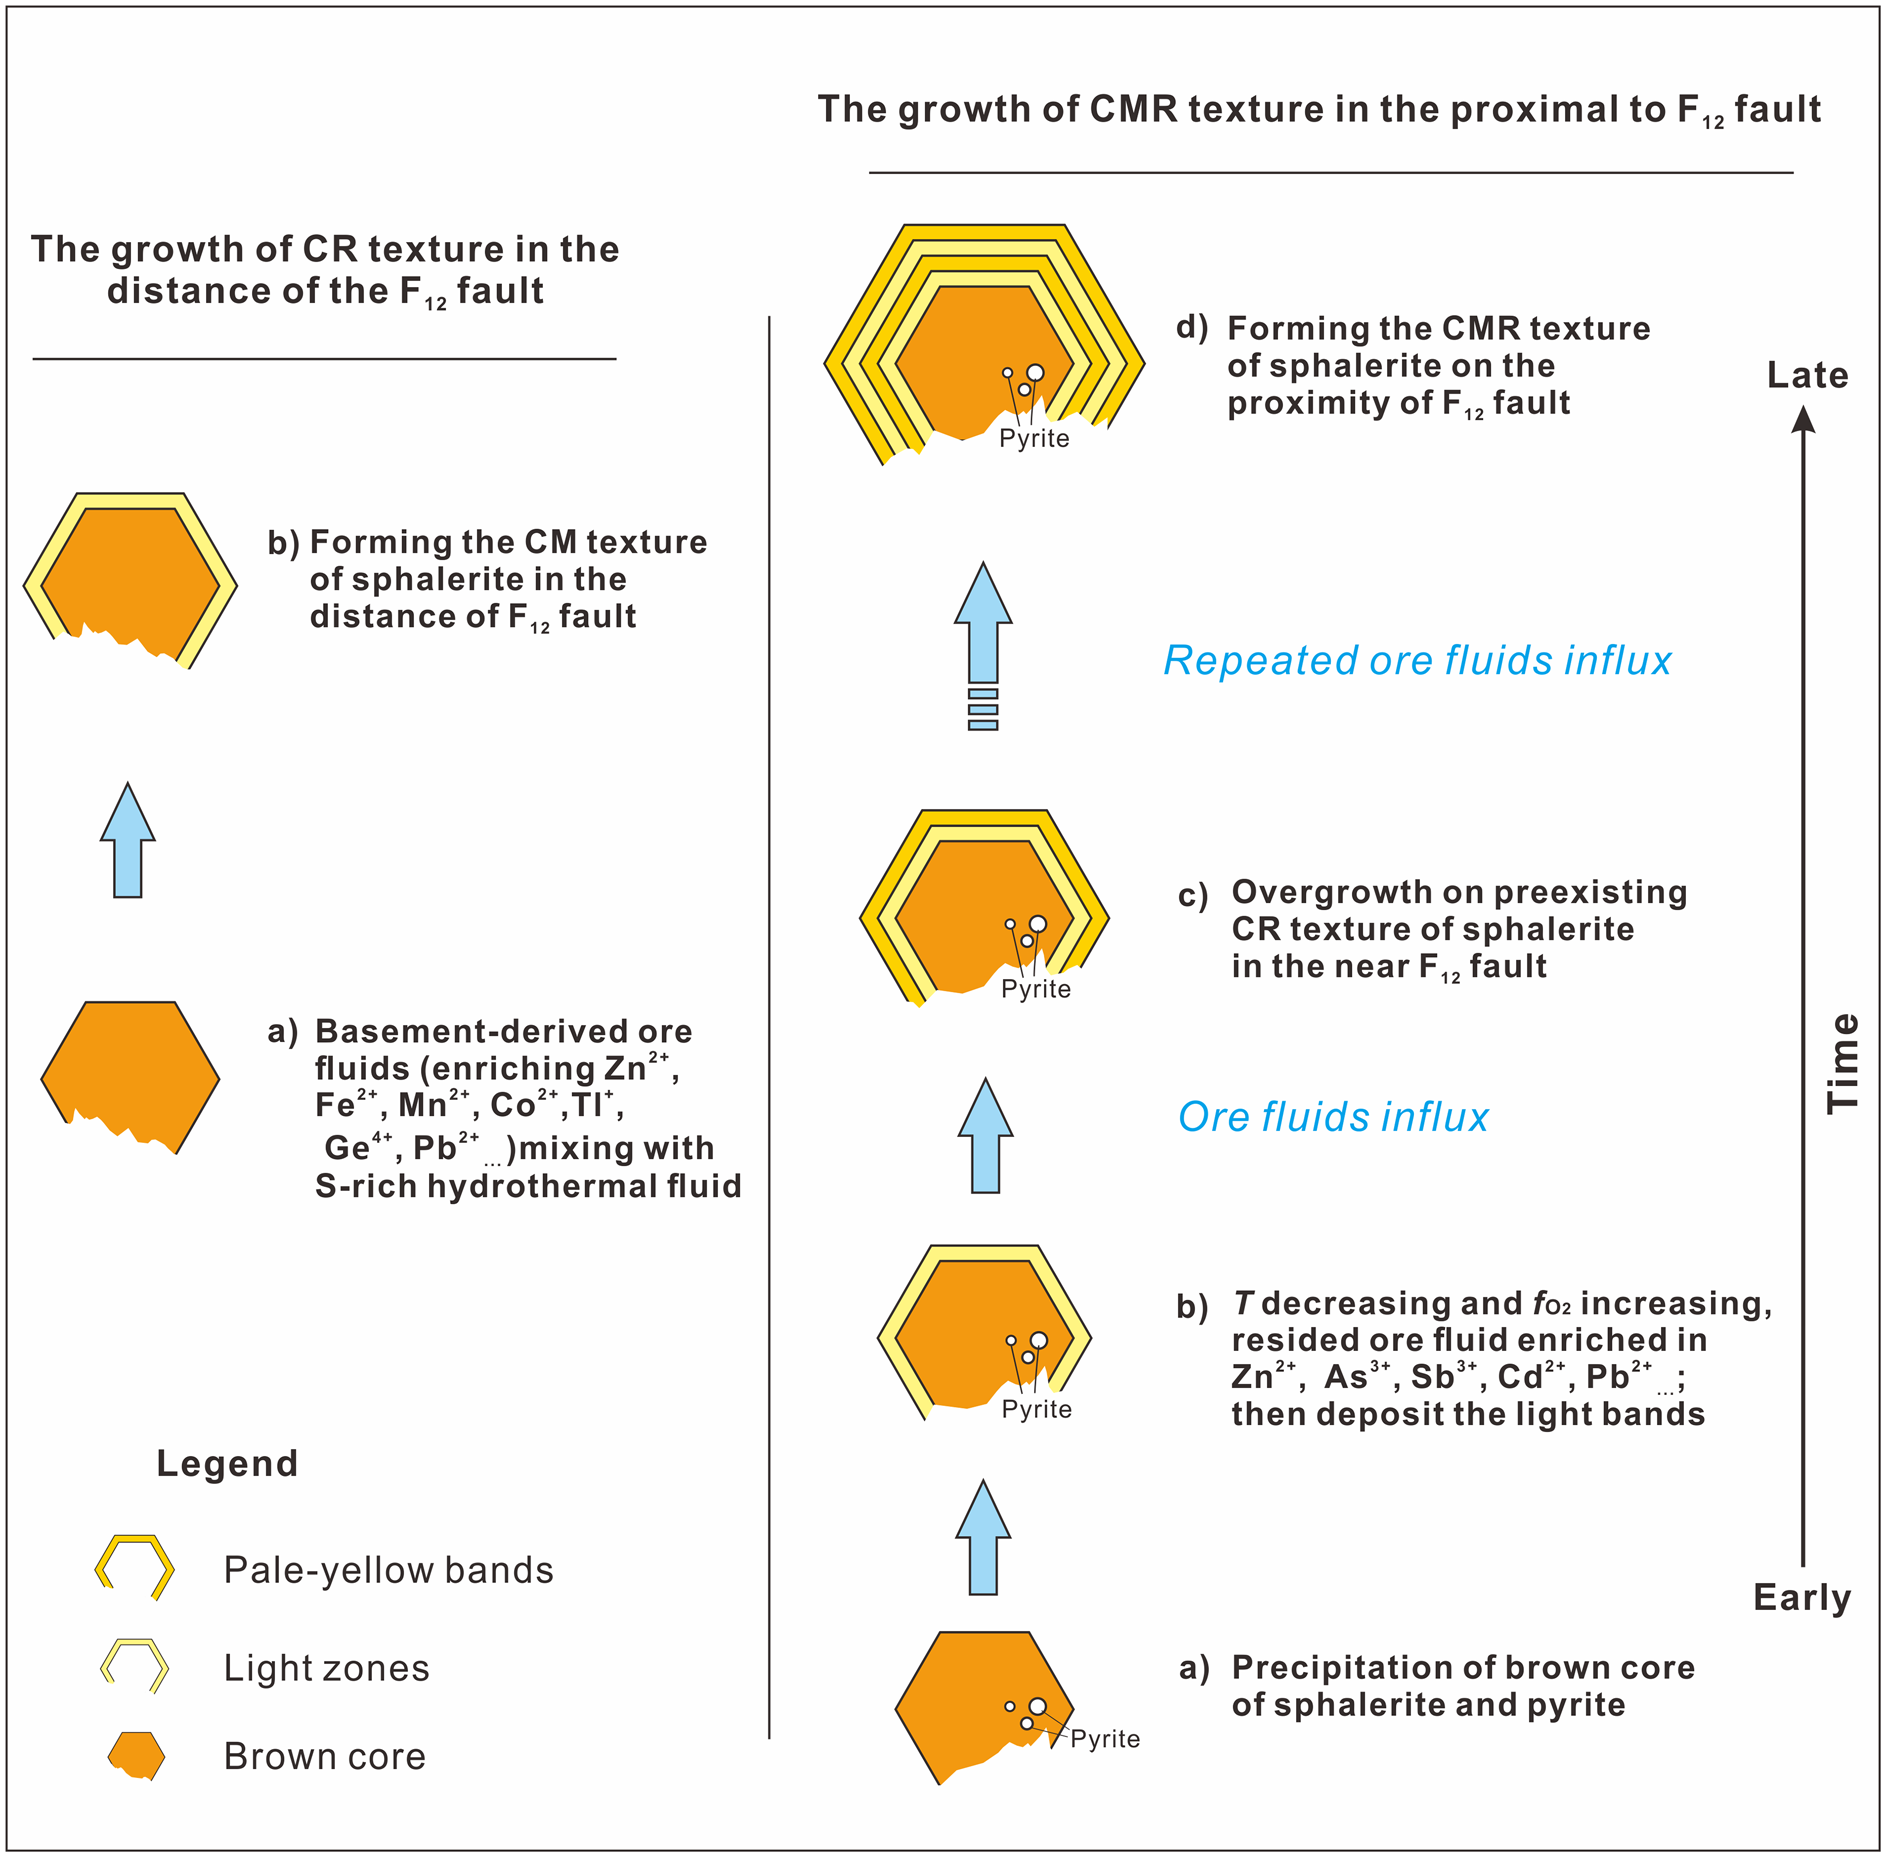
A pulsed influx of metal-rich fluid was probably significant in the formation of the colour-zoned sphalerite (Fig. 11). In the early stage, deep-seated fluids flowed up the NW-trending F12 fault, stalled at the high-porosity Cambrian carbonate rocks, and mixed with the sulfur-rich sedimentary formation water resulting in deposition of the brown sphalerite and/or minor pyrite. During the deposition of the subhedral brown sphalerite, ore fluids were probably reduced as indicated by the high Mn content measured (Fig. 10). Temperature is thought to have been between 131.5°C and 136.6°C on the basis of microthermometry of fluid inclusions within the brown core of the sphalerite (Table 3).

Fig. 11. Schematic diagram showing the growth history of the zoned sphalerite from the Nayongzhi deposit. See text for explanations.
With the deposition of the sulfide ore, the F12 fault was sealed, and the original hydrothermal system was restored. As temperature decreases and $f_{{\rm O}_ 2}$ increases, Ga, Cd, Sb and As tend to reside in hydrothermal fluid, which mixes with the H2S-bearing fluid from ore-hosted strata, forming light-coloured zones. After the deposition of light zones, relatively high-temperature basement-derived fluids entered the ore horizon and pale-yellow bands overgrew the pre-existing CR texture of sphalerite in the proximity of the F12 fault. Pale-yellow bands could not be observed distal to the F12 fault, possibly because of a small volume of basement-derived fluids. Metals carried by the basement-derived hydrothermal fluid are completely precipitated near the F12 fault. This interpretation is supported by: (1) the narrow band width (Fig. 2c,d) and the relatively low temperature (122.5–126.5°C) compared to early brown cores (Fig. 10); (2) the decrease of the ore grade and the ore thickness distal to the F12 fault (Wei et al., Reference Wei, Ye, Huang, Hu and Wang2020).
The cyclic influx of ascending basement-derived fluids caused precipitation of pale-yellow and light zones on pre-existing sphalerite crystals in the proximity of the F12 fault, ultimately forming the CMR texture of sphalerite at Nayongzhi.
A similar mechanism has been proposed to explain colour banding within individual sphalerite crystals in the West Shropshire Orefield, England, which is thought to have formed due to episodic injection of hydrothermal fluids that controlled adsorption of various metal cations into zoned sphalerite (Pattrick et al., Reference Pattrick, Dorling and Polya1993). Therefore, it is possible that the formation of the colour-zoned sphalerite can be attributed to periodic injection of the ore solution along the same open fracture.
Conclusions and implications
Prior to this investigation, little detailed work had been carried out on the genesis and significance of growth zoning in sphalerite. Microscopic-scale studies of colour-zoned sphalerite have a critical role to play in gaining a better understanding of the growth mechanism of zoned sphalerite. Data obtained by LA-ICP-MS analysis revealed various trace-element compositions in the three identified colour zones. It was found that the sphalerite colour variation could be ascribed tentatively to Fe concentration, due to the relatively lower contents of other metals (Pb, Ge, Tl, Mn Sb, Cd and Ga). Our investigation revealed intracrystalline zonation of δ34S of up to 4.3‰, which is expected to be controlled by the δ34S composition of H2S in the original fluid but the effect of the physicochemical conditions (e.g. temperature, $f_{{\rm O}_ 2}$ and pH) cannot be precluded. Poor correlation between trace elements and the δ34S of colour-zoned sphalerite is ascribed to episodic injection of basement-derived ore solution mixing with a reduced sulfur-rich fluid derived from the aquifers of the ore-hosted strata. During the process, cyclic change of external factors, such as the physicochemical conditions (e.g. temperature and $f_{{\rm O}_ 2}$
 ) and fluid composition cause the formation of the colour-zoned sphalerite crystal at Nayongzhi. Overall, the millimetre and submillimetre scale of compositional variations in the colour-zoned sphalerite suggest the persistence of a cyclic plumbing system open to the ore solution in Nayongzhi, which is responsible for the large compositional range of some trace metals at the micrometre scale.
The use of LA-ICP-MS and TEM to investigate the colour-zoned sphalerite helps to give a better understanding of the occurrence of trace elements in sulfides. The research described here also represents a contribution to revealing the pulse fluid release for the formation of MVT deposits.
Acknowledgements
This research project was financially supported by the National Natural Science Foundation of China (41673056 and U1812402), the Key Program of Guizhou Natural Science Foundation ([2017]1421) and National Key R&D Program of China (2017YFC0602502). The authors thank Dr. Zhihui Dai at IGCAS and Kaiyun Chen at Northwestern University, China for helping with LA-(MC)-ICP-MS trace elements and sulfur isotopes analyses, respectively. Associate Editor Jason Harvey and two anonymous reviewers are thanked for their constructive comments and suggestions.
Supplementary material
To view supplementary material for this article, please visit https://doi.org/10.1180/mgm.2021.29