Introduction
Parmeliaceae (Lecanorales, Ascomycota) is the largest family of lichen-forming fungi with about 2500 species (Kirk et al. Reference Kirk, Cannon, Minter and Stalpers2008). It has been the subject of several recent phylogenetic studies aimed at identifying major monophyletic clades in the family and providing comprehensive classifications at the generic level (Blanco et al. Reference Blanco, Crespo, Divakar, Esslinger, Hawksworth and Lumbsch2004a, Reference Blanco, Crespo, Elix, Hawksworth and Lumbschb, Reference Blanco, Crespo, Ree and Lumbsch2006; Thell et al. Reference Thell, Högnabba, Elix, Feuerer, Kärnefelt, Myllys, Randlane, Saag, Stenroos and Ahti2009; Crespo et al. Reference Crespo, Kauff, Divakar, del Prado, Pérez-Ortega, Amo de Paz, Ferencova, Blanco, Roca-Valiente and Núñez-Zapata2010), but also to contribute to the delimitation of species (Molina et al. Reference Molina, Crespo, Blanco, Lumbsch and Hawksworth2004; Divakar et al. Reference Divakar, Molina, Lumbsch and Crespo2005; Wirtz et al. Reference Wirtz, Printzen and Lumbsch2008; Del-Prado et al. Reference Del-Prado, Cubas, Lumbsch, Divakar, Blanco, de Paz, Molina and Crespo2010). The problem of identifying species boundaries in one of the largest genera within Parmeliaceae, Usnea Dill. ex Adans., has caused serious difficulties to modern lichenologists. As a consequence, herbarium samples are frequently labelled as just Usnea sp. (Clerc Reference Clerc1998).
This cosmopolitan genus, comprising c. 350 species (Kirk et al. Reference Kirk, Cannon, Minter and Stalpers2008), is represented in all continents and includes several common and widely distributed taxa. The morphology, anatomy and secondary chemistry of Usnea species has been studied in different parts of the world (Clerc Reference Clerc1987b, Reference Clerc1997, Reference Clerc2004; Clerc & Herrera-Campos Reference Clerc and Herrera-Campos1997; Halonen et al. Reference Halonen, Clerc, Goward, Brodo and Wulff1998, Reference Halonen, Myllus, Ahti and Petrova1999; Herrera-Campos et al. Reference Herrera-Campos, Clerc and Nash1998; Ohmura Reference Ohmura2001; Seymour et al. Reference Seymour, Crittenden, Wirtz, Øvstedal, Dyer and Lumbsch2007; Tõrra & Randlane Reference Tõrra and Randlane2007; Randlane et al. Reference Randlane, Tõrra, Saag and Saag2009). The main difficulty lies in the great morphological and chemical variability of many species. For instance, the occurrence of five or even six different chemotypes within one species (e.g. in U. cornuta, U. fulvoreagens and U. wasmuthii) is not unusual (Randlane et al. Reference Randlane, Tõrra, Saag and Saag2009).
In Europe, the group of shrubby sorediate Usnea species (including e.g. U. diplotypus, U. fulvoreagens, U. glabrescens, U. lapponica, U. silesiaca, U. substerilis, U. wasmuthii) is one of the most confusing complexes for identification. However, many of these taxa are rather common macrolichens in many regions and they often grow together in dense communities. The less abundant species are often overlooked in the field, as they cannot be separated from abundant species by clear and easily recognized morphological characters. Some of these taxa might serve as indicators of forest ecosystems with high conservation value, as they are sensitive to certain environmental factors (e.g. stable high concentration of SO2) and are assumed to be influenced also by forest stand characteristics (e.g. the age of substratum/forest community, management of the forest, fragmentation of the habitat) which affect the conservation value of forests (Peck & McCune Reference Peck and McCune1997; Will-Wolf et al. Reference Will-Wolf, Esseen, Neitlich, Nimis, Scheidegger and Wolseley2002; Keon & Muir Reference Keon and Muir2002). Thus the development of additional procedures to delimit and identify Usnea species is essential for both systematics and conservation.
The phylogenetic position of the genus Usnea within Parmeliaceae has been briefly touched on in family surveys (Crespo et al. Reference Crespo, Lumbsch, Mattsson, Blanco, Divakar, Articus, Wiklund, Bawingan and Wedin2007, Reference Crespo, Kauff, Divakar, del Prado, Pérez-Ortega, Amo de Paz, Ferencova, Blanco, Roca-Valiente and Núñez-Zapata2010). Numerous segregations, typically including more than one genus, have been delimited in the family, for example alectoroid, cetrarioid, hypogymnioid and parmelioid clades. The genus Usnea, on the other hand, forms a separate clade alone in these analyses. The closest relative of Usnea in the Parmeliaceae has not been established with confidence, since the sister-group relationship with the parmelioid clade lacks support (Crespo et al. Reference Crespo, Kauff, Divakar, del Prado, Pérez-Ortega, Amo de Paz, Ferencova, Blanco, Roca-Valiente and Núñez-Zapata2010).
Few phylogenetic analyses based on DNA sequence data have so far been performed within the genus Usnea. Articus et al. (Reference Articus, Mattsson, Tibell, Grube and Wedin2002) demonstrated that specimens of two well-known and easily distinguished species, the fertile U. florida and the mostly sterile, sorediate-isidiate U. subfloridana, form one monophyletic clade of intermixed samples, and suggested that they be treated as conspecific under the name U. florida. However, this proposal has not been generally accepted in taxonomic publications and databases (Catalogue of Life, http://www.catalogueoflife.org; Index Fungorum, http://www.indexfungorum.org; LIAS, http://www.lias.net). Ohmura (Reference Ohmura2002) confirmed the monophyly of subgenera Dolichousnea and Eumitria, while the subgenus Usnea was weakly supported. Articus (Reference Articus2004) raised the subgenera to generic status and also accepted Neuropogon as a separate genus. Further molecular studies on Neuropogon species led to the synonymization of Neuropogon with Usnea (Ohmura & Kanda Reference Ohmura and Kanda2004; Wirtz et al. Reference Wirtz, Printzen, Sancho and Lumbsch2006) while the species boundaries in the species complex of neuropogonoid taxa were reconsidered (Seymour et al. Reference Seymour, Crittenden, Wirtz, Øvstedal, Dyer and Lumbsch2007; Wirtz et al. Reference Wirtz, Printzen and Lumbsch2008). Phylogenetic analyses of Usnea rubicunda and U. rubrotincta supported the separation of these two taxa, which can also be recognized by morphological characters (Ohmura Reference Ohmura2008).
The delimitation of species in lichenized fungi is still troublesome. Two main issues are in focus: 1) the presence of cryptic species, that is two or more independent lineages exhibiting similar morphology; and 2) the phylogenetic status of so-called ‘species pairs’, taxa with similar morphology but showing different reproductive modes (Crespo & Pérez-Ortega Reference Crespo and Pérez-Ortega2009). In both cases, phylogenetic and morphological data appear to be poorly correlated. This may also be the case in Usnea.
In this study we focus on European species of Usnea section Usnea with sorediate shrubby thalli, a group where the distinction between the species is difficult using traditional characters of morphology and secondary chemistry. The purpose of the study is to evaluate the morphological and chemical separation of species in the light of molecular data, including a number of widely distributed taxa such as U. diplotypus, U. fulvoreagens, U. glabrescens, U. lapponica, U. subfloridana, U. substerilis and U. wasmuthii using molecular phylogenetic analysis.
Material and Methods
Taxon sampling, morphology and chemistry
Altogether 93 specimens of 22 Usnea species were included in this study (Table 1). Sixty-two newly collected and sequenced specimens, mainly from various parts of Europe, represent 20 species of Usnea (Appendix 1), among which the sorediate taxa from the section Usnea (U. diplotypus, U. fulvoreagens, U. glabrescens, U. lapponica, U. subfloridana, U. substerilis and U. wasmuthii) form our focal group. Species from the section Ceratinae (Motyka) Y. Ohmura were included to examine their relationships to the focal taxa and to function as an extended outgroup. Taxon sampling was made difficult by the scarce availability of fresh material (e.g. for U. glabrata and U. silesiaca) and high rates of (asymptomatic) fungal parasite infection in some taxa. Additional sequences of 12 species including the outgroup were downloaded from GenBank (http://www.ncbi.nlm.nih.gov) (Appendix 1). Usnea diffracta was selected as the outgroup. This taxon belongs to the subgenus Dolichousnea while all species of the ingroup belong to the subgenus Usnea. The two subgenera appear as sister-groups in an earlier study (Ohmura & Kanda Reference Ohmura and Kanda2004). Newly collected material was determined using species delimitations based on morphological and chemical characters that are described in Randlane et al. (Reference Randlane, Tõrra, Saag and Saag2009). The content of secondary metabolites was studied in all newly collected specimens by means of TLC using solvent system A (Orange et al. Reference Orange, James and White2001).
Table 1. The species and number of specimens included in this study

DNA extraction and PCR amplification
The thalli were carefully examined under a stereomicroscope for possible fungal infection. As a rule, only pieces of the central axis separated from medulla and cortex were used for DNA extraction. In a few cases, cortex and medulla were not completely removed. The samples were ground in 2 ml microtubes with 2–4 three mm stainless steel beads using a bead mill (Mixer Mill MM 400, Retsch).
Subsequently total genomic DNA was extracted using High Pure PCR Template Preparation Kit (Roche) according to the manufacturer's instructions with an extra phase separation step using chloroform. Undiluted genomic DNA solution from extraction was used for PCR amplifications of the nuITS rDNA (ITS) and the partial beta-tubulin gene (Bt). The following primers were used: ITS1F (Gardes & Bruns Reference Gardes and Bruns1993), ITS4 (White et al. Reference White, Bruns, Lee, Taylor, Innis, Gelfand, Sninsky and White1990), Bt2a and Bt2b (Glass & Donaldson Reference Glass and Donaldson1995). The PCR mix consisted of 12·5 µl PCR Master Mix 2x (Fermentas), containing 0·05 u µl−1 Taq DNA Polymerase, 4 mM MgCl2, 0·4 mM of each dNTP and reaction buffer; 12·5 pmol of both primers (in 2 µl of water), and 8·5 µl of template (total volume 25 µl). The amplifications were carried out in an automatic thermocycler (Tpersonal 48, Biometra) using the following parameters: initial denaturation at 95°C for 3 min; 30 cycles of 95°C for 1 min, 53°C for 1 min and 72°C for 1 min, followed by final elongation step at 72°C for 7 min. The PCR products were visualized on 0·7% agarose gels stained with ethidium bromide and purified via SAP/EXO treatment (Shrimp Alkaline Phosphatase and Exonuclease I, Fermentas). The same primers were used for sequencing and PCR amplification; both strands of DNA were sequenced. BigDye Terminator v3.1 Ready Reaction Cycle Sequencing Kit (Applied Biosystems) was utilized for cycle sequencing with 30 cycles of 95°C for 30 s, 53°C for 15 s and 60°C for 4 min. The sequences were run on ABI 3730xl DNA Analyzer (Applied Biosystems). The sequencing procedures were carried out by the DNA Genotyping and Sequencing Core Facility of the Estonian Biocentre and Institute of Molecular and Cell Biology at the University of Tartu (Estonia). The sequence traces were observed in 4Peaks (mekentosj.com). In some cases, if the sequences of the two strands were not fully complementary, such bases were inspected carefully and usually replaced with ambiguity codes. All sequences were checked using GenBank BLAST. The best matches, regardless of taxon names, were downloaded.
Sequence alignments and phylogenetic analyses
The ITS and Bt regions were aligned separately using the software MAFFT 6.717 with the E-INS-i algorithm and 1000 iterative refinement cycles (Katoh & Toh Reference Katoh and Toh2008; Katoh et al. Reference Katoh, Asimenos, Toh and Posada2009) and MacClade 4.08 (Maddison & Maddison Reference Maddison and Maddison2000). The alignments were adjusted manually because some sequences had SSU introns before the ITS region. These introns were removed from the matrix, as well as seven ambiguously aligned regions, which were delimited by Gblocks (Castresana Reference Castresana2000) – 6 regions in ITS and one in the non-coding part of Bt. Each of these regions was converted into one numeric character, employing the software INAASE 2.3b (Lutzoni et al. Reference Lutzoni, Wagner, Reeb and Zoller2000). After these manipulations the ITS sequence matrix contained 549 and beta-tubulin matrix 369 nucleotide positions.
The recombination detection program RDP (Martin et al. Reference Martin, Posada, Crandall and Williamson2005b) was used to scan for possible recombination events in all matrices. The following methods available in this package were employed: RDP (Martin & Rybicki Reference Martin and Rybicki2000), GENECONV (Padidam et al. Reference Padidam, Sawyer and Fauquet1999), Chimaera (Posada & Crandall Reference Posada and Crandall2001), Maxchi (Maynard Smith Reference Maynard Smith1992), Bootscan (Maynard Smith Reference Maynard Smith1992; Martin et al. Reference Martin, Posada, Crandall and Williamson2005a), SiSscan (Gibbs et al. Reference Gibbs, Armstrong and Gibbs2000), PhylPro (Weiller Reference Weiller1998) and 3Seq (Boni et al. Reference Boni, Posada and Feldman2007).
For phylogenetic inference, we used methods from two different inference paradigms. First, we followed the Bayesian approach (B/MCMC) that efficiently handles complex nucleotide substitution models in a parametric statistical framework (Larget & Simon Reference Larget and Simon1999; Huelsenbeck & Ronquist Reference Huelsenbeck and Ronquist2001) and includes estimation of uncertainty (Huelsenbeck et al. Reference Huelsenbeck, Rannala and Masly2000). We also performed maximum parsimony analyses (MP), including nonparametric bootstrapping. Bayesian support values can sometimes be overestimates, especially when the tree branches are short. In contrast, bootstrap values can be viewed as lower bounds of support values (Douady et al. Reference Douady, Delsuc, Boucher, Doolittle and Douzery2003). We considered the clades with bootstrap support ≥ 70% in MP and posterior probabilities ≥ 95% as strongly supported. The phylogenetic trees were visualized using the program FigTree v1.3.1 (Rambaut Reference Rambaut2009).
Bayesian analyses and congruence of datasets
The Bayesian analyses (B/MCMC) were performed using the parallel version of MrBayes 3.1.2 (Ronquist & Huelsenbeck Reference Ronquist and Huelsenbeck2003). Independent (unlinked) evolution models were assumed for each functional DNA region and the matrix was partitioned accordingly: ITS was divided into a short end portion of SSU, ITS1, 5.8 S and ITS2 regions; and Bt into non-coding and coding regions, which in turn were analyzed by codon position. The models were selected using standard AIC (Akaike Information Criterion) in MrModeltest 2.3 (Nylander Reference Nylander2004) and corresponding model form settings were applied in MrBayes. The partitions and selected models were as follows: the end of SSU – F81; ITS1 – GTR+G; 5.8 S – K80; ITS2 – SYM+G; Bt coding – K80+I+G independently for the three codon positions; Bt non-coding – K80+I.
The numeric characters derived from the ambiguously aligned regions were weighted equal to the corresponding region length (2–4 bp). The step matrices calculated by INAASE were discarded, as they cannot be used in MrBayes. The gaps were also coded as standard characters via simple indel coding (Simmons & Ochoterena Reference Simmons and Ochoterena2000) using the software SeqState (Müller Reference Müller2005, Reference Müller2006). These numeric data were analyzed as a separate partition with the default model for standard characters [among-site rates: equal; state frequencies fixed (equal)].
The ITS and Bt regions were first analyzed separately. Together with the sequences downloaded from GenBank, the full ITS matrix contained sequences of 93 specimens representing 22 Usnea species (see Table 1 and Appendix 1), and included 549 nucleotide positions plus numeric characters for 6 ambiguously aligned regions. The Bt matrix included 59 sequences together with those from GenBank, 369 nucleotide positions and a numeric character for one ambiguous region. To assess the congruence of the datasets, a reduced ITS matrix was analyzed, containing only the 59 specimens that were represented also by a Bt sequence.
In all analyses, the MrBayes default priors were used except for the partition specific rates (ratepr) that were set to ‘variable’ (flat Dirichlet). Two simultaneous B/MCMC analyses were run for 10 million generations, both with four chains (3 heated by temp = 0·09) and starting from random trees. Trees were sampled every 200 generations. The initial 4 million generations were discarded as burn-in from both runs and for the remaining 60 002 trees the majority-rule consensus tree with average branch lengths was calculated using the sumt option of MrBayes. The average standard deviation of split frequencies between simultaneous runs was 0·005 in ITS and 0·004 in the combined analysis; PSRF values all equalled 1·0 in ITS analysis; in the combined analysis, PSRF values for all taxon bipartitions and most model parameters were also 1·0 (1·1 for one and 1·2 for two parameters).
The consensus trees of the compatible single gene analyses were examined for conflicts. No significant conflicts above 0·95 posterior probability level were observed. The matrices were combined; the resulting dataset contained records of 59 specimens representing 18 taxa, and consisted of 918 nucleotide positions plus numeric characters for 7 ambiguous regions. The combined dataset was analyzed with the previously used settings except for the temperature of the heated chains, which was set to 0·07.
Maximum parsimony analyses
The full ITS dataset (93 specimens) and the combined dataset were analyzed by means of maximum parsimony (MP) employing PAUP* 4.0 (Swofford Reference Swofford2002). Nonparametric bootstrap support (Felsenstein Reference Felsenstein1985) for each clade was estimated based on 850 (ITS dataset) or 1000 replicates (combined dataset), using the heuristic search option with 10 random sequence additions, TBR branch swapping and MulTrees option in effect. The INAASE characters in the end of the matrix were weighed equal to corresponding region length (2–4 bp) and gaps were treated as fifth state.
Hypothesis testing
We also employed the Shimodaira-Hasegawa (SH) test (Shimodaira & Hasegawa Reference Shimodaira and Hasegawa1999) and expected likelihood weight (ELW) test (Strimmer & Rambaut Reference Strimmer and Rambaut2002), implemented in TreePuzzle 5.2 (Schmidt et al. Reference Schmidt, Strimmer, Vingron and von Haeseler2002), to test for four topological hypotheses in the maximum likelihood framework (ML). The model parameters for unpartitioned datasets (ITS and combined) were selected using standard AIC in MrModeltest 2.3 (Nylander Reference Nylander2004) because the available ML software cannot apply mixed models (SYM+G best for both datasets, GTR+G with the parameter values estimated by MrModeltest used in TreePuzzle). The most-likely ML trees for the ITS and combined datasets were obtained in PAUP* 4.0 (Swofford Reference Swofford2002), as well as the best constrained trees with four different alternative topologies. The information from ambiguously aligned regions was not used and gaps were treated as missing data. The SH and ELW tests were then conducted, testing the most-likely trees together with the alternative topologies with respect to the group in question, to see if the topological hypothesis could be rejected at the 5% confidence level.
The monophyly hypotheses were tested on both datasets for the following taxa: 1) U. diplotypus; 2) U. substerilis; 3) U. glabrescens; 4) U. florida together with U. subfloridana (testing if they form one or more intermixed clades together); 5) U. intermedia together with U. lapponica (testing if they form a monophyletic clade together).
Results
Medullary chemistry
Several new chemotypes of Usnea species were discovered during this study: 1) for U. cornuta (specimen nos 01 and 02 in Appendix 1) a chemotype with thamnolic acid; 2) for U. florida (specimen no. 02) a chemotype with an unknown compound (Rf class 2–3 in A, dark spot in UV 254, dark blue in UV 366, dark yellow after charring with sulphuric acid, brown in UV 366 after acid treatment); 3) for U. glabrata a chemotype with thamnolic acid; 4) for U. subfloridana a chemotype with the same unknown compound as in 2 above (specimen nos 01 and 05). The thamnolic chemotype of U. cornuta is new for Europe (Randlane et al. Reference Randlane, Tõrra, Saag and Saag2009), while in the Pacific Northwest area of North America a rare U. cornuta chemotype with thamnolic and protocetraric acids had been recorded earlier (McCune & Geiser Reference McCune and Geiser2009).
DNA sequences
We obtained original ITS sequences from 62 specimens and Bt sequences from 42 specimens. No credible recombination events were detected within or between loci. Accordingly, we present the results of the phylogenetic analyses that are based on the full ITS dataset and on the combined dataset.
Phylogenetic inference based on ITS dataset
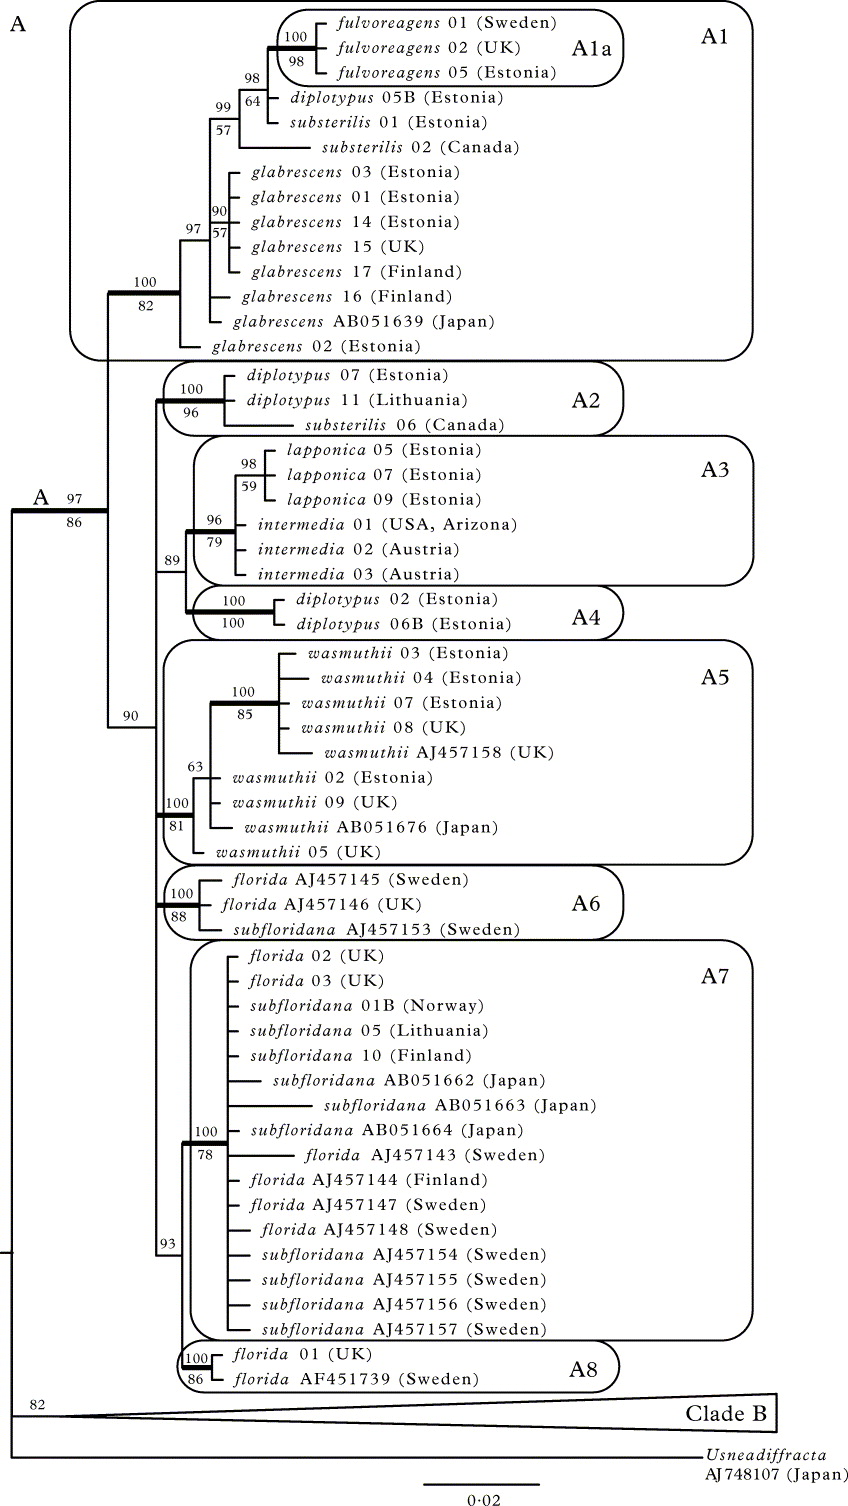
The B/MCMC consensus tree, together with the maximum parsimony nonparametric bootstrap support values based on the full ITS dataset, are shown in Figure 1. The tree can be divided into two parts: the well supported clade A (Fig. 1A; corresponding to section Usnea; PP = 97%; bootstrap 86%) with short branch lengths comprising U. fulvoreagens, U. glabrescens, U. diplotypus, U. substerilis, U. intermedia together with U. lapponica, U. wasmuthii, and U. florida together with U. subfloridana. The rest of the ingroup species are located in the poorly supported clade B (corresponding to section Ceratinae), where the branches are much longer. Clade A is in turn divided into two. First, a well supported clade A1 (PP = 100%; bootstrap 82%) comprises all U. glabrescens and U. fulvoreagens specimens plus one U. diplotypus and two U. substerilis samples. Usnea fulvoreagens forms the only monophyletic sub-group (clade A1a; PP = 100%; bootstrap 98%) inside the clade A1. The second clade (PP = 90%; no bootstrap support) contains several subclades (A2–A8) with unresolved relationships to each other. Usnea diplotypus forms two separate highly supported groups, A2 (PP = 100%; bootstrap 96%) and A4 (PP = 100%; bootstrap 100%). However, A2 additionally includes a specimen of U. substerilis, and one sample of U. diplotypus is located in clade A1. Fertile U. intermedia and sorediate U. lapponica are united in a monophyletic clade (A3; PP = 96%; bootstrap 79%). Usnea wasmuthii is monophyletic (clade A5; PP = 100%; bootstrap 81%). Usnea florida and U. subfloridana together form three monophyletic intermixed clades: the small A6 (PP = 100%; bootstrap 88%) and the large one (with low support) comprising A7 (PP = 100%; bootstrap 78%) and A8 (PP = 100%; bootstrap 86%).


Fig. 1.
A 50% majority-rule consensus tree from Bayesian MCMC analysis based on nuITS; A, clade A; B, clade B. Bayesian posterior probabilities are indicated above branches and maximum parsimony nonparametric bootstrap support values below branches. Clades with bootstrap support ≥ 70% in MP and posterior probabilities ≥ 95% are considered strongly supported (thick branches). Scale bar shows the number of changes per site.
In the second part of the tree (clade B; Fig. 1B), the higher-level clades lack bootstrap support and their PPs are mostly low. The following lower level monophyletic groups can be distinguished (PP = 100%; bootstrap 100% if not stated otherwise): U. rubicunda together with U. rubrotincta (clade B1; bootstrap 63%); U. dasaea (clade B2; bootstrap 85%); U. cf. cornuta (clade B3); U. mutabilis (clade B4); U. fragilescens (clade B5); U. articulata (clade B6); U. esperantiana (clade B7); U. flammea (clade B8; bootstrap 99%); U. hirta (clade B9; bootstrap 98%); U. flavocardia (clade B10).
Phylogenetic inference based on the combined dataset
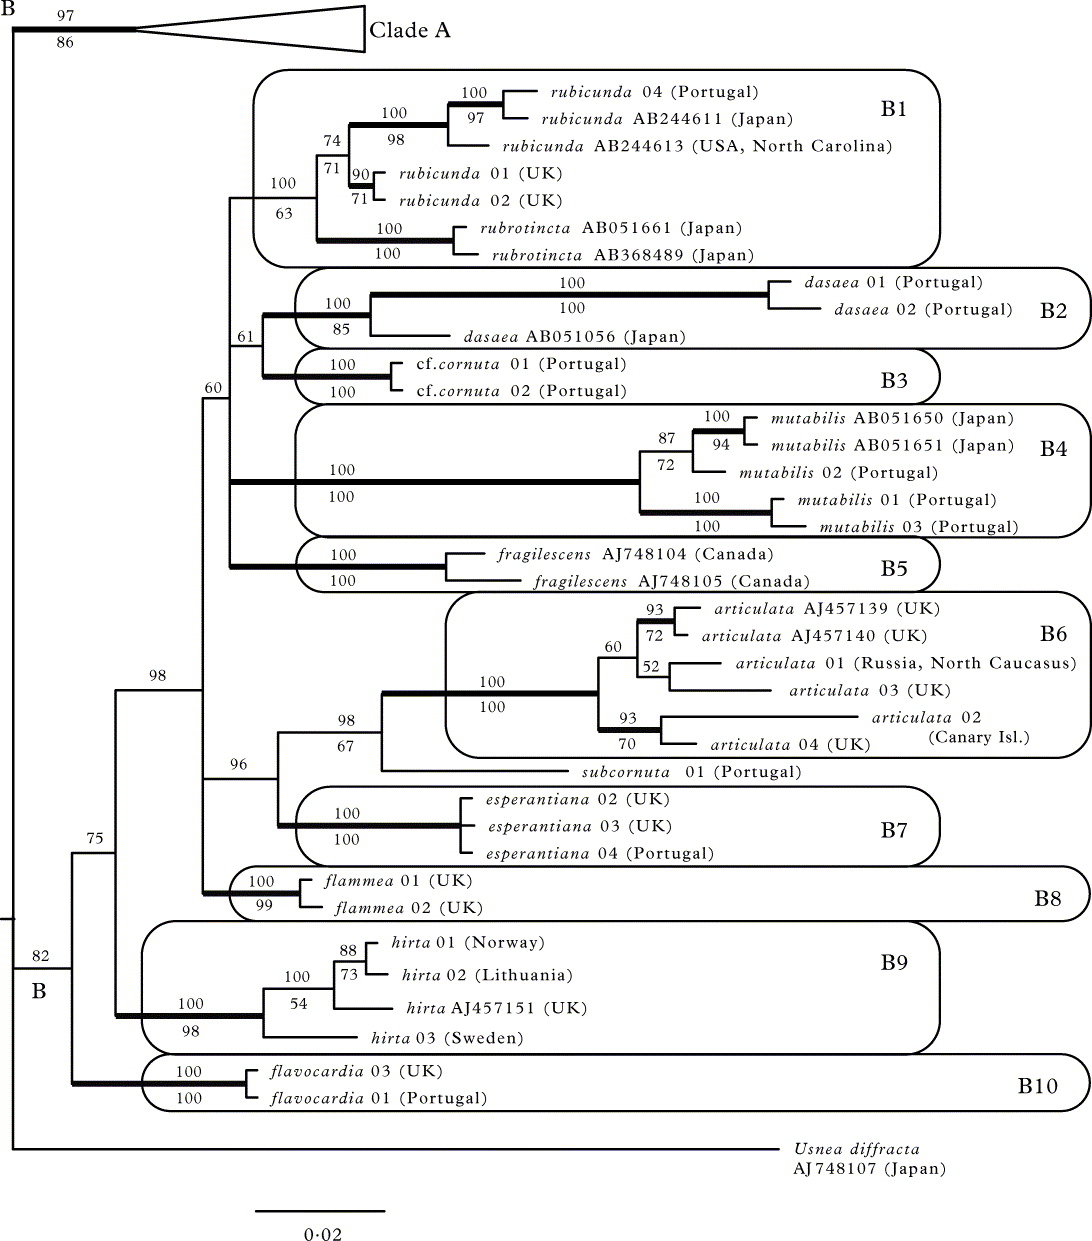
The B/MCMC consensus tree together with the maximum parsimony nonparametric bootstrap support values based on the ITS and Bt combined dataset are shown in Figure 2. The structure of the tree is generally similar to the one based on ITS only. Clade A (i.e. section Usnea) with short branches is clearly distinguishable in the tree (PP = 100%; bootstrap 100%). The rest of the ingroup is poorly supported at higher level and the branches are much longer there (clades B2, B4–B6, B9 and B10). Usnea fulvoreagens is monophyletic (clade A1a; PP = 100%; bootstrap 100%) and forms the clade A1 (PP = 100%; bootstrap 89%) together with the also monophyletic U. glabrescens (clade A1b; PP = 100%; bootstrap 84%) and a subset of the U. substerilis and U. diplotypus specimens. Usnea diplotypus additionally forms two highly supported small clades, A2 and A4 (both PP = 100%; bootstrap 100% and 99% respectively), the latter with an U. substerilis specimen. Usnea wasmuthii appears monophyletic (clade A5; PP = 97% but bootstrap 54%). Usnea florida and U. subfloridana together form two separate monophyletic clades: A6 (PP = 100%; bootstrap 82%) and A7–8 (PP = 100%; bootstrap 81%). Usnea intermedia and U. lapponica are also united in a monophyletic clade (A3; PP = 69%; bootstrap 93%), but it has low posterior probability.
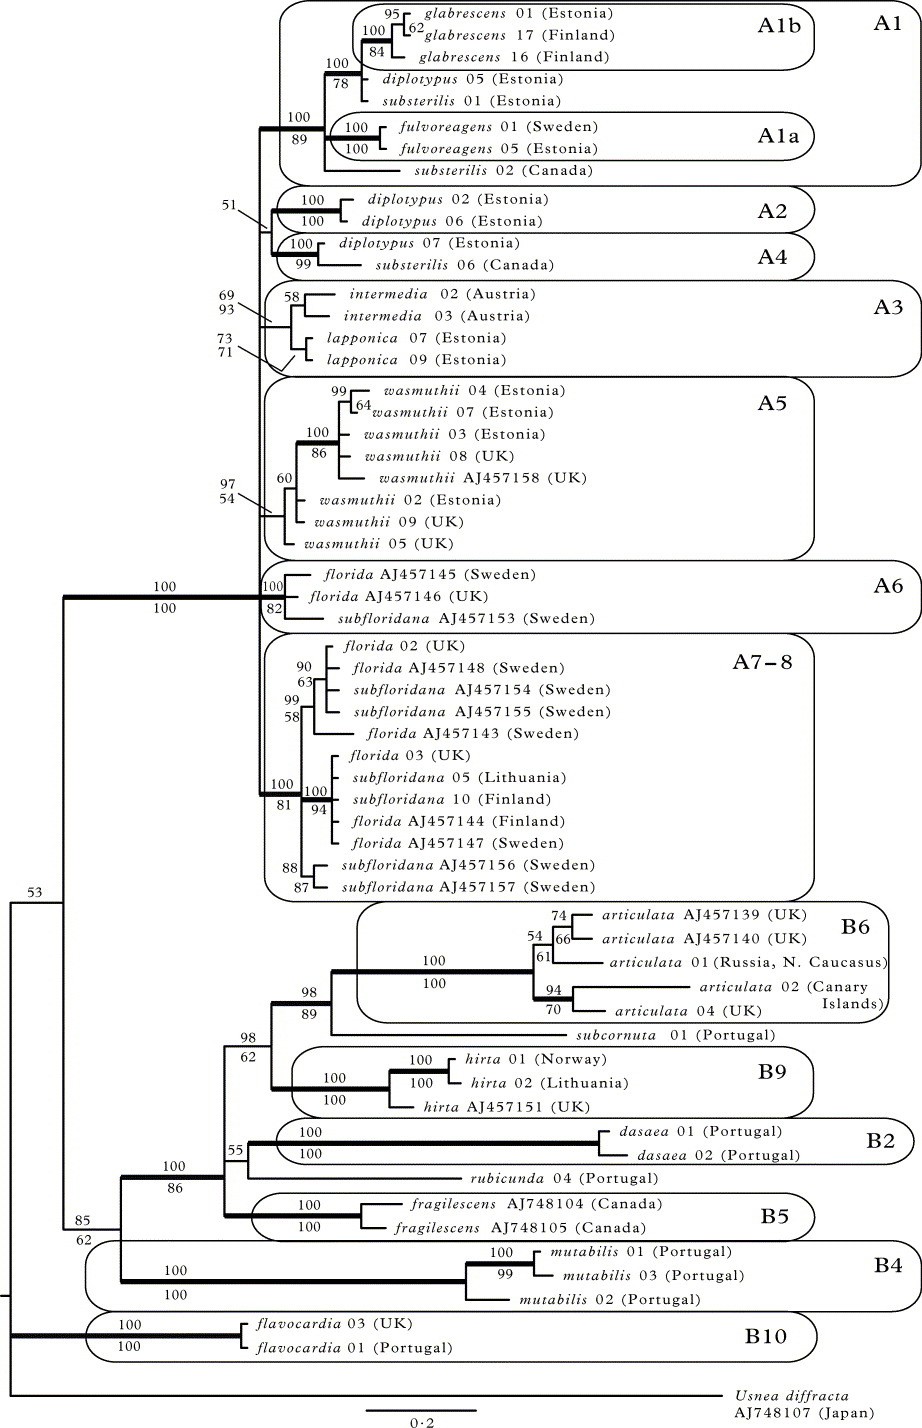
Fig. 2. A 50% majority-rule consensus tree from the Bayesian MCMC analysis based on the combined nuITS and beta-tubulin dataset. Bayesian posterior probabilities are indicated above branches and the maximum parsimony nonparametric bootstrap support values below branches. Clades with bootstrap support ≥ 70% in MP and posterior probabilities ≥ 95% are considered strongly supported (thick branches). Scale bar shows the number of changes per site. For the records obtained from GenBank, only ITS sequence accession codes are shown. Clade labels follow Fig. 1.
In the second part of the tree (i.e. section Ceratinae) the following monophyletic groups can be distinguished (all PP = 100%; bootstrap 100%): U. dasaea (B2), U. fragilescens (B5), U. articulata (B6), U. hirta (B9) and U. flavocardia (B10). The latter clade, however, is no longer included in clade B.
Hypothesis testing
We additionally executed the ML based SH and ELW tests on our data. According to the tests, U. diplotypus and U. substerilis are both polyphyletic (monophyly rejected by both tests: SH P <0·03 and ELW P <0·001 in ITS and combined datasets); U. florida together with U. subfloridana may or may not form more than one intermixed clade (one intermixed clade hypothesis rejected by ELW test in ITS only); the monophyly of U. glabrescens and the question of conspecificity of U. intermedia and U. lapponica are left undecided (neither hypothesis rejected in ITS nor combined dataset).
Discussion
This study is based on the sequences of the nuclear rDNA ITS region and the gene coding for beta-tubulin. Bayesian and maximum parsimony phylogenetic inferences showed that 1) most taxa that are morphologically well distinguished (subclades in clade B, i.e. section Ceratinae) also appear distinct in our DNA study, and 2) most of the shrubby Usnea species that are often difficult to determine by traditional characters (subclades in clade A, i.e. section Usnea), form a group of closely related (possibly recently diverged) but still distinct species.
The following species have conspicuous morphological character(s) and are also supported as distinct phylogenetic entities in our analyses: U. articulata (with inflated sausage-like segments in older parts of the thallus as the most characteristic feature), U. flavocardia (with yellow axis and inner part of the medulla), U. mutabilis (with wine red medulla), and U. rubicunda together with U. rubrotincta (both with reddish brown thallus or grey thallus with red-brown flecks). Ohmura (Reference Ohmura2008) has studied the molecular phylogeny of the two latter species and concluded that these are separate monophyletic species on the basis of ITS rDNA and thallus characters. Our results do not contradict this view. The species belonging to the U. fragilescens aggregate (Clerc Reference Clerc1987a), U. cornuta, U. dasaea, U. esperantiana, U. flammea, and U. fragilescens, appear monophyletic in our trees.
In the focal group of this study (clade A), among species with shrubby thalli and widely variable but subtle characters of soredia, branches in the phylogenetic trees are much shorter than in clade B. Usnea wasmuthii is an example of a species without conspicuous diagnostic morphological characters (with oblong-cylindrical soralia and presence of barbatic acid in typical specimens), which is still molecularly clearly monophyletic.
The U. florida – U. subfloridana complex is divided into two or three intermixed groups with high support in the Bayesian and parsimony phylogenetic trees. However, considering the ML hypothesis tests, the possibility of monophyly of this species pair together cannot be ruled out. Articus et al. (Reference Articus, Mattsson, Tibell, Grube and Wedin2002) has previously shown two strongly supported intermixed groups in a weakly supported clade of these two taxa. Usnea florida and U. subfloridana are not distinct as two separate lineages in the gene trees but the actual number of phylogenetic taxa should be unravelled by further studies.
Fertile U. intermedia together with sorediate U. lapponica form another species pair in the section Usnea (clade A). Halonen et al. (Reference Halonen, Clerc, Goward, Brodo and Wulff1998) have suggested that U. diplotypus, U. lapponica or U. substerilis could be the sterile counterparts of the U. intermedia agg., another richly fertile Usnea species in Europe besides U. florida. In our analyses, the two species U. intermedia and U. lapponica, form a monophyletic clade (A3) that is well supported in the ITS phylogenetic tree (the sequences differ only by one nucleotide). However, the Bt sequences are more variable and the Bayesian PP of the clade is low in the combined dataset tree (inside this clade, the division between the species is not well supported either). Neither the monophyletic nor polyphyletic tree topology is rejected by the ML hypothesis tests. Usnea intermedia and U. lapponica are morphologically easily distinguished due to the presence/absence of apothecia and soredia. However, the shape of branches and the secondary chemistry of these taxa are similar and their geographical ranges in Europe greatly overlap (Randlane et al. Reference Randlane, Tõrra, Saag and Saag2009).
Usnea glabrescens and U. fulvoreagens form a highly supported clade together with a few specimens of U. diplotypus and U. substerilis, all four morphospecies representing shrubby sorediate taxa. Usnea fulvoreagens is monophyletic, while U. glabrescens is paraphyletic in the ITS tree. At the same time, the monophyly of U. glabrescens cannot be rejected according to ML hypothesis tests. In the combined dataset tree, U. glabrescens forms a monophyletic clade; however, only three specimens were included in that analysis. We consider it likely that U. glabrescens constitutes one distinct species but more sequences from different DNA markers are needed to clarify the situation.
Usnea diplotypus and U. substerilis are both polyphyletic and appear together in two clades. The situation is confusing from a morphological as well as a DNA data aspect. It has been suggested earlier that U. diplotypus is similar to U. substerilis, as well as to U. lapponica, in respect of morphology and chemistry (Randlane et al. Reference Randlane, Tõrra, Saag and Saag2009).
It has been proposed that non-monophyly in gene phylogenies does not necessarily mean non-existence of the species concerned, especially if speciation is recent, and can be caused by, for example, incomplete lineage sorting (Grube & Kroken Reference Grube and Kroken2000; Taylor et al. Reference Taylor, Jacobson, Kroken, Kasuga, Geiser, Hibbett and Fisher2000; Funk & Omland Reference Funk and Omland2003; Knowles & Carstens Reference Knowles and Carstens2007). At present we avoid making taxonomic decisions on the taxa that appear para- or polyphyletic in our phylogenetic trees.
In most cases, the ITS and Bt sequence data are in good concordance with species delimitations based on morphology and chemistry. It has been suggested that Bt may not be best suited for phylogenetic studies, as paralogous copies of this gene are known to exist in Ascomycetes (Landvik et al. Reference Landvik, Eriksson and Berbee2001; Aguileta et al. Reference Aguileta, Marthey, Chiapello, Lebrun, Rodolphe, Fournier, Gendrault-Jacquemard and Giraud2008). However, the presence of paralogs has not been studied in Usnea and we found no evidence of paralogy in this study. In light of the molecular data, we assert that morphological characters may provide a better basis for species identification in Usnea than secondary chemistry, as many species appear to be chemically heterogenous.
We are indebted to S. Ekman, A. Crespo, P. K. Divakar and two anonymous referees for their useful advice and comments while preparing this publication. K. Mark is thanked for assistance with laboratory work. We also acknowledge T. Feuerer. L. Marmor, S. Sirp and G. Urbanavichus for collecting fresh material of some Usnea species for us. The study was financially supported by the Estonian Science Foundation (grants JD173 and 7470); Norwegian Financial Mechanisms and EEA Financial Mechanisms (grant EMP9); Project Ge Di Li, Sciex Fellowhip 10.005; and the European Union through the European Regional Development Fund (Center of Excellence FIBIR). R. Del-Prado was financed by the Spanish Ministry of Science and Technology (CGL2010-21646/BOS).
Appendix 1. Details of Usnea specimens and GenBank accession numbers of ITS and Bt sequences analyzed in this study.