


1. INTRODUCTION
With the development of the new generation of Global Navigation Satellite Systems (GNSS), the Dual-frequency Constant Envelope Multiplexing (DCEM) technique is attracting increasing attention. DCEM combines signals at two adjacent central frequencies into a composite signal with a constant envelope. The significant advantage of DCEM is that it can reduce signal distortion and propagation time instability and reduce the number of required amplifiers (Lestarquit et al., Reference Lestarquit, Artaud and Issler2008). Dafesh and Cahn (Reference Dafesh and Cahn2009) proposed a Phase-Optimised Constant-Envelope Transmission (POCET) technique and extended it to the combination of GNSS signals at different carrier frequencies (Dafesh and Cahn, Reference Dafesh and Cahn2009; Reference Dafesh and Cahn2011). One well-known application of DCEM is the Galileo E5 signal design (OS SIS ICD, 2010). This signal plan includes four Binary Phase-Shift Keying (BPSK) signals located in two sidebands, E5a and E5b, where each sideband consists of two signals. To achieve the constant envelope transmission of these four signals, Alternative Binary Offset Carrier (AltBOC) (Lestarquit et al., Reference Lestarquit, Artaud and Issler2008) modulation has been proposed and employed. In addition, AltBOC is also employed as the baseline for B2 signal design for Beidou Phase III (United Nations, 2010). Numerous AltBOC-like techniques have been proposed to increase the flexibility of the power ratio or to reduce implementation complexity. Time Division AltBOC (TD-AltBOC) (Tang et al., Reference Tang, Zhou, Wei, Yan, Liu, Ran and Zhou2011) and Time-Multiplexed Off-Set Carrier Quadrature Phase Shift Keying (TMOC-QPSK) (Shivaramaiah et al., Reference Shivaramaiah, Dempster and Rizos2013) can achieve lower complexity than AltBOC using time-division technology. Generalised AltBOC (Zhang, Reference Zhang2013) extends AltBOC to applications with different powers in the two sidebands. The Asymmetric Constant Envelope Binary Offset Carrier (ACEBOC) (Yao and Lu, Reference Yao and Lu2012; Reference Yao and Lu2013) is a DCEM technique that allows for an arbitrary power ratio among the four signals, but the driving clock rate that is required for the baseband signal generator is increased. The General AltBOC (GAltBOC) technique (Yan et al., Reference Yan, Wei, Tang, Zhou and Xia2016) and ACEBOC with Equal length Subcarrier segments (ES-ACEBOC) (Yao et al., Reference Yao, Zhang and Lu2016) can achieve a flexible power ratio like ACEBOC while retaining the same driving clock rate as AltBOC, but their multiplexing efficiency is lower than that of generalised AltBOC and ACEBOC. The ACEBOC multiplexing technique with a Bipolar Subcarrier (BS-ACEBOC) (Guo et al., Reference Guo, Yao and Lu2016) can reduce the required driving clock rate to half that of AltBOC, albeit with a significant decrease in multiplexing efficiency.
The AltBOC and AltBOC-like techniques mentioned above require that each sideband consists of two or fewer signal components; this signal model is termed the AltBOC-like signal model. However, the need for a DCEM technique that is suitable for a more general dual-frequency signal model, such as one that can consider more than two signal components in one sideband, is urgent. For example, for a smooth system transition, it is necessary to simultaneously transmit three new signals with a central frequency of 1575.42 MHz and one inherited signal with a central frequency of 1561.098 MHz in the Beidou B1 band (Huang et al., Reference Huang, Zhu, Tang, Gong and Ou2015). The Generalised Constant Envelope Binary Offset Carrier (GCE-BOC) technique (Huang et al., Reference Huang, Zhu, Tang, Gong and Ou2015) is a candidate for addressing such a general dual-frequency signal model, but it has a strict requirement concerning the driving clock rate of the signal generator, and its multiplexing efficiency could be improved.
In this paper, we propose a phase-aligned DCEM technique for a general dual-frequency signal model. It can be used to combine two constant envelope signals at two different frequencies into a composite signal with a constant envelope. The proposed method is not subject to any restrictions on the number of signal components, the power ratio or the phase relationship among the components, and there is also no special constraint on the driving clock rate for the signal generator based on the proposed Lookup Table (LUT) implementation.
The remainder of this paper is organised as follows. Section 2 presents the general dual-frequency signal model and the underlying principle of the proposed method. Section 3 investigates a phase LUT-based implementation of the proposed method. Section 4 analyses the application for the AltBOC-like signal model. Section 5 presents an application for a general dual-frequency signal model in the Beidou B1 band. Finally, conclusions are drawn in Section 6.
2. DESCRIPTION OF THE PROPOSED METHOD
2.1. The General Dual-frequency Signal Model and the Linearly Combined Composite Signal
Consider the following situation: There are N signals s1(t), s2(t), …, sN(t) to be multiplexed and transmitted at a carrier frequency f 0. They can be expressed as
 $$s_n \!\lpar t \rpar =\sqrt {P_n} d_n \!\lpar t \rpar \sum\limits_{i=-\infty}^{+\infty} {c_n \!\lpar i \rpar p_n \!\lpar {t-iT_{c_i}} \rpar }$$
where P n is the power of the nth signal, d n(t) denotes the navigation message data for the data component or the secondary code for the pilot component, c n is the spreading code, whose chip duration is  $T_{c_n}$ and p n(t) is the chip waveform, which is generally a binary waveform in a GNSS signal. Note that d n(t) and c n take binary values of +1 or −1. Thus, s n(t) is a binary level signal. Without loss of generality, assuming that there are L signals s1(t), s2(t), …, sL(t) in the lower sideband with a centre frequency of f 0−f sc, the remaining N−L signals sL+1(t), sL+2(t), …, sN(t) are located in the upper sideband with a centre frequency of f 0+f sc.
First, we combine the signals in each sideband using an arbitrary single-frequency multiplexing technique and obtain two constant envelope signals, which are equivalent to two Phase-Shift Keying (PSK)-modulated signals and can be expressed as
 $$S_l \lpar t \rpar = \sqrt{P_l} e^{j\theta_l \lpar t \rpar }, S_u \lpar t \rpar = \sqrt{P_u} e^{j\theta_u \lpar t \rpar }$$
where P l and P u are the powers in the lower and upper sidebands. θl (t) can take 2L possible values,  $\theta_{l1},\theta_{l2},\cdots,\theta_{l2^{L}}$ and
  $\theta_{u} \!\lpar t \rpar $ can take 2N−L possible values,
  $\theta_{u1},\theta_{u2},\cdots,\theta_{u2^{N-L}}$; these values are uniquely determined by the combination of signal chips in each sideband.
To transmit these two constant envelope signals through a common High-Power Amplifier (HPA), a natural approach is to modulate these two signals by their respective complex subcarriers and then add them together. This integrated signal is termed the linearly combined baseband signal and can be expressed as
 $$\matrix{S_{{\rm linear}} \!\lpar t \rpar =\sqrt {P_l} e^{\,j\!\lpar {-2\pi f_{sc} t+\theta_l \!\lpar t \rpar } \rpar } + \sqrt{P_u} e^{\,j\!\lpar {2\pi f_{sc} t+\theta_u \!\lpar t \rpar } \rpar } \cr =\sqrt {P_l} e^{\,j{\!\lpar {\theta_l \!\lpar t \rpar +\theta_u \!\lpar t \rpar } \rpar }/2}\!\lpar {e^{-j\!\lpar {2\pi f_{sc} t+{\!\lpar {\theta_u \!\lpar t \rpar -\theta_l \!\lpar t \rpar } \rpar } / 2} \rpar }+\alpha e^{\,j\!\lpar {2\pi f_{sc} t+{\!\lpar {\theta_u \!\lpar t \rpar -\theta_l \!\lpar t \rpar } \rpar } / 2} \rpar }} \rpar }$$
where  $\alpha =\sqrt {{P_{u}}/{P_{l}}}$. The cases of α=0 and α=+∞ correspond to single-frequency multiplexing. For clarity, only the case of 0<α<∞ is considered in the following derivation. Note that our focus is the power ratio between the two sidebands rather than the absolute power value; therefore, P l=1 is assumed in the following derivation.
The frequency difference f sc also denotes the complex subcarrier frequency. Note that θl (t) and θu (t) are constants during the least common subchip length of the signal components. Thus, the constellation diagram of S linear(t) is a series of ellipses for α≠1 or a series of line segments for α=1. Each combination of θl (t) and θu (t) corresponds to an ellipse or line segment. The period of each ellipse or line segment is T sc=1/f sc. An example for α=2 and θl (t), θu (t)∈ {(2i−1)π / 4}, with i=1, 2, 3 and 4, is shown in Figure 1, where only four possible ellipses are presented. Clearly, the envelope of S linear(t) is not constant.

Figure 1. The constellation diagram of the linearly combined baseband signal.
2.2. The Proposed Constant Envelope Multiplexing Technique
To obtain a constant envelope composite signal, a phase-aligned method is introduced. More precisely, the phase of the constant envelope composite signal is aligned with the phase of the linearly combined baseband signal S linear(t), but the amplitude is forced to be constant. Consequently, the constant envelope composite signal can be written as
 $$S_{{\rm CE}} \!\lpar t \rpar =e^{\,j\angle S_{{\rm linear}} \!\lpar t \rpar }$$
where  $\angle S_{{\rm linear}} \!\lpar t \rpar $ represents the angle of S linear(t), which is given by
 $$\angle S_{{\rm linear}} \!\lpar t \rpar = {\theta_l \!\lpar t \rpar +\theta_u \!\lpar t \rpar \over 2} + \hbox{atan}\ 2 \left[\matrix{\lpar {\alpha -1} \rpar \sin \!\left(2\pi f_{sc} t + {\theta_l \!\lpar t \rpar -\theta_u \!\lpar t \rpar \over 2} \right), \cr \lpar 1 + \alpha \rpar \cos \left(2\pi f_{sc} t + {\theta_u \!\lpar t \rpar - \theta_l \lpar t \rpar \over 2} \right)} \right]$$
where  $\hbox{atan}\,2\!\lpar \bullet\rpar $ is the four-quadrant arctangent function.
In fact, S CE(t) can be regarded as an amplitude modulation applied to  $S_{\rm linear}(t)$ and can be expressed as
 $$S_{\rm CE} \!\lpar t \rpar = {S_{{\rm linear}} \!\lpar t \rpar \over \vert S_{{\rm linear} \!\lpar t \rpar } \vert } = {e^{\,j\!\lpar {-2\pi f_{sc} t+\theta_l \!\lpar t \rpar } \rpar }+\alpha e^{\,j\!\lpar {2\pi f_{sc} t+\theta_u \!\lpar t \rpar } \rpar } \over \sqrt{1 + \alpha^2 + 2\alpha \cos \lpar 4\pi f_{sc} t + \theta_u \lpar t \rpar - \theta_l \lpar t \rpar \rpar}}$$
where |•| is the modulus operator.
Supposing that the least common subchip length of the signal components is T G, then θl(t) and θu(t) maintain constant values of θl(k) and θu(k), respectively, over any time interval t∈[kT G, (k+1)T G), and the constant envelope signal can be rewritten as
 $$\eqalign{S_{\rm CE} \!\lpar t \rpar &=\sum\limits_{k=-\infty}^{+\infty} {{e^{\,j\!\lpar {-2\pi f_{sc} t+\theta_l \!\lpar k \rpar } \rpar }+\alpha e^{\,j\!\lpar {2\pi f_{sc} t+\theta_u \!\lpar k \rpar } \rpar } \over \sqrt {1+\alpha ^2+2\alpha \cos \!\lpar {4\pi f_{sc} t+\theta_u \!\lpar k \rpar -\theta_l \!\lpar k \rpar } \rpar }}\Pi \!\lpar {t-kT_G} \rpar } \cr &=\sum\limits_{k=-\infty}^{+\infty} {\lpar {e^{\,j\!\lpar {-2\pi f_{sc} t+\theta_l \!\lpar k \rpar } \rpar }+\alpha e^{\,j\!\lpar {2\pi f_{sc} t+\theta_u \!\lpar k \rpar } \rpar }} \rpar \cdot \hbox{M}\!\left({t-{\theta_u \!\lpar k \rpar -\theta_l \!\lpar k \rpar \over 4\pi f_{sc}}} \right)\cdot \Pi \!\lpar {t-kT_G} \rpar }}$$
where M(t) is the modulation function and Π(t) is the rectangular function. These functions are defined as
 $$\hbox{M}\!\lpar t \rpar = {1 \over \sqrt{1+\alpha ^2+2\alpha \cos \!\lpar {4\pi f_{sc} t} \rpar }}$$
 $$\Pi \lpar t \rpar =\left\{\matrix{1,\hfill &0\le t \lt T_G \cr 0, \hfill &\hbox{otherwise}}\right.$$
By expanding M(t) as a Fourier series and using the delay characteristic, we can rewrite Equation (7) as follows:
 $$\eqalign{S_{\rm CE} \lpar t \rpar &=\sum\limits_{k=-\infty}^{+\infty} {\!\lpar {e^{\,j\!\lpar {-2\pi f_{sc} t + \theta_l \!\lpar k \rpar } \rpar } + \alpha e^{\,j\!\lpar {2\pi f_{sc} t + \theta_u \!\lpar k \rpar } \rpar }} \rpar \!\left({\sum\limits_{n=-\infty}^{+\infty} {a_n e^{\,jn\!\lpar {\theta_u \!\lpar k \rpar -\theta_l \!\lpar k \rpar } \rpar }e^{\,j4n\pi f_{sc} t}}} \right)\Pi \!\lpar {t-kT_G} \rpar } \cr &= \lpar {a_0 +a_{-1} \alpha} \rpar e^{\,j\!\lpar {-2\pi f_{sc} t+\theta_l \!\lpar t \rpar } \rpar }+\!\lpar {\alpha a_0 +a_1} \rpar e^{\,j\!\lpar {2\pi f_{sc} t+\theta_u \!\lpar t \rpar } \rpar }+\hbox{H}\!\lpar t \rpar }$$
where H(t) denotes the higher-order harmonic components of the constant envelope composite signal. The  $\lcub a_{k} \vert k=0,\pm 1,\pm 2,\cdots \rcub $ are the Fourier series coefficients of M(t) and can be calculated as
 $$a_k = {2 \over T_{sc}} \int_0^{T_{sc}/2} {e^{-jk4\pi f_{sc} t} \over \sqrt{1 + \alpha ^2 + 2\alpha \cos \lpar 4\pi f_{sc} t \rpar }}dt$$
A comparison of Equation (10) with Equation (3) reveals that to achieve a constant envelope, some undesired higher-order harmonic components are introduced. These higher-order harmonics will cause a loss of transmission power. In addition, the average correlation outputs of the constant envelope signal with respect to the replicas of the lower sideband signal are
 $$\eqalign{R_{{\rm CE},l} & = {1 \over T_p} \int\limits_0^{T_p} {S_{\rm CE} \!\lpar t \rpar \!\lpar {e^{\,j\!\lpar {{\rm-}2\pi f_{sc} t+\theta_l \!\lpar t \rpar } \rpar }} \rpar ^{\rm \ast}dt}\cr &= {1 \over T_p} \int_0^{T_p} {{1+\alpha e^{\,j\!\lpar {4\pi f_{sc} t+\theta_u \!\lpar t \rpar {\rm-}\theta_l \!\lpar t \rpar } \rpar } \over \sqrt {1{\rm +}\alpha ^2{\rm +}2\alpha \cos \!\lpar {4\pi f_{sc} t+\theta_u \!\lpar t \rpar -\theta_l \!\lpar t \rpar } \rpar }}dt}}$$
where T p represents the coherent integration time (in the derivation, we assume that T p approaches infinity) and the superscript ‘*’ represents the conjugate operator. Generally, in the GNSS context, the code rate R c and the subcarrier frequency f sc are both integer multiples of the base frequency f base=1.023 MHz, and R c is smaller than f sc. In the derivation, we also assume that 2f sc/R c is an integer. These assumptions also hold in the following derivation. Therefore, Equation (12) can be rewritten as
 $$R_{{\rm CE},l} = \mathop{E}\limits_{\lcub \theta_l, \theta_u \rcub } \left({2 \over T_{sc}} \int_0^{{T_{sc}}/2} {1+\alpha e^{j \lpar {4\pi f_{sc} t+\theta_u {\rm-}\theta_l} \rpar } \over \sqrt {1{\rm +}\alpha^2{\rm +}2\alpha \cos \lpar 4\pi f_{sc} t + \theta_u - \theta_l} \rpar} dt \right) = a_0 +\alpha a_{-1}$$
Similarly, the average correlation outputs of the constant envelope signal with respect to the replicas of the upper sideband signal are
 $$R_{{\rm CE},u} = {1 \over T_p} \int\limits_0^{T_p} {S_{\rm CE} \!\lpar t \rpar \!\lpar {e^{\,j\!\lpar {2\pi f_{sc} t+\theta_u \!\lpar t \rpar } \rpar }} \rpar ^{\rm \ast}dt} =a_1 +\alpha a_0$$
As shown in Equations (13) and (14), the cross-correlations of the composite signal with respect to the replicas of the lower sideband signal and the upper sideband signal are exactly the coefficients of the components at ±f sc in Equation (10), which indicates that the higher-order harmonic components have no effect on the average correlation outputs for useful signal components.
Note that the function given in Equation (8) is a real even function, whose Fourier series coefficients satisfy the relationship a −k=a k. Therefore, hereafter, we replace all a −k with a k. According to Equations (13) and (14), we calculate the power ratio between the upper and lower sidebands of the modulated signal as follows:
 $$\alpha_{{\rm CE}}^2 ={P_{{\rm CE},u} \over P_{{\rm CE},l}} = {R_{{\rm CE},u}^2 \over R_{{\rm CE},l}^2} = \left\vert {{a_1 +a_0 \alpha \over a_0 +a_1 \alpha}} \right\vert^2$$
 Consequently, we can calculate α by substituting the designed power ratio, which is  $\alpha_{{\rm CE}}^{\rm 2}$, into Equation (15), and then, the desired constant envelope composite signal can be obtained by inserting α into Equation (6).
In the proposed method, the power loss consists of two main components: one is the loss caused by the single-frequency multiplexing in each sideband, and the other is caused by the higher-order harmonic components, as shown in Equation (10). Thus, the multiplexing efficiency of the proposed method can be calculated as follows:
 $$\eta =\vert {a_1 +a_0 \alpha} \vert ^2\cdot \eta_u +\vert {a_0 +a_1 \alpha} \vert ^2\cdot \eta_l$$
where ηu and ηl are the single-frequency multiplexing efficiencies in the upper and lower sidebands, respectively. From Equations (11) and (16), we find that the total multiplexing efficiency depends only on α, ηu and ηl.
Figure 2 shows the multiplexing efficiencies for different values of α, where the logarithm of α is used as the x axis. Three pairs of typical values for ηu and ηl are considered. The single-frequency multiplexing efficiency ηl=1 or ηu=1 represents the multiplexing of two signals in the corresponding sideband, and ηl=0.75 or ηu=0.75 represents the multiplexing of three signals with equal power in the corresponding sideband. We can obtain the following conclusions from this figure: the greater the power difference between the upper and lower sidebands, the higher the multiplexing efficiency of the proposed method. Furthermore, the minimum multiplexing efficiency occurs near α=1, and the multiplexing efficiency approaches ηu for α=+∞ and ηl for α=0.
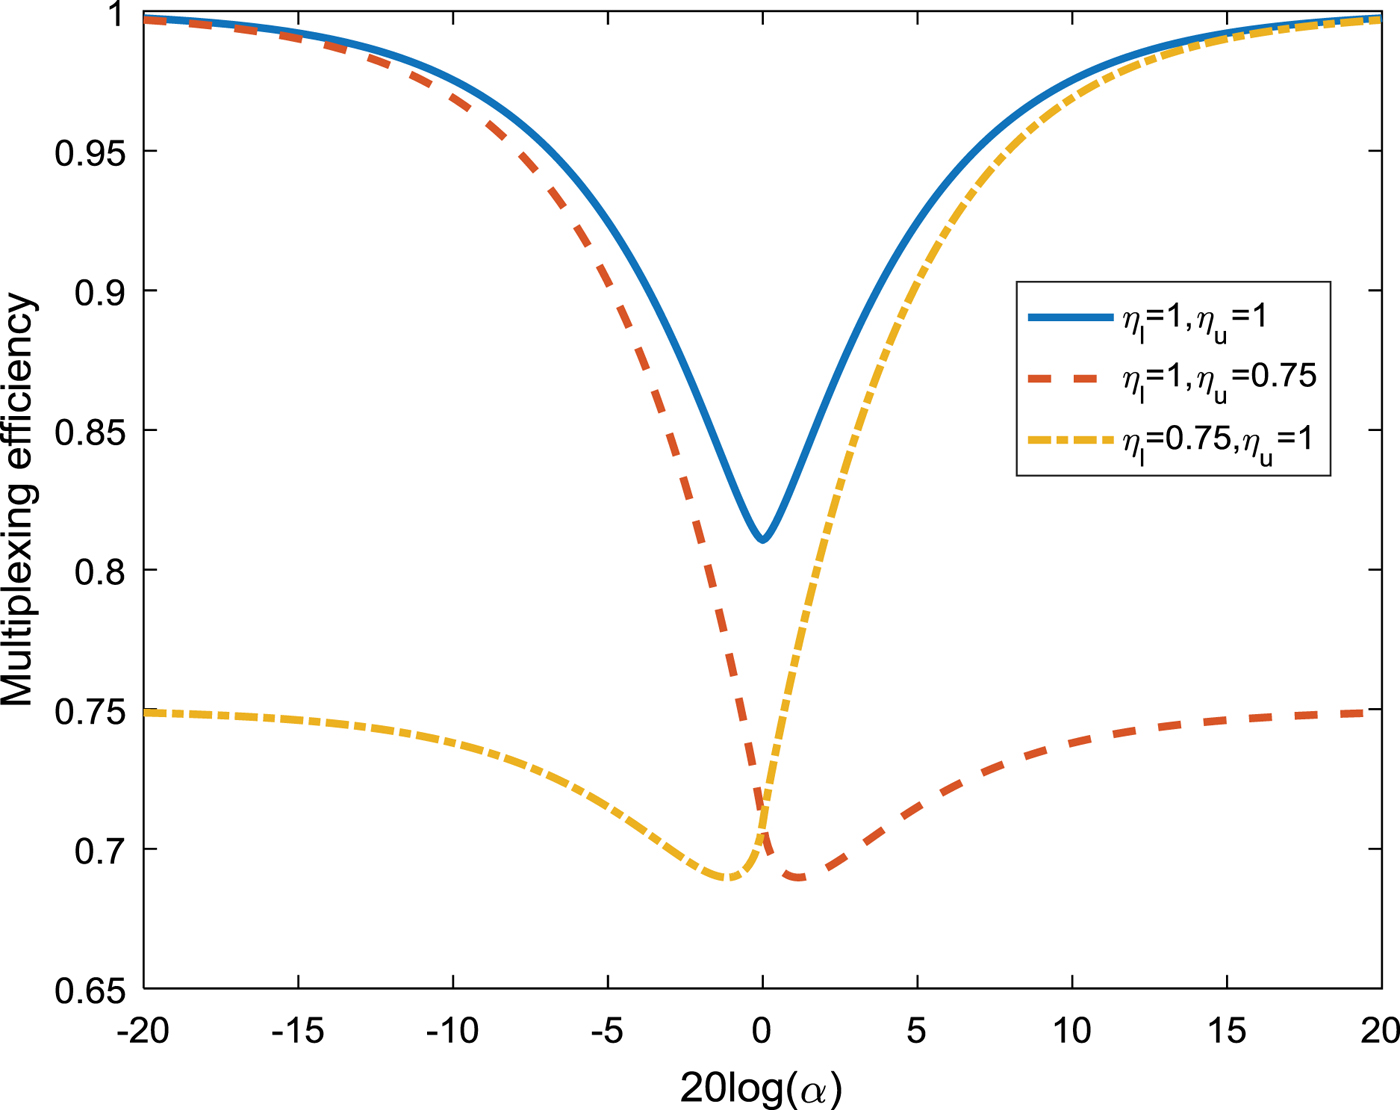
Figure 2. The multiplexing efficiency of the proposed method for different values of α.
Figure 3 shows a schematic depiction of the proposed method. The process can be described as follows: 1. Combine the signals in the lower and upper sidebands into two constant envelope signals. 2. Calculate the value of α based on the required power ratio αCE according to Equations (11) and (15). 3. Generate the equivalent baseband signal according to Equation (3). 4. Generate the dual-frequency constant envelope composite signal according to Equations (4) or (6).

Figure 3. Schematic diagram of the proposed method.
2.3. The Special Case of α=1
Note that S CE(t) may approach infinity when α=1, according to Equation (6). In this case, the expression for S linear(t) can be written as
 $$S_{\rm linear} \lpar t \rpar = 2e^{\,j {\theta_l \!\lpar t \rpar {\rm +}\theta_u \!\lpar t \rpar \over 2}}\cos \!\left({2\pi f_{sc} t{\rm +} {\theta_u \!\lpar t \rpar \hbox{-}\theta_l \!\lpar t \rpar \over 2}} \right)$$
Its constellation diagram consists of 2N possible line segments through the origin. According to Equation (6), the expression for S CE(t) is
 $$S_{\rm CE} \lpar t \rpar = {S_{\rm linear} \lpar t \rpar \over \vert S_{\rm linear} \lpar t \rpar \vert } = e^{j {\theta_l \!\lpar t \rpar +\theta_u \!\lpar t \rpar \over 2}} sign \left({\cos \!\left({2\pi f_{sc} t+ {\theta_u \!\lpar t \rpar -\theta_l \!\lpar t \rpar \over 2}} \right)} \right)$$
where sign(x) is the sign function. Our concern here is the definition of sign(0). In this paper, we take the common definition used in communications as follows:
 $$\hbox{sign}\!\lpar x \rpar = \left\{\matrix{1 \hfill &x\ge 0 \hfill \cr -1 \hfill &x \lt 0} \right.$$
Consequently, each line segment in the complex plane is mapped to two phase states.
Substituting Equation (18) into Equations (12) and (13), we obtain R CE,l=R CE,u=2 /π. The power ratio between the upper and lower sidebands of the composite signal is still equal to 1. The multiplexing efficiency in this case is 4(ηl+ηu) /π2.
3. PHASE ROTATION LUT IMPLEMENTATION
The proposed constant envelope signal can also be generated based on a LUT, similar to AltBOC. The LUT method is more suitable for an on board generator. According to Equation (5) or Equation (17), the phase of the composite signal is uniquely determined by the combination of the spreading codes and the time t. For a given combination of spreading codes, the constellation diagram of the linearly combined signal is an ellipse or line segment. There are a total of 2N possible combinations of spreading codes, corresponding to 2N possible ellipses or line segments in the constellation diagram. The period of each ellipse or line segment is exactly the subcarrier period T sc=1/f sc. For LUT implementation, each continuous ellipse or line segment is sampled at K points to obtain K modulation phases, assuming K≥4. We refer to this sampling rate as the subcarrier sampling rate f s:
 $$f_s = Kf_{sc} \quad \lpar K\ge 4 \rpar $$
 Therefore, the phase state of the composite signal remains constant in each sampling interval  $t\in \left[{\!\lpar {k-1} \rpar {T_{sc} \over K}, k {T_{sc} \over K}} \right),k = 1,2, \ldots, K$. There are a total of K×2N phase states. In the implementation, the subcarrier sampling rate can be adjusted according to the required driving clock rate for the baseband signal generator. The transmitter phases are pre-calculated and stored in a two-dimensional LUT, in a manner similar to that used in AltBOC (OS SIS ICD, 2010). The general LUT, with dimensions of K×2N, is shown in Table 1. Each column in the LUT corresponds to a possible ellipse or line segment.
Table 1. The general phase LUT for dual-frequency constant envelope modulation.

Based on the mapping relationship represented in Table 1, we derive the average correlation outputs for the useful signal components in the two sidebands. For signal component s n(t) (n=1,2,…,L) in the lower sideband, the expected average correlation is expressed as (Yao et al., Reference Yao, Zhang and Lu2016)
 $$\eqalign{corr_n &=E\left[ {{1 \over T}\int\limits_T {s_{\rm CE} \!\lpar t \rpar \cdot s_n \!\lpar t \rpar e^{\,j2\pi f_{sc} t}dt}} \right]\cr &=E\left[ {1 \over T} \int\limits_T e^{\,j\theta \!\lpar t \rpar }\cdot s_n \!\lpar t \rpar e^{\,j2\pi f_{sc} t}dt \right],\quad n = 1,2, \cdots,L}$$
Suppose that every Pseudorandom Noise (PRN) code of the signal components is completely random. Then, 2N possible spreading code combinations will occur with equal probability, and Equation (21) can be rewritten as
 $$\eqalign{corr_n &= {1 \over 2^N} \sum\limits_{i=1}^{2^N} b_n \lpar i \rpar \sum\limits_{k=1}^K {1 \over T_sc} \int_{{k-1 \over K}T_{sc}}^{{k \over K}T_{sc}} e^{\,j\theta_{k,i}} e^{j2\pi f_{sc} t}dt \cr &= {1 \over 2^N} \sum\limits_{i=1}^{2^N} \sum\limits_{k=1}^K b_n \lpar i \rpar e^{j\theta_{k,i}} \left({1 \over \pi} e^{j {\pi \over K} \lpar 2k -1 \rpar } \sin \left({\pi \over K} \right) \right) \quad n = 1,2,\cdots,L}$$
where  $b_{n} \lpar i \rpar = \pm 1$ is the value of s n(t) corresponding to the ith spreading code combination. Similarly, for signal component s n(t) (n=L+1,L+2,…,N) in the upper sideband, its expected average correlation is expressed as
 $$\eqalign{corr_n &=E\left[ {1 \over T}\int\limits_T e^{\,j\theta \lpar t \rpar }\cdot s_n \lpar t \rpar e^{-j 2\pi f_{sc} t}dt \right] \cr &={1 \over 2^N} \sum\limits_{i=1}^{2^N} \sum\limits_{k = 1}^m b_n \lpar i \rpar e^{j\theta_{k,i}} \left({1 \over \pi} e^{-j {\pi \over K} \lpar 2k-1 \rpar } \sin \left({\pi \over K} \right) \right) \quad n=L+1,L+2,\cdots,N}$$
The measured power of s n(t) (n=1,2,…,N) is expressed as
 $$\mathop{P_n}\limits^{\sim} = \vert corr_n \vert ^2$$
For digitally implemented transmitters, the LUT method for the proposed constant envelope composite signal generation technique can enable convenient reconstruction in orbit. We simply recalculate the transmitter phases and replace the previous LUT with a new LUT whenever we need to adjust the power allocation among the signal components or adjust the subcarrier sampling rate.
Sampling each continuous ellipse or line segment to K points may introduce a loss in correlation. The measured multiplexing efficiency of the LUT-based signal can be expressed as follows:
 $$\mathop{\eta}\limits^{\sim} = \sum\limits_{n=1}^N \mathop{P_n}\limits^{\sim} = \sum\limits_{n=1}^N \vert corr_n \vert ^2$$
It is well known that sampling will introduce steps in the phase. Generally, the measured multiplexing efficiency given in Equation (25) is lower than the theoretical multiplexing efficiency given in Equation (16) because of the additional loss induced by sampling, and this additional loss is associated with the subcarrier sampling rate. However, when α=1, the phase of the composite signal is stepped, as in Equation (18), which is somewhat similar to the result of sampling. Therefore, it is possible to find a suitable subcarrier sampling rate or K to express the composite signal without additional loss, which implies that the direct signal generation method described in Equation (18) is consistent with the LUT-based method. Note that the phase in Equation (18) varies with the sign of the cosine, if all initial phases satisfy the relationship
 $$\left\vert {\theta_u \lpar k \rpar -\theta_l \lpar k \rpar \over 2} \right\vert = {q_k \over p_k} \times 2\pi, \quad k = 1,2,\cdots,2^N$$
where the q k are non-negative integers, the p k are positive integers, and q k<p k, then the optimal subcarrier sampling rate is obtained as follows:
 $$f_s = Kf_{sc} = \min \lpar p_k q_k \vert q_k \ne 0 \rpar f_{sc}$$
4. APPLICATION FOR THE ALTBOC-LIKE SIGNAL MODEL
In this application, there are four signals, s 1, s 2, s 3 and s 4 to be combined. s 1 and s 2 are two quadrature signal components in the lower sideband, and s 3 and s 4 are two quadrature signal components in the upper sideband. The subcarrier frequency is f sc=15f base=15·345 MHz, and the code rate is R c=10f base=10·23 MHz. This application is similar to AltBOC modulation. In this section, we consider two power allocation schemes, namely, 1:γ:1:γ and 1:1:γ:γ, which are also discussed in relation to ACEBOC (Yao and Lu, Reference Yao and Lu2012).
4.1. Case 1 (p1:p 2:p 3:p 4=1:γ:1:γ)
In this case, more power is allocated to the pilot component to achieve improved tracking performance. The power levels in the lower and upper sidebands are equal. The signals in each sideband are combined via Quadrature Phase-Shift Keying (QPSK), and they can be expressed as
 $$\eqalign{S_l \lpar t \rpar &= {\sqrt{2} \over 2}\!\left({s_1 \!\lpar t \rpar +j\sqrt \gamma s_2 \!\lpar t \rpar } \right)=e^{\,j\theta_l \!\lpar t \rpar } \cr S_u \!\lpar t \rpar &= {\sqrt{2} \over 2}\!\left({s_3 \!\lpar t \rpar +j\sqrt \gamma s_4 \!\lpar t \rpar } \right)=e^{\,j\theta_u \!\lpar t \rpar }}$$
 The values of θl and θu and the corresponding values of the composite signal at t=0+ are shown in Table 2, where β represents the value of θl or θu when s 1 (t)=s 2(t)=s 3(t)=s 4(t)=1 and thus is defined as  $\beta = \tan^{-1} \left(1 /\sqrt{\gamma} \right)$. The notation exp() represents the exponential function. The constellation diagram of the baseband composite signal is shown in the last column of Table 2. These results are consistent with those of ACEBOC, which implies that the proposed method is equivalent to ACEBOC under this power allocation scheme.
Table 2. Graphical representation of the proposed modulation table (1:γ:1:γ).

Specifically, let us consider γ=1 as an example, which is the same as in the Galileo E5 signal. For this example, β=π/4, and the number of possible phases in the constellation diagram reduces to eight. Table 3 shows a graphical representation of the proposed method. From the fifth and sixth columns, we can see that θl and θu satisfy the relationship expressed in Equation (26). Therefore, an optimal subcarrier sampling rate exists and is f s=8f sc, according to Equation (27). This result implies that the phase of the composite signal in a single subcarrier period can be divided into eight parts, as shown in the rightmost column of Table 3. Note that Table 3 is consistent with the graphical representation of AltBOC (Lestarquit et al., Reference Lestarquit, Artaud and Issler2008), which implies that AltBOC is a special case of the proposed method.
Table 3. Graphical representation of the proposed modulation table (1:1:1:1).

4.2. Case 2 (p1:p 2:p 3:p 4=1:1:γ:γ)
In this case, more power is allocated to one sideband; such a case is also considered in generalised AltBOC. Again, QPSK modulation is used to combine the signals in each sideband, and the modulated phases θl and θu are obtained as follows:
 $$\eqalign{S_l \lpar t \rpar &= {\sqrt{2} \over 2} \lpar s_1 \lpar t \rpar + js_2 \lpar t \rpar \rpar = e^{\,j\theta_l \lpar t \rpar } \cr S_u \lpar t \rpar &= {\sqrt{2\gamma} \over 2} \lpar s_3 \lpar t \rpar + js_4 \lpar t \rpar \rpar e^{j\varphi} = \sqrt{\gamma} e^{j\theta_u \lpar t \rpar }}$$
Note that an additional phase difference φ between the upper and lower sidebands is introduced in Equation (29). This is because this phase difference will affect the measured power ratio and the multiplexing efficiency obtained from the LUT in this case. The power ratio and multiplexing efficiency of the continuous signal expressed in Equation (6), which are calculated by Equations (15) and (16), do not depend on the phase relationship between the upper and lower sidebands. For the example of γ=3, according to Equations (11) and (15), α=1·2144 is obtained. We can then plot the measured power ratios and multiplexing efficiencies under different phase differences as shown in Figure 4, where the additional phase difference between the upper and lower sidebands varies from 0° to 90°. The curves labelled K→∞ represent the continuous signal as shown in Equation (6). The curves labelled K=8 represent the case of a subcarrier sampling rate of f s=8f sc, which is also employed in generalised AltBOC. For K→∞, the power ratio and multiplexing efficiency are constant, but for K=8, they vary with the phase difference. In GNSS signal design, the power ratio is a strong constraint; we must ensure that the power ratio for K=8 is equal to the power ratio for K→∞. One of the two intersections between the two power ratio curves, as shown in Figure 4, should be chosen, and the corresponding phase difference should be used to generate the LUT.

Figure 4. The power ratios and multiplexing efficiencies under different phase differences.
Figure 5 shows the multiplexing efficiencies of the proposed method for K→∞ and K=8 and the multiplexing efficiencies of generalised AltBOC and ACEBOC. The x-axis represents the logarithm of the power ratio between the upper and lower sidebands. For K=8, the multiplexing efficiencies are obtained by generating LUTs with suitable phase differences, as analysed above. Clearly, the multiplexing efficiency for K=8 is lower than the multiplexing efficiency for K→∞, which indicates that some additional loss due to sampling is introduced in the LUT-based method. The multiplexing efficiency of ACEBOC is constant at 0.8106. The multiplexing efficiency of the proposed method with K=8 is slightly lower than that of generalised AltBOC, but both methods are significantly improved relative to ACEBOC. Nevertheless, we can further improve the multiplexing efficiency of the LUT-based method by increasing the subcarrier sampling rate. Moreover, for the proposed method and generalised AltBOC, the larger the power difference is between the two sidebands, the greater is the improvement in multiplexing efficiency. When γ=1, which is exactly case 1, these three methods are equivalent to each other and to AltBOC. When γ→0 or γ→+∞, the multiplexing efficiencies of the proposed method with K=8 and generalised AltBOC approach the same value of 94·96%, which is exactly the efficiency of single-sideband complex subcarriers with four levels.

Figure 5. The multiplexing efficiencies under different power ratios.
5. EXAMPLE FOR A GENERAL DUAL-FREQUENCY SIGNAL MODEL IN THE BEIDOU B1 BAND
5.1. Proposed Method for Beidou B1 Signals
The application under consideration is the multiplexing of Beidou B1 signals. The same parameters employed in GCE-BOC (Huang et al., Reference Huang, Zhu, Tang, Gong and Ou2015) are used in this application. The details are listed in Table 4. There are four newly designed signals (namely, B1Cd, B1Cp, B1Ad and B1Ap) and one inherited signal (B1I) in the Beidou B1 band. Note that B1Ad and B1Ap are combined into one code sequence through Time-Division Data Multiplexing (TDDM); we term this combined signal B1A. Therefore, these five signal components are mapped to the four code sequences B1Cd, B1Cp, B1A and B1I, which have a power ratio of 1:3:4:2. Without loss of generality, let us assume that the power values of B1Cd, B1Cp, B1A and B1I are 1 W, 3 W, 4 W and 2 W, respectively. Note that AltBOC, ACEBOC and generalised AltBOC cannot be used for this application.
Table 4. Signal parameters in the Beidou B1 band.

First, the signals in the upper sideband are combined into a constant envelope signal using the Coherent Adaptive Subcarrier Modulation (CASM) method (Dafesh et al., Reference Dafesh, Nguyen and Lazar1999); this combined signal can be expressed as
 $$\eqalign{s_{u\_B1} \lpar t \rpar &=\left({\sqrt {P_{up\_I}} s_{B1Cp} \lpar t \rpar \cos \lpar m \rpar +\sqrt {P_{up\_Q}} s_{B1Cd} \lpar t \rpar \sin \lpar m \rpar } \right) \cr &\quad + j\left({\sqrt {P_{up\_Q}} s_{B1A} \lpar t \rpar \cos \lpar m \rpar -\sqrt {P_{up\_I}} s_{B1Cp} \lpar t \rpar s_{B1Cd} \lpar t \rpar s_{B1A} \lpar t \rpar \sin \lpar m \rpar } \right)}$$
where m is the modulation index, which is calculated as
 $$m = \tan^{-1} \sqrt{{P_{B1Cd} \over P_{B1A}}} = \tan^{-1} \left({1 \over 2} \right) = 0{\cdot}4636$$
  $P_{up\_I}$ and
  $P_{up\_Q}$ are the powers in the in-phase and quadrature-phase channels and can be calculated as
 $$\eqalign{P_{up\_I} &= P_{B1Cp} /\cos^2 \lpar m \rpar = 3{\cdot}75\;\hbox{W} \cr P_{up\_Q} &= P_{B1A} /\cos^2 \lpar m \rpar = 5\;\hbox{W}}$$
Therefore, the total power of the combined signal in the upper sideband is 8·75 W.
There is only one signal in the lower sideband; thus, the combined signal in the lower sideband is
 $$s_{l\_B1} \lpar t \rpar = j \sqrt{P_{B1I}} s_{B1I} \lpar t \rpar $$
The desired power ratio between the upper and lower sidebands is αCE2=8·75 / 2=4·375. Thus, a value of α=1·3496 can be calculated from Equations (11) and (15) using numerical methods. The modulated phases in the upper and lower sidebands are
 $$\eqalign{\theta_u \lpar t \rpar & =\hbox{atan}\,2 \lpar s_{u\_B1} \lpar t \rpar \rpar \cr \theta_l \lpar t \rpar &= \hbox{atan}\,2 \lpar s_{l\_B1} \lpar t \rpar \rpar }$$
According to Equation (6), the final composite signal is obtained as follows:
 $$S_{B1} \!\lpar t \rpar = {e^{\,j\!\lpar {-2\pi f_{sc\_B1} t+\theta_l \!\lpar t \rpar } \rpar }+1{\cdot}3496e^{\,j\!\lpar {2\pi f_{sc\_B1} t+\theta_u \!\lpar t \rpar } \rpar } \over \sqrt {2{\cdot}8214+2{\cdot}6992\cos \!\lpar {4\pi f_{sc\_B1} t+\theta_u \!\lpar t \rpar -\theta_l \!\lpar t \rpar } \rpar }}$$
 Note that the subcarrier frequency is  $f_{sc\_B1}=7f_{base}$. Figure 6 shows the multiplexing efficiencies of the proposed method and GCE-BOC for different subcarrier sampling rates. It is clear that our method offers higher multiplexing efficiency than GCE-BOC. As the subcarrier sampling rate increases, the multiplexing efficiency of the proposed method also increases and approaches 0·8148, as calculated according to Equation (16).

Figure 6. The multiplexing efficiencies of the proposed method and GCE-BOC in the Beidou B1 band.
5.2. LUT-based Implementation
For the selection of the subcarrier sampling rate, we consider two types of signal generators as follows. Note that there are a BOC(14,2) signal and a TMBOC(6,1,1/11) signal in the B1 band and an AltBOC-like signal in the B2 band; the driving clock on the satellite must have the ability to generate the subcarrier frequencies 14f base, 6f base and 15f base.
1) B1 and B2 share a relatively high clock rate and use a fractional frequency to obtain their own driving clock rate. Therefore, the required minimum driving clock rate is 210f base. The subcarrier sampling rate should be a factor of 210f base, which implies that K must be a factor of 30, according to Equation (20). As shown in Figure 6, the multiplexing efficiency increases with increasing K, but the size of the LUT also increases. Therefore, considering the size of the LUT and the multiplexing efficiency, K=15 is chosen, which implies that the subcarrier sampling rate should be  $f_{s\_B1} = 15f_{sc\_B1} = 105f_{base}$. The multiplexing efficiency under this subcarrier sampling rate is 80·20%, which is 5·14% higher than that of GCE-BOC.
2) The driving clock rate of B1 and B2 is obtained as a multiple of a relatively low fundamental clock rate. Therefore, for B1 signal generation, the required minimum driving clock rate is 42f base. However, this minimum driving clock rate would lead to a relatively low subcarrier sampling rate of  $6f_{sc\_B1}$, which would produce a significant loss in multiplexing efficiency, as shown in Figure 6. Therefore, we double this minimum driving clock rate to 82f base to obtain a relatively large subcarrier sampling rate of
  $12f_{sc\_B1}$. The multiplexing efficiency under this subcarrier sampling rate is 79·49%, which is 6·92% higher than that of GCE-BOC.
In the following analysis and simulation, we consider only a signal generator with a subcarrier sampling rate of  $f_{s\_B1} =15f_{sc\_B1} =105f_{base}$. Table 5 shows the phase LUT for the proposed method under this subcarrier sampling rate. Note that only half of the states are listed, considering the symmetry of the phase LUT. This symmetry implies that when all chip values are complemented, the stored phase value increases by π (Dafesh and Cahn, Reference Dafesh and Cahn2009). There are a total of 240 phase states in the LUT.
Table 5. LUT of the phase states in the Beidou B1 band for the proposed method.

According to Equations (22) and (23), the average correlations of B1A, B1Cp, B1Cd and B1I are j0·5664, 0·4906, 0·2833 and j0·4004, respectively. Thus, the useful signal components can be modelled as
 $$\eqalign{S_{B1}^{useful} \lpar t \rpar &=\lpar {0{\cdot}2833s_{B1Cd} \lpar t \rpar + 0{\cdot}4906s_{B1Cp} \lpar t \rpar + j0{\cdot}5664s_{B1A} \lpar t \rpar } \rpar e^{j2\pi f_{sc\_B1} t} \cr &\quad + j0{\cdot}4004s_{B1I} \lpar t \rpar e^{-j2\pi f_{sc\_B1} t}}$$
 The average power ratio of the four signal components is  $\vert {corr_{B1A}} \vert ^{2}{:}\vert {corr_{B1Cp}} \vert ^{2}{:}\break \vert {corr_{B1Cd}} \vert ^{2}{:}\vert {corr_{B1I}} \vert ^{2}=4{\cdot}00{:}3{\cdot}00{:}1{\cdot}00{:}2{\cdot}00$, and the phase values of the four signal components are 90°, 0°, 0° and 90°, respectively. The multiplexing efficiency is given by
  $\vert {corr_{B1A}} \vert ^{2} + \vert {corr_{B1Cp}} \vert ^{2}+\vert {corr_{B1Cd}} \vert ^{2}+\vert {corr_{B1I}} \vert ^{2}=80{\cdot}2\hbox{0}\% $.
5.3. Cross-correlation Functions (CCFs)
Figure 7 shows the simulation architecture for obtaining the CCFs of the B1 signal. First, four binary signal components s B1I(t), s B1Cd(t), s B1Cp(t) and s B1A(t) are generated with random spreading codes. We then generate the composite signal s B1(t) through the LUT method. The envelope of s B1(t) is 1. The simulated sampling rate of the complex baseband signal is 214·83 MHz. The signals in the lower sideband and upper sideband are up- or down-converted to remove the subcarrier. The converted signals are then correlated with useful signal components in the corresponding sideband to obtain the CCFs. The coherent integration time is T=1 ms.

Figure 7. The simulation architecture to obtain the CCFs of Beidou B1 signals.
The simulated CCFs for the B1 signal are shown in Figure 8. To obtain an accurate estimation, the CCFs are averaged from 100 pairs of different random PRN codes. The results show that each simulated CCF has the expected shape. The peak values of these CCFs are 0·2813, 0·4899, 0·5666 and 0·4003. The difference between the simulated values and expected values is less than 1%. The simulated CCF shapes and peaks demonstrate that the BOC(14,2), TMBOC(6,1,4/33), BOC(1,1) and BPSK-R(2) signals are combined correctly in the composite signals and that the desired power allocation is achieved.

Figure 8. The CCFs of the generated Beidou B1 signals.
5.4. Power Spectral Density (PSD)
To verify the PSD of the proposed scheme for the B1 signal, the simulated PSD is compared with the directly summed PSD of useful signal components in this subsection. The simulated PSD is obtained by generating the signals with random spreading codes and averaging the results of the periodogram algorithm through 10,000 Monte Carlo runs, and the spectrum measurement is improved by a correction factor to compensate for the sampling effect (Dafesh and Cahn, Reference Dafesh and Cahn2009); the directly summed PSD is calculated as follows:
 $$\eqalign{PSD_{B1}^{sum} \lpar f \rpar &=0{\cdot}2833^2G_{BOC(1,1)} \lpar {f - f_{sc}} \rpar + 0{\cdot}4906^2G_{TMBOC(6,1,4/33)} \lpar {f - f_{sc}} \rpar \cr &\quad+0{\cdot}5664^2G_{BOC(14,2)} \lpar {f - f_{sc}} \rpar + 0{\cdot}4004^2G_{BPSK(2)} \lpar {f + f_{sc}} \rpar }$$
where G(f) represents the theoretical PSD of the corresponding modulation.
Figure 9 shows the simulated PSD and the summed PSD in the Beidou B1 band. The shapes of the main lobes in the simulated PSD are essentially the same as those in the directly summed PSD. In greater detail, the main lobes of the directly summed PSD and the simulated PSD at  $\pm 1{\cdot}023\;\hbox{MHz}$ are nearly the same, but the main lobes of the directly summed PSD at −7 MHz and +21 MHz are approximately 1 dB lower than those of the simulated PSD. Moreover, a marked difference between the simulated and directly summed PSDs appears at high frequencies. The directly summed PSD includes only the useful signal components, whereas the simulated PSD includes not only the useful signal components but also the higher-order harmonic components and the inter-modulation products, which are two sources of the difference between the two PSDs. In addition, the sampling also contributes to the difference between the two PSDs. In short, the locations and shapes of the main lobes in the simulated PSD demonstrate that the proposed technique can indeed modulate these useful signal components to the desired frequencies.

Figure 9. The PSDs of the generated Beidou B1 signals.
6. CONCLUSIONS
In this paper, we propose a phase-aligned DCEM technique; this method can be used to combine two constant-envelope-modulated signals in two sidebands into a composite signal with a constant envelope, where the constant-envelope-modulated signal in each sideband consists of an arbitrary number of signal components with an arbitrary power ratio and phase relationship among the components. The main advantages of our method are its increased flexibility and its improved multiplexing efficiency. Our method can achieve constant envelope multiplexing not only for the AltBOC-like signal model but also for a more general dual-frequency signal model. For hardware implementation, we propose a LUT-based signal generation method, which allows the subcarrier sampling rate of the signal generator to be flexibly adjusted. Applications are presented for the AltBOC-like signal model and for a more general dual-frequency signal model in the Beidou B1 band, and the conclusions can be summarised as follows.
For the application to the AltBOC-like signal model, two power allocation schemes, namely, 1:γ:1:γ and 1:1:γ:γ, are discussed. For the 1:γ:1:γ scheme, the proposed method is equivalent to ACEBOC; more specifically, AltBOC is a special case of the proposed method. For the 1:1:γ:γ scheme, the proposed method has a higher multiplexing efficiency than that of ACEBOC, and although its multiplexing efficiency is slightly lower than that of generalised AltBOC, the flexibility of our method is greater than that of generalised AltBOC. Moreover, we can improve the multiplexing efficiency by increasing the subcarrier sampling rate.
For multiplexing in the Beidou B1 band, a comparison of the multiplexing efficiencies for different subcarrier sampling rates shows that our method offers a higher multiplexing efficiency than that of GCE-BOC. In particular, for the suggested subcarrier sampling rates of 105f base and 84f base, our method yields multiplexing efficiencies that are 5% and 7% higher, respectively, than those of GCE-BOC. The simulated CCF and PSD verify that the proposed method combines all signals with the correct frequency, power ratio and modulation.
In summary, the proposed method is a flexible and highly efficient DCEM technique that can be used in next-generation GNSS signal design, such as for backwards compatibility in the Beidou B1 band and dual-frequency multiplexing in the Beidou B2 band.
ACKNOWLEDGMENTS
This work was supported by the National Natural Science Foundation of China (NSFC), Grant 61401171.


