


INTRODUCTION
In all the world's oceans, squid are integral components of marine ecosystems. However, they remain poorly represented in ecological studies in many geographical regions and there is very limited information on the diet of a large number of species. The arrow squid, Nototodarus gouldi, is an abundant, moderately sized, sexually dimorphic ommastrephid distributed in coastal and off-shore waters in southern Australia and New Zealand (Dunning, Reference Dunning, Voss, Vecchione, Toll and Sweeney1998). Previous dietary studies of N. gouldi show that they consume pelagic fish, crustaceans and other squids (O'Sullivan & Cullen, Reference O' Sullivan and Cullen1983; Smith, Reference Smith1983; Uozumi, Reference Uozumi1998) and there is evidence to suggest temporal variation in diet composition (O'Sullivan & Cullen, Reference O' Sullivan and Cullen1983). Nototodarus gouldi aggregate in the lower water column during the day and feed primarily at night relatively close to the surface (O'Sullivan & Cullen, Reference O' Sullivan and Cullen1983; Nowara & Walker, Reference Nowara and Walker1998). Arrow squid are a key prey species of many fish (Young et al., Reference Young, Lamb, Le, Bradford and Whitelaw1997; Lansdell & Young, Reference Lansdell and Young2007), seabirds (Hedd & Gales, Reference Hedd and Gales2001) and marine mammals (Gales et al., Reference Gales, Pemberton, Lu and Clarke1993). The contribution of N. gouldi to the diet of these higher predators has been found to vary spatially, seasonally and inter-annually.
To date, most dietary studies of N. gouldi have used stomach contents analysis, which although it can provide important taxonomic prey information, is restrictive and potentially biased (Ibáñez et al., Reference Ibáñez, Arancibia and Cubillos2008). Signature fatty acid (FA) analysis is increasingly being applied to high-order predators, and has been particularly successful in determining interpopulation, spatial and temporal changes in prey composition (Iverson et al., Reference Iverson, Frost and Lowry1997; Bradshaw et al., Reference Bradshaw, Hindell, Best, Phillips, Wilson and Nichols2003). This technique has also been used effectively on the onychoteuthid squid, Moroteuthis ingens, collected at Heard and Macquarie Islands (Phillips et al., Reference Phillips, Nichols and Jackson2002, Reference Phillips, Nichols and Jackson2003), where the existence of a copepod−myctophid−squid food chain was established and several temporal and seasonal dietary differences were revealed. Typically, analysis of the digestive gland is used for such studies in squid as it is a site of minimal FA modification and indicates a longer time-series of dietary uptake than that obtained from stomach contents (Semmens, Reference Semmens1998).
Commercially, N. gouldi are targeted by jig and trawl fishery operations. They are the most commercially exploited cephalopod in Australia (in volume of catch) and, although the scale of the fishery is currently small (fluctuating from 784 tonnes in 2009 to 2334 tonnes in 2005; AFMA, 2010), there is considerable potential for expansion if their market value increases (Jackson & McGrath Steer, Reference Jackson and McGrath Steer1999). To manage fisheries sustainably, it is critical to understand key trophic interactions, including the extent of competition for food resources and the interactions between prey, predators and fisheries. In this context, the aims of this study are to provide complementary stomach content and signature FA analysis of the diet of N. gouldi in waters off south-east Australia. We also assess the effects of season, gender, body size and maturity stage on diet, and evaluate predator–prey size relationships. Such information will provide valuable data for the implementation of ecosystem-based management practices.
MATERIALS AND METHODS
A total of 538 N. gouldi (including 217 females, 321 males) were collected from coastal waters off eastern South Australia and western Victoria (between 37°56′–38°43′S and 139°59′–141°36′E). Samples were taken on an opportunistic basis on seven occasions between 1 March 2007 and 19 February 2008 (Table 1) from a commercial trawler, FV ‘San Tangaroa’ collecting mainly blue grenadier Macruronus novaezelandiae and silver warehou Seriolella punctata. All samples were stored frozen whole until dissection when the following measurements for each specimen were recorded: total weight, dorsal mantle length and maturity stage (I to VI where I equals immature, taken after Lipinski, Reference Lipinski1979).
Table 1. Diet of arrow squid Nototodarus gouldi, collected from 38S, 139–141E between March 2007 and February 2008.
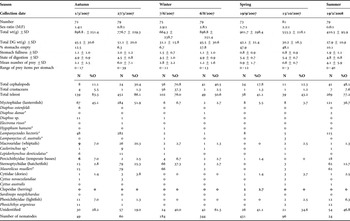
M, male; F, female; SD, standard deviation; DG, digestive gland; N, number of occurrence; %NA, percentage numerical abundance of total prey items or of total fish prey; UnID, unidentified otoliths.*, indicate fish species of which fatty acid profiles where available.
Stomach content analyses
Stomachs were thawed, individually cut open and assigned a state of digestion rating (0–6 where 6 is completely digested) and a stomach fullness (0–5, where 0 is empty) according to Jackson et al. (Reference Jackson, McKinnon, Lalas, Ardem and Buxton1998). Contents were then sieved, and diagnostic prey items were removed for identification. All contents were initially separated into three broad prey categories: teleost, cephalopod or crustacean. Further taxonomic resolution of cephalopod beaks and crustacean remains was not determined. However, teleost taxonomic resolution was determined to genus and where possible species level using sagittal otoliths. Identification of otoliths was made by comparisons with reference collections (CSIRO Marine Research) and atlases (Williams & McEldowney, Reference Williams and McEldowney1990; Smale et al., Reference Smale, Watson and Thomas1995; Furlani et al., Reference Furlani, Gales and Pemberton2007). Otolith lengths (OL, ±0.01 mm) of identified fish taxa were measured with Vernier callipers. Regression equations from Smale et al. (Reference Smale, Watson and Thomas1995), Furlani et al. (Reference Furlani, Gales and Pemberton2007) and Battaglia et al. (Reference Battaglia, Mlara, Rorneo and Andaloro2010) were then used to estimate the length (mm) of fish prey.
Lipid and fatty acid analyses
Total lipid was extracted quantitatively by the modified Bligh & Dyer (Reference Bligh and Dyer1959) method. Total lipid content and lipid-class composition of samples were determined by an Iatroscan Mark V TH10 thin layer chromatograph (TLC) coupled with a flame ionization detector (FID). All samples were developed in a polar solvent system (60:17:0.1 v/v/v hexane:diethyl-ether:acetic acid) lined with pre-extracted filter paper for 25 minutes. A non-polar solvent system (96:4 v/v hexane: ether) was then used to resolve hydrocarbon from wax esters and diacyglyceryl ethers from triacylglycerols. All samples were run in duplicate along with standards. Peaks were quantified using DAPA Scientific Software (Kalamunda, Western Australia).
For FA analysis, an aliquot of the total lipid extract (TLE) was transmethylated to produce FA methyl esters (Nichols et al., Reference Nichols, Nichols and Bakes1994). Samples were then silyated by the addition of N-O-bis-(trimethylsilyl)-trifluoroacetamide (BSTFA) (Nichols et al., Reference Nichols, Nichols and Bakes1994) and heated at 60°C overnight before excess reagent was removed under a stream of nitrogen gas and an internal injection standard (C19 FAME) was added. Gas chromatographic (GC) analyses were performed with an Agilent Technologies 6890N GC (Palo Alto, California, USA) equipped with an HP5 cross-linked methyl silicone fused silica capillary column (50 × 0.32 mm i.d.), an FID, a splitless injector and an Agilent Technologies 7683 Series auto sampler. Selected FA samples were analysed further using gas chromatography–mass spectrometry (GC-MS) to verify component identifications.
Profile comparisons of prey and squid species
Fatty acid profiles of squid digestive glands were compared to published data on potential prey genera and species (Pethybridge et al., Reference Pethybridge, Daley, Virtue, Butler, Cossa and Nichols2010). Specifically, the mean FA profile of males and females collected over the 7 sampling periods were individually tested against 13 species of myctophids, 13 other teleosts, 8 cephalopods, 1 octopod and 2 crustaceans collected from south-east Australia. This included FA profiles of 8 teleost species found in the stomach content analysis as indicated in Table 1. Data used in comparisons were in percentage composition (of total fatty acids) form. FA used were those that made up >0.5% of the total FA and included: 16:0, 18:0, 16:1ω7, 18:1ω7, 18:1ω9, 20:1ω9, 20:1ω11, 22:1ω9, 22:1ω11, 24:1ω9, 20:4ω6, 20:5ω3 (EPA), 22:6ω3 (DHA).
Statistical analyses
For stomach content analyses, prey groups and prey species were analysed using number of individual prey (N) and percentage frequency of occurrence (%O). All results are expressed as mean ± standard deviation. Statistical treatment of all data entailed the application of univariate or multivariate analysis of variance (ANOVA or MANOVA). This included assessing the main effects of season, gender, body size and female maturity stage on diet composition (as determined by the proportion of a major food type found in stomach contents), total lipid content, major lipid classes and various FA constituents. The interaction among the independent variables and the association between dietary base variables was also tested. Such analyses were performed using SPSS 17.0 (SPSS Inc., Chicago, IL). Non-metric multi-dimensional scaling (MDS) ordinations based on Bray–Curtis matrices were used to assess groupings within the dataset and analysis of similarity (ANOSIM) was used to determine which levels differed within a significant fixed effect (P < 0.05). The ANOSIM-R value indicated the extent to which the groups differed (R > 0.75: well-separated groups; R = 0.50–0.75: separated but overlapping groups; 0.25–0.50: separated but strongly overlapping groups; R <0.25: barely separated groups). MDS and ANOSIM were performed with PRIMER6 software (PRIMER-E, Plymouth, UK).
RESULTS
Stomach contents
Of all stomachs analysed, 22.9% were empty (mean stomach fullness 1.3), and most of stomach contents were more than 90% digested (mean digestive stage = 4.9). Squid caught during 6 August 2007 and 15 October 2007 had a greater proportion of samples with empty stomachs and had a lower number of prey items per stomach in comparison to squid collected on other dates (Table 1). Overall, the mean number of prey items per stomach was 2.5 while up to 40 individual prey items were observed in a single stomach.
A total of 1365 prey items was identified, with fish the most dominant prey group (N = 1088; 66.6%O; Table 1). For the teleosts, 15 taxa were identified with the myctophid, Lampanyctodes hectoris, showing the greatest contribution of any fish species (N = 461, 17.1%O). The next most important fish included the sternoptychid Maurolicus muelleri (N = 227, 11.5%O). The estimated mean lengths of fish prey were within their known size-ranges. The smallest fish species identified and measured was the lanternfish H. hanseni (21.7 mm SL). The largest estimated fish consumed were the lightfish, P. argenteus (as large as 391.4 mm FL), the toothed whiptail, L. denticulatus (as large as 342.1 mm SL) and the New Zealand dory, C. novaezelandiae (as large as 246.5 mm TL). Comparing the mantle length of individual squid with fish length estimates, it is evident that arrow squid can consume prey items almost as large (up to 92%) as its own mantle length. The predator size–prey size relationship however was not significant (ANOVA, P > 0.05).
Cephalopods were the second most important prey group (N = 205; 33.3%O), followed by the crustaceans (N = 72; 7.6%O). Of those cephalopods, most were identified as squid with very few octopus beaks recorded. Cephalopod tentacle remains consisted of suckers only as opposed to sharp hooks, eliminating squid species from the families Onychoteuthidae or Octopoteuthidae. Crustacean material was primarily composed of decapods and amphipods.
Over the yearly sampling period some seasonal trends in biology and diet are observed for N. gouldi. We found that smaller specimens (total body weight and digestive weight) were collected during June and October 2007, and February 2008, whereas size peaked during August 2007 (Table 1). There was a greater occurrence of empty stomachs in September and October 2007 and a higher number of total prey items per stomach during the summer/autumn sampling periods (Table 1). The contribution of fish to the diet of N. gouldi was significantly different among seasons (ANOVA F3 = 158, P < 0.001), but not among size-classes or gender (P = 0.15 and P = 0.35 respectively). For both genders, fish strongly dominated (>90% occurrence) the diet in March 2007 and numbers of cephalopods and crustaceans increased during winter months. Seasonal dietary shifts in the dominant prey species were observed with L. hectoris having greater representation in the diet during the summer months (particularly collection date March 2007), compared to other sampling months (Table 1). Furthermore, an increased occurrence of M. muelleri was observed during July, and there was an increase of unidentified otoliths during the winter months in 2007 (6 August, 19 September and 15 October). Despite the seasonal differences in the quantity consumed, both L. hectoris and M. muelleri were identified in the diet of squid collected over the entire sampling period. Teleosts that occurred exclusively in squid collected on only one sampling date included: Electrona rossi, Hygophum hanseni and Sardinops neopolchardus (Table 1). The occurrence of parasitic nematodes (including Anisakis species) on the stomach walls increased in August and September.
Lipid content and composition
Total lipid content of digestive gland averaged 16.4 ± 8.4% ww (Table 2). The lipid composition was mostly dominated by triacylglycerols (TAG, 46.1 ± 17.6%). Polar lipids (PL), wax esters (WE), free fatty acids (FFA) and sterols (ST) were also present in decreasing importance. Free fatty acids accounted for relatively high proportion of the total lipid (13.2 ± 6.3%), indicating that samples may have undergone some deterioration since their collection. FFA levels were lowest in those specimens collected during March 2007 and highest on 15 October 2007 (Table 2).
Table 2. Percentage lipid-class composition (of total lipid) and total lipid content (as % wet weight) of the digestive gland of arrow squid, Nototodarus gouldi. Values are means ±SD. Gender, maturity, size and collection period comparisons are shown also.
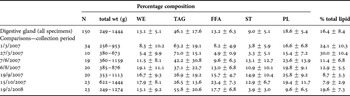
WE, wax ester; TAG, triacylglycerol; FFA, free fatty acid; ST, sterol; PL, polar lipid (mostly phospholipid).
Note: samples may contain small amounts of diacylglyceryl ether or hydrocarbon as they coelute with TAG and WE.
Differences in lipid-class composition were significantly affected by season (P < 0.001; Table 3), with mean TAG and total lipid content higher during the summer collection months (1 March 2007, 27 March 2007 and 19 February 2008) compared to all other sampling dates (Table 2). Multiple comparison (Tukey honestly significant difference (HSD)) tests demonstrated significant differences between the total lipid content of squid collected in autumn and other seasons (P ≤ 0.004), while no significant differences were observed between the other months. Relative proportions of TAG and ST significantly differed across all seasons (P < 0.001), with the exceptions of those between autumn and summer and between winter and spring. Proportions of PL significantly differed between squid collected in summer and both winter and spring while FFA in squid collected in autumn significantly differed to those collected in other seasons (P < 0.001). WE only significantly differed between those squid collected in autumn and spring (P = 0.012). As individual factors, size-class and gender had limited influence on lipid composition, with the exception of that on FFA when season was tested as a co-factor (Table 3). Maturity stage had no significant influence on lipid profiles (ANOVA, P = 0.60).
Table 3. Summary of multivariate analysis of variance on total lipid, lipid-class composition and fatty acid composition of Nototodarus gouldi depending on collection period (seasons), size-classes (< and > 300 mm mantle length) and gender.
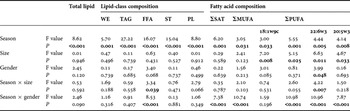
Significant probabilities are in bold (P<0.05). Note: no significant interactions were observed between size × gender and any variable with the exception of 22:6w3 (F1 = 5.55, P = 0.020).
Fatty acid profiles
Twenty-nine different FA were found in greater than trace levels (>0.5%) in all digestive gland samples (Table 4). The major FA that dominated in the digestive gland consistently were: 16:0, 22:6ω3, 20:1ω9, 18:1ω9, 18:0, 22:1ω11, 20:5ω3, 24:1ω9, 22:1ω9 and 18:1ω7, in decreasing order of relative abundance. For all specimens combined, SAT accounted for 30.5 ± 7.9%, MUFA 40.8 ± 10.7% and PUFA 24.6 ± 10.1%, although variations between the sampling periods were observed (Figure 1). The iso-SAT and branched FA accounted for 0.6% and 2.1% of the total FA, respectively.
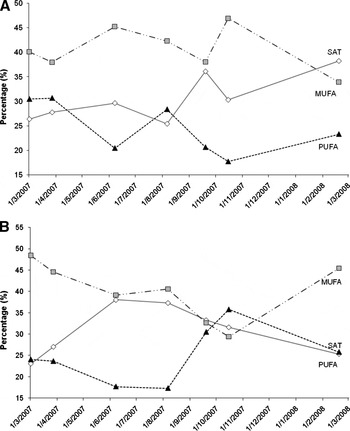
Fig. 1. Collection date comparison of the major FA groups, saturated (SAT), monounsaturated (MUFA), and polyunsaturated (PUFA), for (A) males only and (B) females only.
Table 4. Average fatty acid composition of the digestive gland of Nototodarus gouldi collected off south-east Australia.
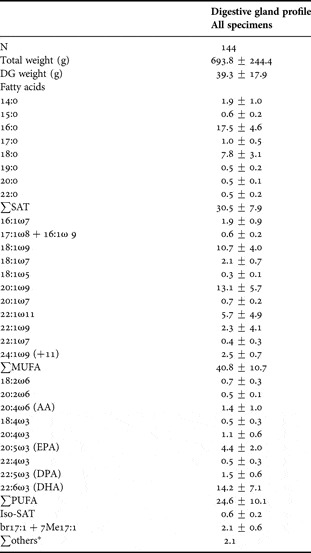
N, number; DG, digestive glands; SAT, saturated fatty acids; MUFA, monounsaturated fatty acids; PUFA, polyunsaturated fatty acids. Others FA include those less than 0.2%: 21:0, 24:0, 16:1ω13t, 16:1ω5c, 24:1ω7, 18:3ω6, 21:5ω3, 22:2ω6, 22:3ω6. Iso-FA include: i15:0, i16:1, i17:1, i16:0, i17:0, i18:0.
A three-way MANOVA revealed that season significantly affected all the FA constituents tested, while only selected FA constituents were affected by size and gender (Table 3). Using the Tukey HSD post-hoc multi comparison test, SAT levels significantly differed in autumn compared to other seasons (P ≤ 0.008). Significant differences in the proportions of MUFA were evident between autumn and spring (mean difference, I-J = 6.24, P = 0.021), while PUFA differed between autumn and winter (I-J = 5.94, P = 0.013). Significant differences between the two size-classes for PUFA (including 22:6ω3 and 20:5ω3) and 18:1ω9 were observed (Table 3). Higher levels of dietary derived PUFA were observed in smaller (< 300 mm ML) specimens and higher proportions of 18:1ω9 were found in larger (>300 mm ML) specimens. Gender only significantly influenced proportions of 18:1ω9 and 22:6ω3 (Table 3), with higher levels of 18:1ω9 and lower levels of 22:6ω3 observed in males than females. The interaction between gender and season also showed a significant effect on a number of lipid-class and FA constituents (Table 3). Significantly higher levels of 18:0 and 22:1ω9, and lower levels of 16:0 and 22:1ω9 were found in females of maturation stage 5, while highest levels of the long-chain PUFA—22:6ω3 and 20:5ω3—were observed in females of a maturity stage of 4 (P < 0.01). Male FA profiles were most similar to that of females with a maturity stage of 3 as opposed to those that had a maturity stage of 4 and 5.
Using non-parametric multi-dimensional scaling (MDS; Figure 2) ordinations and ANOSIM, we tested group associations of squid FA profiles. In general males and females demonstrated limited dissimilarity in their FA profiles (ANOSIM R = 0.11) while collection period differences were evident between males and females. The most dissimilar (R > 0.75) male and female profiles occurred between those caught in February 2008 and those caught in March and October 2007. Male and female squid collected in October showed dissimilarity from those caught in August and September, and from squid collected in June and August. Between other collection months, more similar profiles between males and females were displayed (R ≤ 0.5, Figure 2).
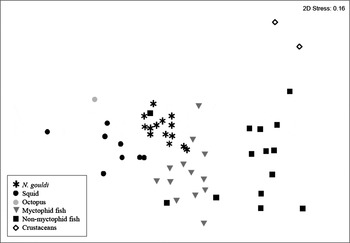
Fig. 2. Scatterplot of multidimensional scaling (MDS) based upon the mean fatty acid composition of various potential prey species and the digestive gland of male (M) and female (F) Nototodarus gouldi collected over various dates. Axis scales are arbitrary in non-metric MDS and are therefore omitted.
Prey profile comparisons
Mean FA profiles of potential prey species were compared to those of digestive gland of male and female N. gouldi collected over the 7 sampling dates using an MDS scatter plot (Figure 2). All squid were closely grouped together regardless of gender or collection season, although most were closely related to the FA profiles of various myctophid fish, other fish species and cephalopods. Myctophid fish demonstrated the highest association with arrow squid digestive gland (ANOSIM R = 0.037–0.6) with greatest similarity between male squid collected on 1 March 2007, 7 June 2007 and 19 February 2008 (R = 0.025, 0.037 and 0.037, respectively) and in female squid collected in June (R= 0.062). Fish species that showed greatest similarity included H. hanseni and D. danae (R = 0.02 and 0.05, respectively). As a prey group, other fish demonstrated less association with arrow squid profiles (R = 0.57–0.92) with the exception of L. denticulatus, which was very similar in profile (R = 0. 01; Figure 2). For male and female arrow squid there was limited association with other squid prey profiles (R = 0.51–0.79) and no association (R = 1) was displayed with the two crustaceans (shrimps Acanthephyra sp. and Sergia potens).
DISCUSSION
The diet of Nototodarus gouldi as indicated by stomach content and digestive gland lipid and FA profiles varied markedly over the one year sampling period. Stomach contents provide clear evidence for dietary shift in prey groups consumed by N. gouldi. Multivariate comparisons of lipid and FA profiles also indicated seasonal differences in the diet of N. gouldi. Evidence of diet variation between gender, two size-classes (<or > 300 mm ML) and life-history (maturation) stages of females was also revealed with lipid and FA profile comparisons. Stomach contents and FA results are discussed in detail below.
Stomach contents
The diet of N. gouldi, as determined by stomach content analysis, is typical of adult ommastrephid squid that feed on a diverse range of fish, cephalopods and crustaceans (Rodhouse & Nigmatullin, Reference Rodhouse and Nigmatullin1996; Dawe et al., Reference Dawe, Dalley and Lindster1997; Phillips et al., Reference Phillips, Nichols and Jackson2002). During the one year sampling period, N. gouldi fed largely on fish, consisting of two dominant taxa, and supplemented its diet with a range of other prey. During the summer months, the myctophid, L. hectoris, dominated while during the winter period cephalopods (as a prey group) and the pearlside (M. muelleri) dominated. Lampanyctodes hectoris is one of the few species of lanternfish to inhabit shallow waters, and in those waters it is one of the most abundant species of fish, and central to the food chain of the upper continental slope (Young, Reference Young1998). In contrast, pearlsides (M. muelleri) are small shoaling fish which occur along the continental shelf break, mainly confined to waters between 300 and 400 m (Clark, Reference Clark1982). Both species experience large seasonal fluctuations (Rosland & Ciske, Reference Rosland and Ciske1997; Williams & Koslow, Reference Williams and Koslow1997) which is reflected in the diet of N. gouldi. Similar to the trend found here, Williams & Koslow (Reference Williams and Koslow1997) reported that populations of M. muelleri occurring in Tasmanian waters were much more abundant in autumn. In contrast, Williams & Koslow (Reference Williams and Koslow1997) reported that L. hectoris were only present in spring, whereas in our study the occurrence of L. hectoris was higher in summer months. In other parts of the world, mesopelagic fish (especially L. hectoris) are known to move offshore in winter because of their spawning migration into deeper water (Hulley & Lutjeharms, Reference Hully and Lutjeharms1989), which may account for the reduction of lanternfish in the diet of N. gouldi during that period.
In the pelagic ecosystem off the south coast of South Australia and western Victoria, a diverse suite of small pelagic fish occurs, largely dominated by members of family Clupeidae (herring-like fish) (Ward et al., Reference Ward, Goldsworthy, Rogers, Page, McLeavy, Dimmlich, Einoder, Wiebkin, Roberts, Daly, Caines and Huveneers2008). Key species include sardine (pilchard, Sardinops pilchardus), Australian anchovy (Engraulis australis), sandy sprat (Hyperlophus vittatus), blue sprat (Spratelloides spp.), blue mackerel (Scomber australasicus), redbait (Emmelichthys nitidus) and saury (Scomberesox saurus) (Ward et al., Reference Ward, Goldsworthy, Rogers, Page, McLeavy, Dimmlich, Einoder, Wiebkin, Roberts, Daly, Caines and Huveneers2008). However, in this study only 2 occurrences of sardines (Sardinops neopilchardus) were observed in the month of September. The absence of these prominent fish species in this study, particularly for those specimens collected over the winter and spring sampling months (Table 1), is likely to be related to the different distributions of these particular fish species in the waters off south-eastern Australia and emphasizes the generalist foraging behaviour of N. gouldi. For example, in arrow squid collected in Bass Strait, pilchards (Sardinops pilchardus) and juvenile barracouta (Leionura atun) were reported as the most common fish prey species identified (O'Sullivan & Cullen, Reference O' Sullivan and Cullen1983), while in squid collected in the eastern Great Australian Bight, redbait (Emmelichthys nitidus) and jack mackerel (Trachurus declivis) have greater representation in the diet (Braley et al., Reference Braley, Goldsworthy, Page, Steer and Austin2010). Alternatively, as these species can be caught as by-catch in coastal trawl operations, these finding may suggest some bias associated with fishing gear as has been described by Ibáñez et al. (Reference Ibáñez, Arancibia and Cubillos2008).
Arrow squid was found to consume a large range of prey sizes with some individuals consuming large fish relative to their mantle length. However, most fish consumed were small (<20 cm TL), including the two dominant prey species L. hectoris (maximum 11 cm SL) and M. mulleri (maximum 7 cm SL). These results suggest that N. gouldi feed predominantly on small mesopelagic prey, but are capable of exploiting an array of small to medium sized prey. Such patterns in the size-selectivity of squid diet have been observed in many species (reviewed by Rodhouse & Nigmatullin, Reference Rodhouse and Nigmatullin1996) and can be influenced by seasonal changes in size of prey (Collins & Pierce, Reference Collins and Pierce1996).
The high occurrence of parasitic loadings of the larval nematode Anisakis spp. suggests that N. gouldi is an important intermediate host species to higher-order predators (González et al., Reference González, Pascual, Gestal, Abollo and Guerra2003). Such occurrences of not only nematodes but other parasitic fauna such as larval cestodes are very common in a number of ommastrephid squid globally (Abollo et al., Reference Abollo, Gestal, López, González, Guerra and Pascual1998; Pardo-Gandarillas et al., Reference Pardo-Gandarillas, Lorhmann, Valdivia and Ibáñez2009). The increased number of infestations during August and September compared to other sampling months indicate that N. gouldi may predate in different trophic pathways during these times. This seems to be governed by the increased consumption of cephalopods during these months. Alternatively, it may be governed by the distribution of marine mammals which are the final hosts required by nematodes to complete their life cycle (Haimovici et al., Reference Haimovici, Bruetti, Rodhouse, Csirke, Leta, Rodhouse, Dawe and O'Gor1998).
Lipid content
The lipid content of N. gouldi is lower than that reported in other ommastrephid squid (e.g. Nototodarus sloanii, Vlieg, Reference Vlieg1984; Todarodes pacificus, O'Dor & Webber, Reference O'Dor and Webber1986; Todarodes filippova, Pethybridge, unpublished results). In contrast, N. gouldi has higher lipid content than that reported in most coastal species (Sepioteuthis australis, Phillips et al., Reference Phillips, Nichols and Jackson2002; Sepia offinalis, Blanchier & Boucaud-Camou, Reference Blanchier and Boucaud-Camou1984). Interspecific differences may be an indicator of the food availability and system bioenergetics in different regions as proposed by Abolmasova et al. (Reference Abolmasova, Shul'man, Shchepkina and Dzhiganshin1990). For example, in the southern ocean onychoteuthid squid, Moroteuthis ingens, collected from three geographically isolated areas, Phillips et al. (Reference Phillips, Nichols and Jackson2003) correlated different lipid contents to differences in regional productivity. In the present study, mean lipid content of N. gouldi was higher (mean > 19%) during summer collection months and was consistently low (mean < 13%) during other months (Table 2). This is likely to reflect known seasonal differences in primary productivity off South Australia, in which upwelling events occur during summer and autumn (Middleton, Reference Middleton2000). It may also reflect the decrease in consumption of myctophid and other oily (high calorific energy) fish species (Pethybridge et al., Reference Pethybridge, Daley, Virtue, Butler, Cossa and Nichols2010) which are less available in coastal waters during winter (Hulley & Lutjeharms, Reference Hully and Lutjeharms1989). Castellanos (Reference Castellanos1960) estimated that lipid stored in the digestive gland of Illex argintinus was sufficient to fuel a spawning migration of up to 21 days. However, given that cephalopods have a protein-based metabolism (O'Dor & Webber, Reference O'Dor and Webber1986), it may be that squid are unable to handle the high levels of lipids from predation on oily fish and the lipids are getting dumped into the digestive gland for excretion, as has been shown in loliginid squid (Semmens, Reference Semmens1998).
Lipid-class and fatty acid composition
Lipid-class and FA profiles of the digestive gland of N. gouldi demonstrated dietary variability which is explained by seasonal, gender and size-related differences. Similarly to stomach contents, multidimensional scaling analysis of FA profiles highlighted that myctophids, squid and certain non-myctophid fish are strongly represented in the diet of N. gouldi, and that crustaceans are unlikely to be more than supplementary components (Figure 2). Although prey profile comparisons were undertaken, FA data were not used to determine which prey species may be responsible for intraspecific variation, as temporal, size and spatial variation in FA content has been recorded in several mesopelagic fish, cephalopods and crustaceans (Lea et al., Reference Lea, Nichols and Wilson2002; Iverson et al., Reference Iverson, Frost and Lang2002; Darlsgaard et al., Reference Dalsgaard, St John, Kattner, Müler-Navarra and Hagen2003). Instead, we used signature lipid and FA to investigate which biological and temporal variables are most responsible for intraspecific variation as it relates to diet.
Intraspecific variation
There are apparent trends in the FA and lipid-class profiles that indicate dietary differences among sampling dates, consistent with findings in the stomach contents. Digestive glands from N. gouldi collected during summer months have higher relative levels of TAG, but lower PL and ST in comparison to collection months between 7 June 2007 and 15 October 2007 (Table 2). These seasonal differences are likely to be attributed to diet, with high levels (>70%) of TAG associated with some species of myctophid fish (e.g. L. australis and H. hanseni; Pethybridge et al., Reference Pethybridge, Daley, Virtue, Butler, Cossa and Nichols2010). Therefore, high TAG during summer months is likely to be due to an oil-rich myctophid diet, as shown in the stomach contents. Most other fish species (including Maurolicus australis), along with cephalopods, have lower relative levels of TAG and increased PL (Pethybridge et al., Reference Pethybridge, Daley, Virtue, Butler, Cossa and Nichols2010). A smaller number of fish contain WE as their major storage lipid, which is reflected in the lipid-class profiles of arrow squid.
Fatty acid profiles of digestive glands collected in autumn were most dissimilar to other sampling dates and particularly to winter FA profiles, being significantly lower in 22:6ω3 and significantly higher in 16:0 and 18:1ω9. As found in stomach contents, FA results agree with the high consumption of mesopelagic fish in autumn followed by a dietary shift to greater proportions of crustaceans and cephalopods during the winter period. However, some conflicting results were observed between FA profiles and stomach content analyses. For example, digestive glands collected in September demonstrated several significant differences from other sampling dates in the relative proportion of individual FA, containing higher 20:4ω6 and 24:1ω9 and lower 20:1ω9, 18:1ω9 and 24:1ω11. Such a profile suggests potential increased consumption of crustaceans, octopus and myctophids (Pethybridge et al., Reference Pethybridge, Daley, Virtue, Butler, Cossa and Nichols2010) which was not demonstrated by analysis of the stomach contents. Such a divergence between the stomach contents and FA data could be expected as in a controlled study; Stowasser et al. (Reference Stowasser, Pierce, Moffat, Collins and Forsythe2006) identified that FA of the squid, Lolliguncula brevis start to reflect their diet after 10 days.
Ontogenetic variation was displayed by FA profile comparisons, with squid smaller than 300 mm ML having higher PUFA (22:6ω3 and 20:5ω3) and lower levels of 18:1ω9 than larger specimens (Table 3). Higher levels of these PUFA are typical features of various crustaceans, mesopelagic squid and octopus (Pethybridge et al., Reference Pethybridge, Daley, Virtue, Butler, Cossa and Nichols2010). Such a trend is aligned with other dietary studies of N. gouldi that demonstrated an increase in the occurrence of cephalopod prey with size (O'Sullivan & Cullen, Reference O' Sullivan and Cullen1983; Uozumi, Reference Uozumi1998). In contrast, high levels of MUFA are a typical feature of teleost (Pethybridge et al., Reference Pethybridge, Daley, Virtue, Butler, Cossa and Nichols2010) and higher relative levels of 20:1ω9, 22:1ω11 and 22:1ω9 in smaller squid, are possibly indicative of a diet rich in copepods (Dalsgaard et al., Reference Dalsgaard, St John, Kattner, Müler-Navarra and Hagen2003) or more likely a diet rich in dominant predators of copepods such as myctophid fish. A similar finding is observed for large squid where significantly higher levels of 18:1ω9 and slightly higher levels of 16:0 are indicative of a diet rich in mesopelagic fish (Pethybridge et al., Reference Pethybridge, Daley, Virtue, Butler, Cossa and Nichols2010) including myctophid fish (Saito & Murata, Reference Saito and Murata1996). In agreement with our findings, O'Sullivan & Cullen (Reference O' Sullivan and Cullen1983) also observed that the consumption of fish remains relatively constant over all sizes of N. gouldi. Such findings may be related to the age and growth of N. gouldi as it has been shown to be highly variable over time and space (Jackson et al., Reference Jackson, McGrath Steer, Wotherspoon and Hobday2003). The relatively small sample sizes used in our study may also have limited our conclusions.
In general, there were few differences between the FA profiles of male and female squid (Table 3). The most significant difference was related to the PUFA, 22:6ω3, which was significantly higher in males than females. Higher levels of dietary derived long-chain PUFA and particularly 22:6ω3 may indicate an increased consumption of crustaceans and mesopelagic squid (Pethybridge et al., Reference Pethybridge, Daley, Virtue, Butler, Cossa and Nichols2010). However, the interaction between season and size-class also contributed to significant gender-related differences in the proportions of 22:6ω3. Thus, males and females may be feeding on different prey or prey-sizes throughout parts of the year. Arrow squid display sexual dimorphism; therefore this result is not surprising as smaller males would be more likely to consume smaller prey species due to morphological restrictions imposed. However, while size-class only correlated with gender for 22:6ω3, many more FA constituents were affected by the interaction among season and gender. Sexual segregations in timing and pathways of migrations have been documented for other ommastrephid squid (Arkhipkin & Middleton, Reference Arkhipkin and Middleton2002) and thus are not unlikely in this species. These segregations in time and space are likely to be reflected in the diet as each gender encounters different available prey groups.
In addition to gender–seasonal differences there is evidence of female life-stage (maturity stages 3–5) differences in FA profiles of the digestive gland. For example, high levels of 22:1ω11, 14:0 and 16:0 were characteristic of low maturity (stage 3) females. This finding is likely to be related to similarities in sizes as mature females are larger. However, to some extent, it may indicate different stages of the maternal provisioning of essential nutrition to the developing embryos as changes in life stages are often associated with changes in diet. Although evidence suggests that the digestive gland is not used as a storage organ and is unlikely to be used during reproductive development (Semmens, Reference Semmens1998), future research would benefit from discerning the role of these (and other) potential factors in influencing the FA profiles of arrow squid.
Overall, this study provides new data on the diet of N. gouldi, an abundant squid in pelagic ecosystems in southern Australian waters. The combined use of stomach contents and signature FA analysis confirmed that diet varies seasonally. These seasonal differences are likely associated with changes in local productivity and thus, species composition and availability, as indicated by seasonal changes in the total lipid content of digestive gland. Whereas stomach content analysis identified major changes between certain prey taxa, FA profiles established that diet differs between males and females and between different size-classes. Such results emphasize the power of using multiple methods for exploring not only diet composition but also longer-time integrated dietary trends as they relate to multiple biological and environmental factors. Ecosystem-based management practices should look to incorporating the results from both dietary techniques in dynamic mixing or statistical models so that the impact of small-scale (e.g. monthly) perturbations on local marine food resources can be projected.
ACKNOWLEDGEMENTS
We thank Tony Bennett and crew from the FV ‘San Tangaroa’ for collecting arrow squid for us, and Jenne Kelly from Arrow Fisheries, Portland, Victoria for storing these squid. We thank Dr Ann Pulsford and two anonymous journal referees for their helpful comments during review of the manuscript. This work was supported by an Australian Fisheries Research Development Corporation Grant (Ref. No. 2006/012).


