NOMENCLATURE
- b
wing span, m
- c
mean aerodynamic chord, m
- CD
drag coefficient
- CL
lift coefficient
- Cl
rolling moment coefficient
- Cm
pitching moment coefficient
- Cn
yawing moment coefficient
- Iy
moment of inertia about y-axis
- K
gain
- L, M, N
roll, pitch and yaw moment, N.m
- m
mass, kg
- nz
normal acceleration at pilot's station
- nzc
normal acceleration command
- p, q, r
roll, pitch and yaw rate, rad/s
- q
dynamic pressure, kg/m3
- S
wing area, m2
- T
thrust, N
- U
axial velocity, m/s
- α
angle-of-attack, rad
- β
side-slip angle, rad
- δa
aileron deflection, rad
- δe
elevator deflection, rad
- δr
rudder deflection, rad
- ω
frequency, rad/s
- ϕ
roll angle, rad
- θ
pitch angle, rad
- ζ
damping ratio
Acronyms
- AVL
Athena vortex lattice
- cg
centre of gravity
- CL
closed loop
- cp
centre of pressure
- FBW
fly by wire
- FTC
fault-tolerant control
- MAC
mean aerodynamic chord
- np
neutral point
- OL
open loop
- PG
Pradtl-Glauert
- sm
static margin
1.0 INTRODUCTION
Fly-by-Wire (FBW) systems have accumulated a safety record much superior to previous designs since their introduction to commercial aircraft. The decline in accidents related to out-of-envelope manoeuvres and stall has resulted mainly from the flight protection systems included in most FBW systems(Reference Niedermeier and Lambregts1). Superior handling qualities are achieved through the harmonisation of pilot control effort with the degree of static stability, and the dynamic stability of the airframe and aircraft response is designed to be invariant over a large flight envelope. Further significant advantages include weight reduction, ease of maintenance, flexibility for including new functionality and the compact integration of multiple sub-systems into a new single sub-system. Advanced control requirements such as improved robustness can also be achieved more efficiently. The increase in threats to the safety of civil and military aircraft has resulted in a renewed interest in the design of more robust control systems for aircraft with structural damage(Reference Shah2).
In-flight damage of the aircraft structure may result in changes in airframe aerodynamics, mass and inertia properties. This leads to a change in the dynamic behaviour of the aircraft and is therefore an undesirable occurrence. Depending on the extent and type of damage, the aircraft may become completely uncontrollable. Japan Airline flight 123(3) and American Airlines flight 587(4) (both having lost their vertical stabilisers in-flight) are examples of how structural damage to tail surfaces may lead to catastrophic loss of control. In the Gol Transportes Aereos Flight 1907(5) accident, however, after partial damage to the left horizontal stabiliser and left winglet, the aircraft continued flying and landed safely by application of excessive control inputs.
Research into Fault-Tolerant Control (FTC) for damaged aircraft has been extensively carried out in the past. The focus of FTC studies is to create a controller capable of maintaining its designed response in the presence of significant plant model changes. A robust system therefore maintains tolerable aircraft response after damage occurred by essentially minimising the resulting change in closed loop dynamic behaviour. In Refs Reference Nguyen, Krishnakumar and Kaneshige6-Reference Hitachi and Liu12, FTC strategies are explored for wing, horizontal and vertical tail damage. Zhao(Reference Zhao, Jiang, Shi and He7) uses sliding mode control to maintain stability under different degrees of damage of the vertical tail. Paton(Reference Tang and Patton8) presents the use of a linear matrix inequality approach to obtain robust stability after wing damage and Liu(Reference Li and Liu9) discusses a passive controller for vertical tail damage. These studies are control-oriented and the damage problem is modelled as an augmentation of the conventional linearised aircraft state equation. In such an approach, a parameter variation matrix which is representative of the damage is added and pre-multiplied by a scalar that is representative of the extent of damage.
An efficient alternative to this approach of modelling is a dynamics-oriented study. This would provide an understanding of the change in flight mechanics of the damaged aircraft. Visibility of how the dynamic modes are changing as a result of the specific damage allows an evaluation of preferable control schemes to be made. The purpose of this study is to investigate the change in aircraft dynamics resulting from horizontal tail damage and to provide insight to the robustness of current generic commercial FBW systems to this kind of damage. This provides a knowledge base for the efficient design of more robust FBW control systems.
As argued by Bramesfeld(Reference Bramesfeld, Maughmer and Willits10), the chances of successfully controlling and landing an aircraft when exposed to damage conditions are greatly increased if the flight crew is trained on unconventional control strategies to mitigate the change in aircraft response. An understanding of how flight dynamics are changed by damage provides a basis from which to develop alternative control strategies. This study seeks to provide an understanding of the dynamic and static effects of tail damage. Particular attention is paid to the aircraft response presented to the pilot after damage has occurred by analysing the change in handling qualities as defined by MIL-STD-1797-A(Reference Crider11). A significant change in handling qualities may make it difficult or impossible for the pilot to either keep the aircraft under control or to execute mission tasks.
This paper describes the simulation of a large transport aircraft to investigate the change in dynamics resulting from horizontal tail damage. A simple first-order estimation of change in aerodynamic properties is carried out using a vortex lattice code. An analysis of the resulting change in flight mechanics is presented for both conventionally controlled (i.e. open loop) aircraft and modern FBW aircraft. A comparison between the two types of damaged aircraft is made to quantify, in terms of the change in handling qualities, the robustness of FBW control systems against tail damage.
2.0 METHODS
2.1 Test description
The change in flight dynamics of a conventional aircraft was investigated by observing how the characteristic poles move on the s-plane as a result of the damage. The same experiment was carried out for an FBW aircraft and the two results compared to quantify the difference in pole movement and thus to analyse the robustness of the FBW control system. The damaged aircraft's poles were contrasted to the ideal poles as specified by handling quality standards to investigate the degree of performance degradation.
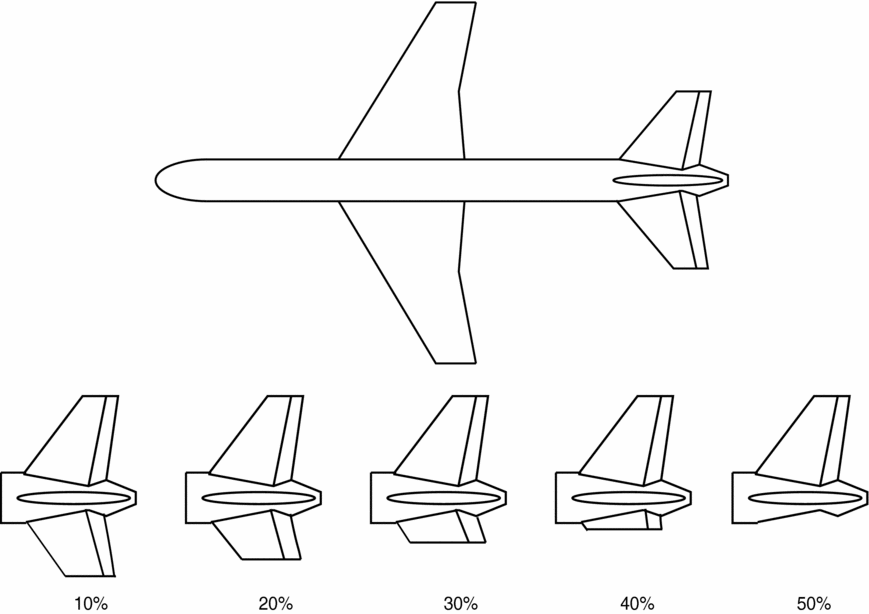
From the studies presented in Refs 14-16, structural damage may change an aircraft's centre of mass, aerodynamic characteristics and inertial properties. Thus, the main focus of damage modelling is an investigation into the changes of these parameters. Boeing 747 aircraft data is widely used in dynamics and control studies and is therefore used in this simulation to enable comparison with similar research. If it is assumed that aerodynamic tail surfaces are to be partially removed, then the effect of change in moment of inertia and mass on the dynamic behaviour of a huge B747 is relatively small(Reference Zhao, Jiang, Shi and He7,Reference Li and Liu9) . The primary effects are aerodynamic in nature. Reduction in rear weight due to tail loss results in a forward centre-of-gravity shift, which in turn increases the stability margin. By assuming a fixed centre of gravity (cg) position, an underestimation is made on the actual static stability. This error is considered small and insignificant. In this study, only horizontal tail damage is assumed. The stabiliser loss is modelled as smooth and straight break lines as shown in Fig. 1. In practice, irregular edges would be formed, resulting in effects such as increased drag and lateral motion. These non-linear effects are considered to be outside the scope of this study. Athena Vortex Lattice computational fluid dynamics code is used to obtain the aerodynamic coefficients for various degrees of damage. The stabiliser size is reduced in chord-wise cuts along the span at intervals of 10% from 0% to 50% as illustrated in Fig. 1.

Figure 1. Horizontal stabiliser damage from 10% to 50%.
The equations of motion for a conventional aircraft are often derived to describe the transient response about trimmed flight after a small input disturbance. When only small perturbation transient motion on a symmetric aircraft is considered longitudinal-lateral coupling is negligible(Reference Etkin and Reid18,Reference Cook19) . In the design of FBW control systems, it is often assumed that the aircraft is symmetric and its motion is limited to small angles; hence, lateral and longitudinal motions can be decoupled. Due to the non-symmetric nature of the damage, it is necessary to first investigate the coupling problem that may result. The characteristic poles of the damaged aircraft for the coupled case are compared to the decoupled poles to investigate lateral and longitudinal coupling resulting from the damage. The coupled state equation describing aircraft dynamics as discussed in Ref. (16) is shown in Equation (1). To derive the coupled equations of motion from the decoupled equations (presented in Ref. (Reference Blakelock20)), the aerodynamic force equations are extended to include the stability derivatives of the coupling terms. An example is shown in Equation (2) for the pitching moment (the last five terms consist of coupling derivatives).
 $$\begin{equation}
\left[{\begin{array}{*{20}{l}}
{\dot U}\\
{\dot \alpha }\\
{\dot q}\\
{\dot \alpha }\\
{\dot \theta }\\
{\dot p}\\
{\dot r}\\
{{\dot \phi} } \end{array}} \right]
= \left[\begin{array}{*{20}{l}}
{\frac{{d{\dot U}}}{{dU}}}&{\frac{{d{\dot U}}}{{d\alpha }}}&{\frac{{d{\dot U}}}{{dq}}}&{\frac{{d{\dot U}}}{{d\theta }}}&{\frac{{d{\dot U}}}{{d\beta }}}&{\frac{{d{\dot U}}}{{dp}}}&{\frac{{d{\dot U}}}{{dr}}}&{\frac{{d{\dot U}}}{{d\phi }}}\\
{\frac{{d{\dot \alpha} }}{{dU}}}&{\frac{{d{\dot \alpha} }}{{d\alpha }}}&{\frac{{d{\dot \alpha} }}{{dq}}}&{\frac{{d{\dot \alpha} }}{{d\theta }}}&{\frac{{d{\dot \alpha} }}{{d\beta }}}&{\frac{{d{\dot \alpha} }}{{dp}}}&{\frac{{d{\dot \alpha} }}{{dr}}}&{\frac{{d{\dot \alpha} }}{{d\phi }}}\\
{\frac{{d{\dot q}}}{{dU}}}&{\frac{{d{\dot q}}}{{d\alpha }}}&{\frac{{d{\dot q}}}{{dq}}}&{\frac{{d{\dot q}}}{{d\theta }}}&{\frac{{d{\dot q}}}{{d\beta }}}&{\frac{{d{\dot q}}}{{dp}}}&{\frac{{d{\dot q}}}{{dr}}}&{\frac{{d{\dot q}}}{{d\phi }}}\\
{\frac{{d{\dot\theta} }}{{dU}}}&{\frac{{d{\ddot\theta} }}{{d\alpha }}}&{\frac{{d{\ddot\theta} }}{{dq}}}&{\frac{{d{\dot\theta} }}{{d\theta }}}&{\frac{{d{\dot\theta} }}{{d\beta }}}&{\frac{{d{\dot\theta} }}{{dp}}}&{\frac{{d{\dot\theta} }}{{dr}}}&{\frac{{d{\dot \theta} }}{{d\phi }}}\\
{\frac{{d{\dot \beta} }}{{dU}}}&{\frac{{d{\dot \beta} }}{{d\alpha }}}&{\frac{{d{\dot \beta} }}{{dq}}}&{\frac{{d{\dot \beta} }}{{d\theta }}}&{\frac{{d{\dot \beta} }}{{d\beta }}}&{\frac{{d{\dot \beta} }}{{dx}}}&{\frac{{d{\dot \beta} }}{{dr}}}&{\frac{{d{\dot \beta} }}{{d\phi }}}\\
{\frac{{d{\dot p}}}{{dU}}}&{\frac{{d{\dot p}}}{{d\alpha }}}&{\frac{{d{\dot p}}}{{dq}}}&{\frac{{d{\dot p}}}{{d\theta }}}&{\frac{{d{\dot p}}}{{d\beta }}}&{\frac{{d{\dot p}}}{{dp}}}&{\frac{{d{\dot p}}}{{dr}}}&{\frac{{d{\dot p}}}{{d\phi }}}\\
{\frac{{d{\dot r}}}{{dU}}}&{\frac{{d{\dot r}}}{{d\alpha }}}&{\frac{{d{\dot r}}}{{dq}}}&{\frac{{d{\dot r}}}{{d\theta }}}&{\frac{{d{\dot r}}}{{d\beta }}}&{\frac{{d{\dot r}}}{{dp}}}&{\frac{{d{\dot r}}}{{dr}}}&{\frac{{d{\dot r}}}{{d\phi }}}\\
{\frac{{d{\dot \phi} }}{{dU}}}&{\frac{{d{\dot \phi} }}{{d\alpha }}}&{\frac{{d\phi }}{{dq}}}&{\frac{{d\phi }}{{d\theta }}}&{\frac{{d{\dot \phi} }}{{d\beta }}}&{\frac{{d{\dot \phi} }}{{dp}}}&{\frac{{d{\dot \phi} }}{{dr}}}&{\frac{{d{\dot \phi} }}{{d\phi }}} \end{array} \right]
\left[{\begin{array}{*{20}{l}} U\\
\alpha \\
q\\
\theta \\
\beta \\
p\\
r\\
\phi \end{array}} \right]
+ \left[{\begin{array}{*{20}{l}}
{\frac{{d{\dot U}}}{{d{\delta _e}}}}&{\frac{{d{\dot U}}}{{dT}}}&{\frac{{d{\dot U}}}{{d{\delta _a}}}}&{\frac{{d{\dot U}}}{{d{\delta _r}}}}\\
{\frac{{d\alpha }}{{d{\delta _e}}}}&{\frac{{d{\dot \alpha} }}{{dT}}}&{\frac{{d{\dot \alpha} }}{{d{\delta _a}}}}&{\frac{{d{\dot \alpha} }}{{d{\delta _r}}}}\\
{\frac{{d{\dot q}}}{{d{\delta _e}}}}&{\frac{{d{\dot q}}}{{dT}}}&{\frac{{d{\dot q}}}{{d{\delta _a}}}}&{\frac{{d{\dot q}}}{{d{\delta _r}}}}\\
{\frac{{d{\dot \theta} }}{{d{\delta _e}}}}&{\frac{{d{\dot \theta} }}{{dT}}}&{\frac{{d{\dot \theta} }}{{d{\delta _a}}}}&{\frac{{d{\dot \theta} }}{{d{\delta _r}}}}\\
{\frac{{d{\dot \beta} }}{{d{\delta _e}}}}&{\frac{{d{\dot \beta} }}{{dT}}}&{\frac{{d{\dot \beta} }}{{d{\delta _a}}}}&{\frac{{d{\dot \beta} }}{{d{\delta _r}}}}\\
{\frac{{d{\dot p}}}{{d\delta {x_e}}}}&{\frac{{d{\dot p}}}{{dT}}}&{\frac{{d{\dot p}}}{{d{\delta _a}}}}&{\frac{{d\dot p}}{{d{\delta _r}}}}\\
{\frac{{d{\dot r}}}{{d{\delta _e}}}}&{\frac{{d{\dot r}}}{{dT}}}&{\frac{{d{\dot r}}}{{d{\delta _a}}}}&{\frac{{d{\dot r}}}{{d{\delta _r}}}}\\
{\frac{{d{\dot \phi} }}{{d{\delta _e}}}}&{\frac{{d{\dot \phi} }}{{dT}}}&{\frac{{d{\dot \phi} }}{{d{\delta _a}}}}&{\frac{{d{\dot \phi} }}{{d{\delta _r}}}} \end{array}} \right]
\left[{\begin{array}{*{20}{l}} {{\delta _e}}\\ T\\ {{\delta _a}}\\ {{\delta _r}} \end{array}} \right]
\end{equation}$$\\
 $$\begin{eqnarray}
{C_m} = {C_{m0}} + {C_{m\alpha }}\alpha + \frac{{\bar c}}{{2U}}{C_{mq}}q + {C_{m\delta e}}\delta e + {C_{m\beta }}\beta + \frac{b}{{2U}}{C_{mp}}p + \frac{b}{{2U}}{C_{mr}}r + {C_{m\delta a}}\delta a\nonumber\\
&& + {C_{m\delta r}}\delta r
\end{eqnarray}$$
A representative modern FBW control system is then embedded on the decoupled damaged aircraft model and a robustness analysis to tail damage is performed.
2.2 Aerodynamic modelling
The vortex lattice method is often used in early stages of aircraft design to estimate the forces acting on lifting surfaces. It is a comparatively simple method for carrying out an aerodynamic analysis such as trim calculations and dynamic stability analysis for a given aircraft configuration. The aircraft is usually modelled as thin lifting surfaces at small angles of attack and side-slip. Ideal flow is assumed and the effect of turbulence, dissipation and boundary layers are not resolved. Athena Vortex Lattice (AVL) is the vortex lattice code used in this study.
Large commercial transport aircraft operate at both sub-sonic and transonic airspeeds. For compressibility effects AVL uses the Pradtl-Glauert method to transform the model such that it is solvable by incompressible methods. The expected validity of the Pradtl-Glauert (PG) transformation is from Mach 0 to 0.6. Due to available data(21) for trim configurations, Mach 0.5 at 20,000ft was selected as the flight condition for this test. The trim angle-of-attack is 6.8˚ and the horizontal stabiliser is inclined at –0.8˚.
The coefficients from the Boeing report(Reference Hanke and Nordwall21) are used directly for the case of 0% damage. A first-order approximation of the change in coefficients is computed in AVL for tail damage from 10% to 50% and the change is deducted from the coefficients of the undamaged aircraft.
2.3 Handling qualities
Flying and handling qualities reflect the level of ease and precision with which the pilot can accomplish the mission task. Handling-qualities standards provide predefined levels of acceptability for ranges of stability and control parameters based on flight test data accumulated over years. The MIL-STD-1797A standard contains the requirements for flying and ground handling qualities. It is intended to ensure flying qualities for adequate mission performance and flight safety regardless of the design implementation or flight control system augmentation(13). The requirements are formulated for different classes of aircraft at various stages of the flight phase and specify three levels of acceptability of an aircraft in terms of its ability to accomplish its mission task. Aircraft classification is according to weight, size and level of manoeuvrability. Flight phase categories are defined according to the required level of tracking precision, path control and whether terminal or non-terminal. This study is based on a Class III aircraft (large, heavy, low to medium manoeuvrability) on category B (non-terminal, flight phase requiring gradual manoeuvring, less precise tracking and accurate flight path control). The three levels of flying qualities are:
• Level 1 (satisfactory): adequate for mission flight phase.
• Level 2 (acceptable): adequate to accomplish mission flight phase but with increased pilot workload and or degradation in effectiveness.
• Level 3 (controllable): aircraft can be controlled in the mission flight phase but with excessive pilot workload and/or inadequate effectiveness. This level is not necessarily defined as safe; it is recommended to improve aircraft flying qualities if safety is a requirement.
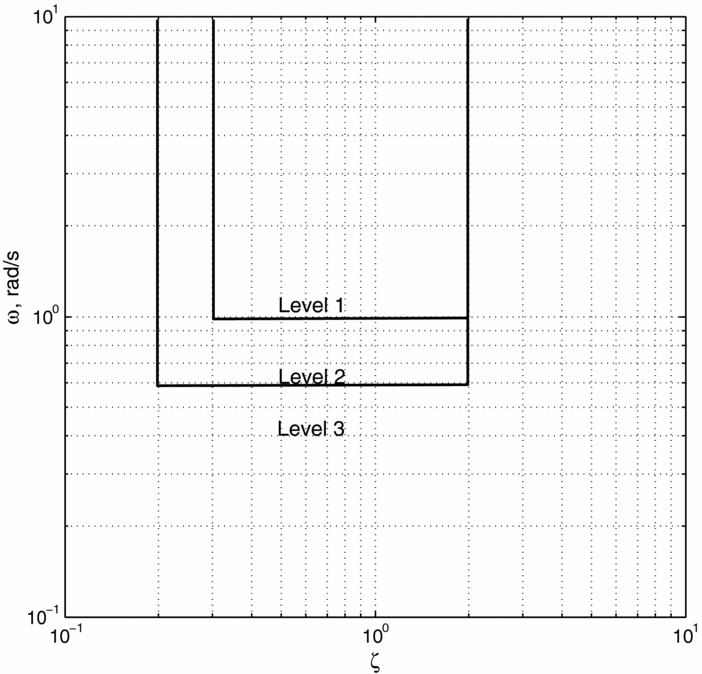
Response to pilot inputs is influenced by static and dynamic stability properties of the aircraft. Frequency, damping ratio and time constant significantly affect handling qualities. Based on an empirical study, certain combinations of these values give acceptable handling qualities. Figure 2 shows the requirements for short-period response to a pitch controller for a Class III aircraft on category B phase.

Figure 2. Requirements for short-period response to pitch controller (ω vs ζ) of a Class III aircraft in cruise configuration.
2.4 Fly-by-wire control law
Reducing the static stability of an airframe has been shown to be a significant contributing factor in decreasing aerodynamic drag to improve operational efficiency(Reference Perez, Liu and Behdinan22). The disadvantage of this design approach is a degradation in natural handling qualities. Stability augmentation by a control system is typically implemented in modern aircraft as a solution. In conventional (non-FBW) aircraft, pitch rate feedback is commonly used to modify longitudinal short period response to provide ideal handling. Studies in handling qualities, however, revealed that at high airspeed, normal acceleration is the predominant longitudinal motion cue for pilots whilst at low speeds pitch rate is dominant. This lead to the development of the C-star control law which has since become the basis for longitudinal control laws for modern commercial FBW aircraft(Reference Field23). The law is executed by an on-board computer which calculates the appropriate control surface reference. The overall control system includes added functions such as envelope protection and gust alleviation feedback loops. The FBW control laws used in this simulation is based on Airbus's FBW as presented by Favre(Reference Favre24), which is derived from the C-star law.
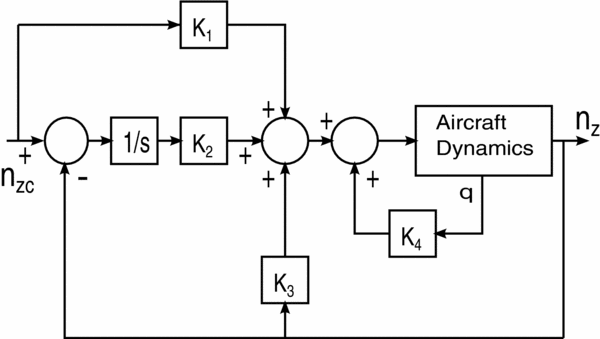
The pilot's input is transmitted to an inner loop which computes three possible actuator signals according to so-called normal, alternate and direct control laws. The normal law represents a fully operational FBW system. In the presence of faults, the system downgrades to an alternate law which implements the C-star law without envelope protection and gust alleviation. The direct law only activates pitch rate feedback. The aircraft's modal behaviour as perceived by the pilot should ideally be the same for all laws and close to the natural aircraft behaviour to ensure that the poles/modes remain invariant so the pilot is not presented with hugely varying aircraft responses when switching between the various laws. Only the open-loop and alternate mode are considered in this simulation since the envelope protection and gust alleviation functions have negligible effect on the nominal pole positions and these functions are outside the scope of this study. The C-star pitch loop control law (the alternate law) is shown in Fig. 3.

Figure 3. Longitudinal control system in C-star alternate law.
The gains are scheduled to vary as a function of airspeed, altitude and cg position. For this study the aircraft is analysed around one state condition (Mach 0.5 at 20,000ft and the cg at 25% Mean Aerodynamic Chord (MAC)), so the gains are assumed to be fixed. The proportional pitch rate and normal acceleration feedback gains were selected to represent a practical aircraft that meets the requirements of Level 1 handling qualities. To obtain a damping ratio of 0.7 in the direct law, K 4 is set to 0.8 and the corresponding ω is 1.20rad/s. The value of K 3 is selected to give a K 4/K 3 ratio of 12.4 as discussed in Ref. Reference Perez, Liu and Behdinan22. K 3 is, therefore, set to 0.0645; this gives a damping ratio of 0.6, and ω is 1.25rad/s. An integrator in the outer loop is included to improve steady state tracking and reference feed-forward to cancel the resulting closed loop pole.
3.0 RESULTS AND DISCUSSION
3.1 Open-loop aircraft
3.1.1 Longitudinal and lateral coupling
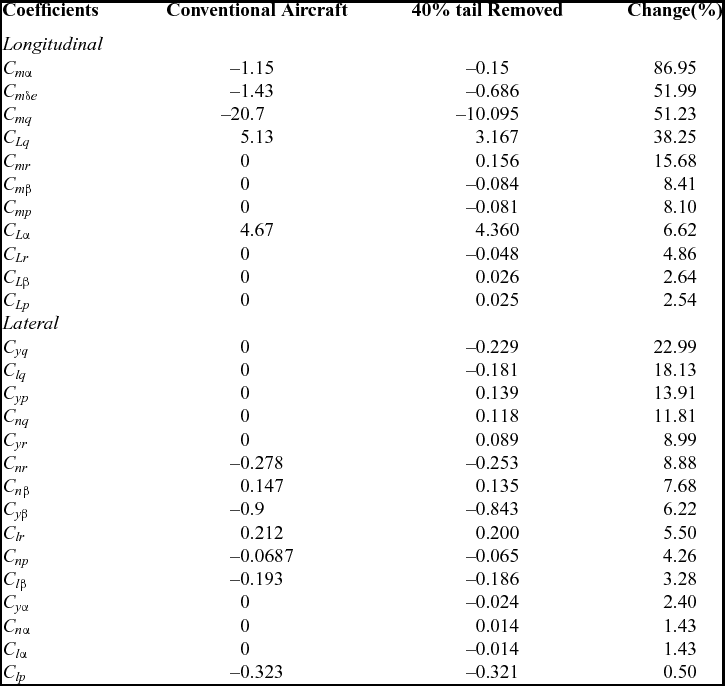
The aerodynamic coefficients of the aircraft with 40% damage were obtained using AVL and compared with the undamaged aircraft coefficients to investigate the effect of tail damage on lateral and longitudinal coupling. These results are shown in Table 1.
Table 1 Aerodynamic coefficients of damaged (40% horizontal stabiliser loss) and undamaged aircraft

The lateral aerodynamic coefficients that contribute to longitudinal motion (CLβ, CLp, CLr, Cmβ, Cmp, and Cmr) are negligibly small for the conventional symmetric aircraft. With 40% stabiliser damage, they do, however, become relatively significant. From this observation, the longitudinal dynamics of the damaged aircraft will be influenced by lateral motion. Similarly, the longitudinal coefficients contributing to lateral motion (CYα, CYq, Clα, Clq, Cnα and Cnq) become significant after damage. A comparison of the characteristic poles for the case of decoupled and coupled damaged models show the magnitude by which each dynamic mode is changed specifically due to coupling of lateral and longitudinal motion.
Figure 4 shows the poles of the damaged aircraft with 40% stabiliser loss for the coupled and decoupled equations against the undamaged (0% damage) poles. Above 40%, the behaviour of the open-loop aircraft completely changes due to instability, so 40% was selected to investigate coupling effects. Dutch roll poles show a slight change due to damage and a more significant change due to longitudinal mode coupling. The damping ratio and frequency are reduced, resulting in less stability and a more sluggish response to the pilot's lateral inputs. Figures 5 and 6 are scaled images of Fig. 4 (scale 1:10) to show roll and spiral mode poles, respectively.

Figure 4. Poles of decoupled and coupled aircraft models.

Figure 5. Roll-mode poles of decoupled and coupled aircraft model.

Figure 6. Spiral- and phugoid-mode poles of decoupled and coupled aircraft models.
From Table 1 it can be observed that Clq is increased by 18.13% with damage, and this increases the total aerodynamic rolling moment. The resultant change in dynamics is evident in the roll-mode poles moving towards the instability region and the time constant is increased by less than 0.02s. The spiral-mode poles show even less change than the roll-mode poles.
It is assumed that a lateral controller will be in place to limit lateral motion; thus, the coupling effect is considered as lateral disturbance and not included further in this analysis.
Equation (3) shows the short-period frequency approximation(Reference Blakelock20). The mode is greatly influenced by the value of Cmα and Cmq; from Table 1 it can be seen that these have the highest percentage change (85% and 53% respectively).
 $$\begin{equation}
\omega _{sp}^2 = \frac{{\frac{{\bar c}}{{2U}}{C_{mq}}{C_{L\alpha }} - \frac{{mU}}{{qS}}{C_{m\alpha }}}}{{\frac{{{I_y}}}{{qS\bar c}}\frac{{mU}}{{qS}}}}
\end{equation}$$
$$\begin{equation}
\omega _{sp}^2 = \frac{{\frac{{\bar c}}{{2U}}{C_{mq}}{C_{L\alpha }} - \frac{{mU}}{{qS}}{C_{m\alpha }}}}{{\frac{{{I_y}}}{{qS\bar c}}\frac{{mU}}{{qS}}}}
\end{equation}$$As expected, the short-period poles are primarily changed by horizontal stabiliser damage whilst the effect of lateral mode coupling is relatively small. The rest of this study is therefore based on the decoupled aircraft model and is mainly focused on longitudinal dynamics.
3.1.2 Static stability
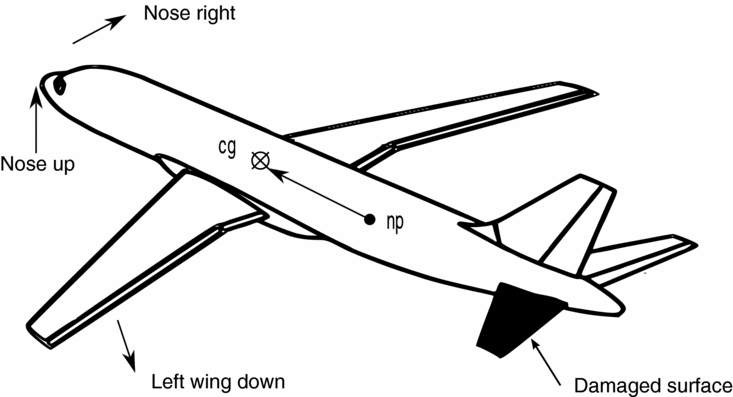
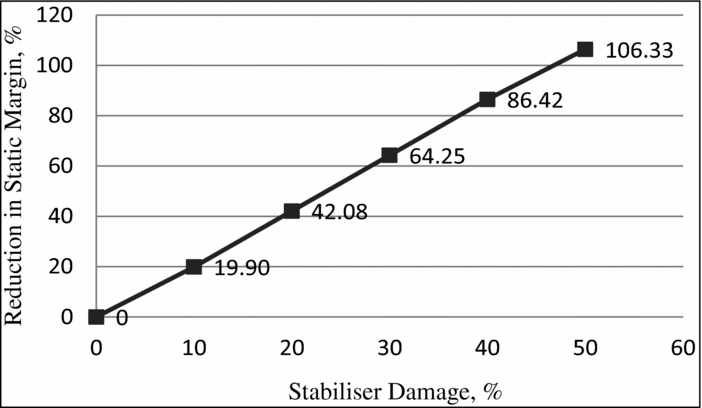
Figure 7 shows a conventional aircraft in cruise at a zero lift angle-of-attack with the neutral point (np) behind the cg. The distance between these two points is the static margin (sm) and determines the aircraft's degree of longitudinal static stability. For the cg position at 25% of the mean aerodynamic chord, the static margin of the B747 is 1.78 meters. As the stabiliser surface area is reduced along the span, the neutral point moves forward towards the cg and the static margin is decreased. The longitudinal (aircraft x-axis) position of the neutral point at each damage case was obtained from AVL. There may be a lateral shift of the np due to the non-symmetry of the damage, but it is not considered in this analysis. The primary focus is the effect of change of np position on longitudinal stability. The percentage reduction of the static margin at each damage instant is plotted in Fig. 8. The amount of stabiliser surface area loss along the span is proportional to the reduction in static margin. The reduction ratio for this aircraft is approximately 1:2 (i.e. for 10% stabiliser loss, the static margin is reduced by 20%). The amount of surface area loss increases at each interval due to the ‘swept’ geometry of the tail; hence, the change in static margin ratio shows a slight increase with damage along the span (e.g. at 40% damage the ratio is 1:2.15). With 50% damage the sm is reduced by more than 100% i.e. the neutral point is in front of the cg and longitudinal stability is lost.

Figure 7. Damaged aircraft in level flight illustrating change in moments and neutral point position.

Figure 8. Change in static margin with reduction in stabiliser span.
3.1.3 Trim
When the aircraft is cruising at the predefined trim settings, the total roll, pitch and yaw moment is zero. Since the centre of pressure location is designed to be behind the cg, the aircraft has a natural negative (nose-down) pitching moment. Hypothetically, if the cg and the centre of pressure (cp) were co-located, no elevator deflection would be required to trim in level flight. When the stabiliser span is reduced, the cp shifts forward towards the cg, and hence less elevator is required to trim. Since the aircraft is already trimmed to a nose-up position when damage occurs, moving the cp forward induces a nose-up moment. This moment, however, is slightly reduced by the loss of elevator span. This was proven by observing the total moments in AVL (Table 2).
Table 2 Moments resulting from damage, 103N.m

If the aircraft is trimmed to the flight conditions of this study with the trimmable horizontal stabiliser and elevator, and the stabiliser span is reduced, the resulting change in moments can be observed. The aircraft nose pitches up and yaws to the right whilst the port wing moves in a downward direction as illustrated on Fig. 7. The moments for each damage case were calculated from AVL coefficients as shown by the standard equations Equations (4-6).
Table 2 indicates that the roll and yaw moment steadily increase with damage until the aircraft loses its longitudinal stability at more than 40% stabiliser loss. The roll moment attainable from maximum inboard aileron deflection (±20˚) was calculated and compared to the roll moment induced by the damage. The highest value of the roll moment induced by damage as seen in Table 2 is for the case of 40% loss. This moment is less than 55% of the available inboard aileron force. Thus, it can be concluded that for tail damage up to 50%, there is sufficient aileron actuation to retain lateral trim. The yaw moment due to damage remains below 3% of total available rudder force for all cases investigated.
The pitch moment shows the greatest change with damage. The amount of elevator force available to control the aircraft is reduced by the elevator surface loss. Since minimal elevator deflection is required to trim as the static margin is reduced, this reduction becomes significant when the centre of pressure is in front of the cg. At 50% damage, the aircraft is unstable and positive elevator is required to trim nose down. From Fig. 8, it can be seen that the static margin is reduced by more than 100% and the cp is in front of the cg but only slightly. It can thus be assumed that minimal elevator is required to trim.
To investigate if there is sufficient actuation available to trim the aircraft nose down for the case of damage up to 50% stabiliser loss, it was assumed (worst case) that the aircraft is initially trimmed to the flight conditions of this study with the adjustable horizontal stabiliser only; it remains fixed and only elevator control is accessible. The nose-down moment that is attainable by full elevator deflection was calculated for each damage case according to Equation (7). The maximum allowable downwards deflection (δe Total) is 17˚ for the B747. The value of Cmδe calculated by AVL is the sum of the inner and outer elevator.
Figure 9 is a plot of the nose-up pitching moment resulting from the damage and the available elevator force to pitch the aircraft nose down to maintain the predefined trim conditions.

Figure 9. Pitching moment due to damage vs available elevator moment to trim the aircraft.
In the possible case that the stabiliser becomes immobile due to damage, there is sufficient elevator to trim the aircraft to the flight conditions of this study for damage up to 40%. If the stabiliser is movable, the aircraft can be trimmed with both elevator and stabiliser for the case of 50% loss.
The effect of transient impact forces is not within the scope of this study. However, if these are considered, the percentage of stabiliser damage that the actuators can handle may be less.
3.1.4. Dynamic stability
The value of Cmα is dependent on the aircraft's static margin. The change in Cmα can be observed on the short-period poles in Fig. 10. They gradually approach the real axis as stability reduces. They become real and one moves to the right-half plane when Cmα becomes positive at 50% stabiliser loss.

Figure 10. Damaged open-loop aircraft longitudinal poles (degree of horizontal stabiliser loss as per the legend).
As the poles move towards the real axis, the mode frequency is reduced and as a result the pilot will experience a slower response to elevator input. Lift, drag and airspeed are the main contributors to characteristics of the phugoid mode. These are not significantly affected by tail damage; thus, the phugoid mode poles in Fig. 10 only show considerable change at 50% tail loss where they move to a new equilibrium.
3.2 Closed-loop aircraft
The control law depicted in Fig. 3 comprises multiple feedback loops to maintain the required output. Feedback systems should be relatively insensitive to external disturbances and parameter variations. As previously discussed, tail damage causes a large variation to the open-loop aircraft short-period poles, resulting in complete loss of stability when half the tail is removed. The efficiency of the longitudinal FBW controller in limiting variation of these poles due to the damage is analysed by comparing the pole variation of the FBW (closed-loop) aircraft model to the open-loop model.
Figure 11 shows that with 40% damage, the frequency decreases from 1.25 to 0.72rad/s, i.e. a reduction of 42%. The open-loop aircraft's short period poles have a natural frequency of 1.02rad/s which decreases to 0.447rad/s with 40% damage, a reduction of 56%. From this comparison, it can be concluded that the FBW system improves robustness to tail damage. For the FBW aircraft, approximately up to 15% more stabiliser surface area may be lost for an equivalent change in dynamics to the open-loop aircraft.

Figure 11. Damaged open-loop vs closed-loop aircraft longitudinal poles illustrating change in handling qualities levels.
At 50% damage, the short-period poles of the closed-loop aircraft are stable. Figure 12 shows the phugoid poles and short-period poles with 50% damage. The control system restrains the short-period poles and keeps them within the stable region with half the horizontal tail removed. The previously marginally stable phugoid poles become real and one moves to the unstable region when the aircraft loses its natural stability. The unstable phugoid pole has a low frequency that is within the pilot's control capability. Stability of the mode can be retained with a basic feedback loop to limit phugoid pole movement.

Figure 12. Damaged closed-loop aircraft longitudinal poles for 50% and 60% stabiliser loss.
The longitudinal poles for the case of 60% loss are shown in Fig. 12. The phugoid poles become complex and stable whilst the short-period poles move further apart with one being unstable. The closed-loop pole position is approximately equal to the open-loop poles for 50% damage (Fig. 10). Whilst the conventional aircraft becomes unstable for damage above 40%, the FBW aircraft remains stable with half the horizontal stabiliser lost (if the phugoid poles are retained within the stability region).
Figure 11 shows how the handling qualities of the B747 at cruise are degraded from one level to the other as the extent of damage is increased. For the FBW aircraft with 20% tail loss, response to pilot input is still adequate and satisfactory with behaviour quantified as Level 1. With 30% tail loss the control response is downgraded to Level 2, so increased pilot workload is required to manoeuvre. Although the aircraft has acceptable flying qualities up to 40% damage at cruise, it may be more difficult to handle in landing configurations and be classified at Level 3. With 50% damage, the short-period poles are stable, the value of ζ is 0.8 and ω is 0.588rad/s, meaning it has Level 3 qualities. Excessive pilot workload is required and the aircraft may be unsafe and ineffective towards completing its mission task.
4.0 CONCLUSIONS
Non-symmetric horizontal tail damage greatly changes short-period dynamics and to a lesser extent the Dutch roll mode through coupling. The short-period frequency is lowered resulting in reduced responsiveness to the pilot elevator input. The asymmetry in the damage induces lateral motion, so increased lateral disturbance must be considered in the control system design. With 50% stabiliser loss, the open-loop aircraft is statically unstable and the neutral point moves to the front of the cg.
The version of the C-star FBW control system implemented in this study improves robustness such that with 50% stabiliser loss the aircraft is stable. Instability occurs when 60% of the stabiliser is damaged. The aircraft has sufficient actuator movement to trim for stabiliser damage up to 50%. The FBW aircraft with 50% tail loss has Level 3 short-term longitudinal handling qualities. It is stable and controllable although it is not considered safe to fly. The phugoid poles do not change significantly for damage up to 40%. With 50% loss, these poles divide and one becomes unstable. The unstable pole has a very low frequency and is within the control capability of the pilot.
The next step of this research is to improve the robustness of FBW to horizontal tail damage by minimising short-period pole movement such that they are contained within an acceptable level of handling qualities (Level 2) with half the stabiliser removed.
ACKNOWLEDGEMENT
The financial assistance of the National Research Foundation (NRF) towards this research is hereby acknowledged. Opinions expressed and conclusions arrived at are those of the authors and are not necessarily to be attributed to the NRF.


